STATISTICAL BRIEF #219 |
December 2016
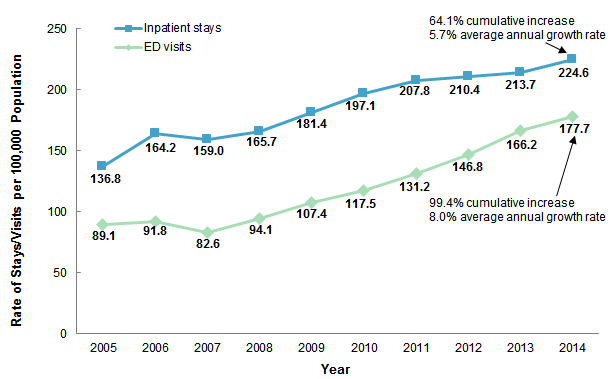
(Revised January 2017)* Audrey J. Weiss, Ph.D., Anne Elixhauser, Ph.D., Marguerite L. Barrett, M.S., Claudia A. Steiner, M.D., M.P.H., Molly K. Bailey, and Lauren O'Malley Introduction The opioid epidemic has reached alarming levels in many parts of the United States, affecting the lives of thousands of individuals and families. Between 2000 and 2014, the rate of overdose deaths involving opioids in the United States increased 200 percent.1 Between 2013 and 2014 alone, the rate of opioid overdose deaths increased 14 percent, from 7.9 to 9.0 per 100,000 population.2 Hospitalizations related to opioid misuse and dependence also have increased dramatically, with the rate of adult hospital inpatient stays per 100,000 population nearly doubling between 2000 and 2012.3 The substantial increase over the past decade in the misuse of opioids, which include prescription opioids and illicit opioids such as heroin, has been declared an "opioid epidemic" by the U.S. Department of Health and Human Services (HHS).4 In March 2015, HHS launched its Opioid Initiative to help reverse the increasing trend in opioid misuse, use disorder, and overdoses, and to support State efforts to address the opioid crisis.5 In response to HHS initiatives, in December 2016 the Agency for Healthcare Research and Quality released statistics on opioid-related hospital use by State in the interactive, online tool for the Healthcare Cost and Utilization Project (HCUP), HCUP Fast Stats.6 This HCUP Statistical Brief presents data from HCUP Fast Stats on the national rate of opioid-related hospital inpatient stays and emergency department (ED) visits from 2005 to 2014. Rates for more than 40 individual States and the District of Columbia are provided for 2014 along with changes in rates for the 6-year period from 2009 to 2014. Identification of opioid-related stays and visits is based on all-listed diagnoses and includes events associated with prescription opioids or illicit opioids such as heroin. Differences greater than 10 percent between estimates are noted in the text. Findings National rate of opioid-related inpatient stays and ED visits, 2005-2014 Figure 1 presents the national rate per 100,000 population of opioid-related inpatient stays and ED visits from 2005 through 2014. |
|
|
Figure 1. National rate of opioid-related inpatient stays and emergency department visits, 2005-2014
Abbreviation: ED, emergency department Line graph that shows the rate of inpatient stays and emergency department visits per 100,000 population from 2005 to 2014. Inpatient stays: 2005, 136.8; 2006, 164.2; 2007, 159.0; 2008, 165.7; 2009, 181.4; 2010, 197.1; 2011, 207.8; 2012, 210.4; 2013, 213.7; 2014, 224.6, for a 64.1% cumulative increase and a 5.7% average annual growth rate. Emergency department visits: 2005, 89.1; 2006, 91.8; 2007, 82.6; 2008, 94.1; 2009, 107.4; 2010, 117.5; 2011, 131.2; 2012, 146.8; 2013, 166.2; 2014, 177.7, for a 99.4% cumulative increase and an 8.0% average annual growth rate.
|
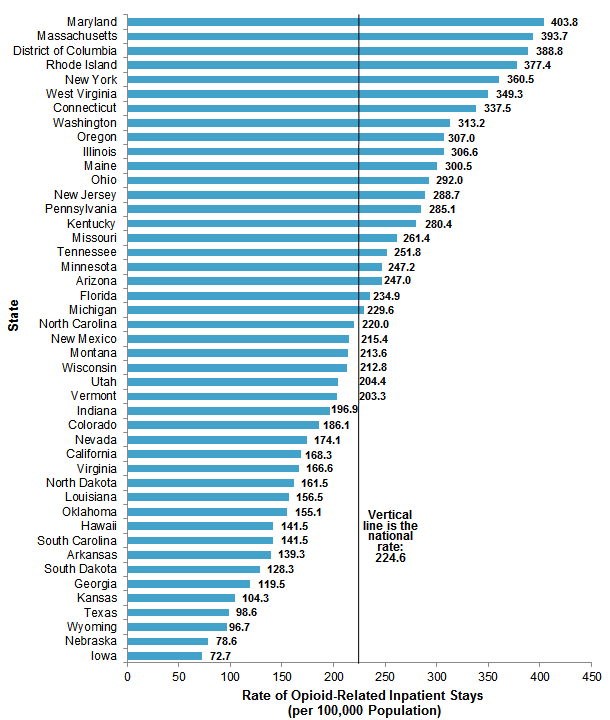
State rates of opioid-related inpatient stays, 2014 Figure 2 presents the rate per 100,000 population of opioid-related inpatient stays among 43 States and the District of Columbia that provided data in 2014. States are ordered according to their rate of opioid-related stays. |
|
Figure 2. Rate of opioid-related inpatient stays by State, 2014
Source: Agency for Healthcare Research and Quality (AHRQ), Center for Delivery, Organization, and Markets, Healthcare Cost and Utilization Project (HCUP), HCUP Fast Stats, Opioid-Related Hospital Use (https://datatools.ahrq.gov/hcup-fast-stats) based on the HCUP National Inpatient Sample (NIS) and the HCUP State Inpatient Databases (SID) Bar chart that shows the rate of opioid-related inpatient stays per 100,000 population by State. Maryland: 403.8; Massachusetts: 393.7; District of Columbia: 388.8; Rhode Island: 377.4; New York: 360.5; West Virginia: 349.3; Connecticut: 337.5; Washington: 313.2; Oregon: 307.0; Illinois: 306.6; Maine: 300.5; Ohio: 292.0; New Jersey: 288.7; Pennsylvania: 285.1; Kentucky: 280.4; Missouri: 261.4; Tennessee: 251.8; Minnesota: 247.2; Arizona: 247.0; Florida: 234.9; Michigan: 229.6; North Carolina: 220.0; New Mexico: 215.4; Montana: 213.6; Wisconsin: 212.8; Utah: 204.4; Vermont: 203.3; Indiana: 196.9; Colorado: 186.1; Nevada: 174.1; California: 168.3; Virginia: 166.6: North Dakota: 161.5; Louisiana: 156.5; Oklahoma: 155.1; Hawaii: 141.5; South Carolina: 141.5; Arkansas: 139.3; South Dakota: 128.3; Georgia: 119.5; Kansas: 104.3; Texas: 98.6; Wyoming: 96.7; Nebraska: 78.6; Iowa: 72.7. National rate of opioid-related stays per 100,000 population: 224.6.
|
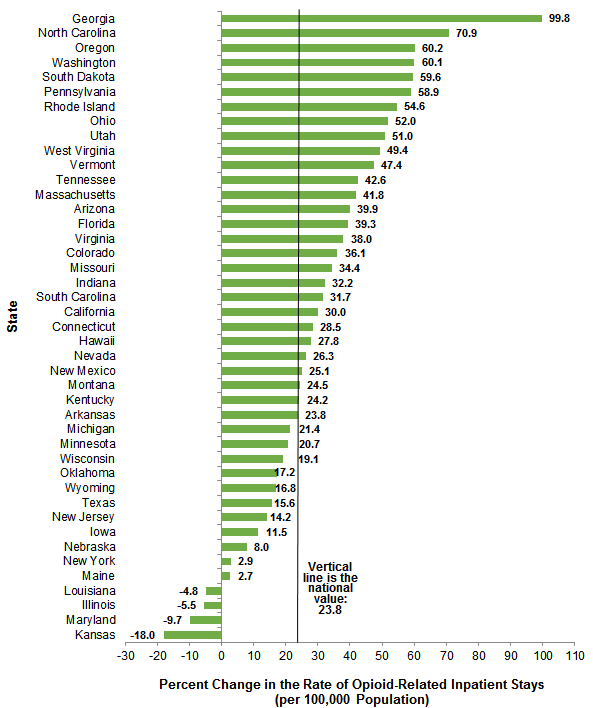
Figure 3 illustrates the percent change in the population rate of opioid-related inpatient stays from 2009 to 2014 among 43 States with data available in both years. States are ordered according to the percent change in their rate of opioid-related stays over the 6-year time period. |
|
Figure 3. Cumulative percent change in the rate of opioid-related inpatient stays by State, 2009-2014
Note: Percent change could not be calculated for North Dakota or the District of Columbia because data were not available in 2009. Bar chart that shows the cumulative percent change in the rate of opioid-related inpatient stays per 100,000 population by State. Georgia: 99.8; North Carolina: 70.9; Oregon: 60.2; Washington: 60.1; South Dakota: 59.6; Pennsylvania: 58.9; Rhode Island: 54.6; Ohio: 52.0; Utah: 51.0; West Virginia: 49.4; Vermont: 47.4; Tennessee: 42.6; Massachusetts: 41.8; Arizona: 39.9; Florida: 39.3; Virginia: 38.0; Colorado: 36.1; Missouri: 34.4; Indiana: 32.2; South Carolina: 31.7; California: 30.0; Connecticut: 28.5; Hawaii: 27.8; Nevada: 26.3; New Mexico: 25.1; Montana: 24.5; Kentucky: 24.2; Arkansas: 23.8; Michigan: 21.4; Minnesota: 20.7; Wisconsin: 19.1; Oklahoma: 17.2; Wyoming: 16.8; Texas: 15.6; New Jersey: 14.2; Iowa: 11.5; Nebraska: 8.0; New York: 2.9; Maine: 2.7; Louisiana: -4.8; Illinois: -5.5; Maryland: -9.7; Kansas: -18.0. National average: 23.8.
|
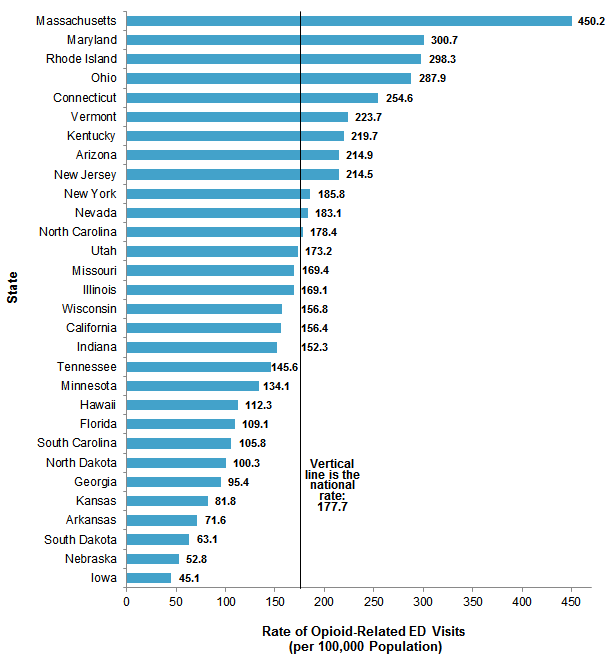
State rates of opioid-related ED visits, 2014 Figure 4 presents the rate per 100,000 population of opioid-related ED visits among 30 States that provided data in 2014. States are ordered according to their rate of opioid-related ED visits. |
|
Figure 4. Rate of opioid-related emergency department visits by State, 2014
Abbreviation: ED, emergency department Bar chart that shows the rate of opioid-related emergency department visits per 100,000 population by State. Massachusetts: 450.2; Maryland: 300.7; Rhode Island: 298.3; Ohio: 287.9; Connecticut: 254.6; Vermont: 223.7; Kentucky: 219.7; Arizona: 214.9; New Jersey: 214.5; New York: 185.8; Nevada: 183.1; North Carolina: 178.4; Utah: 173.2; Missouri: 169.4; Illinois: 169.1; Wisconsin: 156.8; California: 156.4; Indiana: 152.3; Tennessee: 145.6; Minnesota: 134.1; Hawaii: 112.3; Florida: 109.1; South Carolina: 105.8; North Dakota: 100.3; Georgia: 95.4; Kansas: 81.8; Arkansas: 71.6; South Dakota: 63.1; Nebraska: 52.8; Iowa: 45.1. National average: 177.7.
|
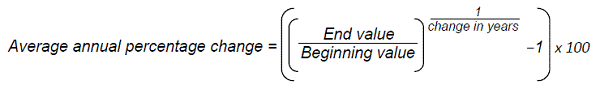
Figure 5 illustrates the percent change in the population rate of opioid-related ED visits from 2009 to 2014 among 27 States with data available in both years. States are ordered according to the percent change in their rate of opioid-related ED visits over the 6-year time period. |
|
Figure 5. Cumulative percent change in the rate of opioid-related emergency department visits by State, 2009-2014
Abbreviation: ED, emergency department Bar chart that shows the cumulative percent change in the rate of opioid-related emergency department visits per 100,000 population by State. Ohio: 106.4; South Dakota: 94.7; Georgia: 85.2; Minnesota: 83.3; Illinois: 82.7; Maryland: 81.0; Arizona: 79.7; California: 79.0; Missouri: 77.3; New York: 72.6; Massachusetts: 71.2; Rhode Island: 70.8; Wisconsin: 68.6; Kentucky: 65.6; North Carolina: 55.2; Hawaii: 54.7; Indiana: 54.6; Nebraska: 54.0; South Carolina: 50.3; New Jersey: 48.1; Tennessee: 43.4; Connecticut: 35.1; Florida: 32.3; Vermont: 18.8; Utah: 15.2; Kansas: 11.4; Iowa: -15.6. National average: 65.5.
|
Data Source The estimates in this Statistical Brief are based upon data from the Healthcare Cost and Utilization Project (HCUP) 2005-2014 National (Nationwide) Inpatient Sample (NIS), 2005-2014 Nationwide Emergency Department Sample (NEDS), 2009-2014 State Inpatient Databases (SID), and 2009-2014 State Emergency Department Databases (SEDD). The statistics were generated from HCUP Fast Stats, a free, online tool that provides users with easy access to the latest HCUP-based statistics for health information topics, including opioid-related hospital use.7 Inpatient statistics from HCUP Fast Stats were available for the following 44 individual States and the District of Columbia in 2009 and 2014: Arizona, Arkansas, California, Colorado, Connecticut, District of Columbia (2014 only), Florida, Georgia, Hawaii, Illinois, Indiana, Iowa, Kansas, Kentucky, Louisiana, Maine, Maryland, Massachusetts, Michigan, Minnesota, Missouri, Montana, Nebraska, Nevada, New Jersey, New Mexico, New York, North Carolina, North Dakota (2014 only), Ohio, Oklahoma, Oregon, Pennsylvania, Rhode Island, South Carolina, South Dakota, Tennessee, Texas, Utah, Vermont, Virginia, Washington, West Virginia, Wisconsin, and Wyoming. Emergency department (ED) statistics from HCUP Fast Stats were available for the following 30 individual States in 2009 and 2014: Arizona, Arkansas (2014 only), California, Connecticut, Florida, Georgia, Hawaii, Illinois, Indiana, Iowa, Kansas, Kentucky, Maryland, Massachusetts, Minnesota, Missouri, Nebraska, Nevada (2014 only), New Jersey, New York, North Carolina, North Dakota (2014 only), Ohio, Rhode Island, South Carolina, South Dakota, Tennessee, Utah, Vermont, and Wisconsin. Definitions Diagnoses and ICD-9-CM The principal diagnosis is that condition established after study to be chiefly responsible for the patient's admission to the hospital. Secondary diagnoses are concomitant conditions that coexist at the time of admission or develop during the stay. All-listed diagnoses include the principal diagnosis plus these additional secondary conditions. ICD-9-CM is the International Classification of Diseases, Ninth Revision, Clinical Modification, which assigns numeric codes to diagnoses. There are approximately 14,000 ICD-9-CM diagnosis codes. Case definition Opioid-related hospital use was identified using the following all-listed ICD-9-CM diagnosis codes:
Types of hospitals included in the HCUP National (Nationwide) Inpatient Sample The National (Nationwide) Inpatient Sample (NIS) is based on data from community hospitals, which are defined as short-term, non-Federal, general, and other hospitals, excluding hospital units of other institutions (e.g., prisons). The NIS includes obstetrics and gynecology, otolaryngology, orthopedic, cancer, pediatric, public, and academic medical hospitals. Excluded are long-term care facilities such as rehabilitation, psychiatric, and alcoholism and chemical dependency hospitals. Beginning in 2012, long-term acute care hospitals are also excluded. However, if a patient received long-term care, rehabilitation, or treatment for a psychiatric or chemical dependency condition in a community hospital, the discharge record for that stay will be included in the NIS. Types of hospitals included in the HCUP Nationwide Emergency Department Sample The Nationwide Emergency Department Sample (NEDS) is based on data from community hospitals, which are defined as short-term, non-Federal, general, and other hospitals, excluding hospital units of other institutions (e.g., prisons). The NEDS includes specialty, pediatric, public, and academic medical hospitals. Excluded are long-term care facilities such as rehabilitation, psychiatric, and alcoholism and chemical dependency hospitals. Hospitals included in the NEDS have hospital-owned emergency departments (EDs) and no more than 90 percent of their ED visits resulting in admission. Types of hospitals included in HCUP State Inpatient Databases This analysis used State Inpatient Databases (SID) limited to data from community hospitals, which are defined as short-term, non-Federal, general, and other hospitals, excluding hospital units of other institutions (e.g., prisons). Community hospitals include obstetrics and gynecology, otolaryngology, orthopedic, cancer, pediatric, public, and academic medical hospitals. Excluded for this analysis are long-term care facilities such as rehabilitation, psychiatric, and alcoholism and chemical dependency hospitals. However, if a patient received long-term care, rehabilitation, or treatment for a psychiatric or chemical dependency condition in a community hospital, the discharge record for that stay was included in the analysis. Types of hospitals included in HCUP State Emergency Department Databases This analysis used State Emergency Department Databases (SEDD) limited to data from community hospitals with a hospital-owned emergency department. Community hospitals are defined as short-term, non-Federal, general, and other hospitals, excluding hospital units of other institutions (e.g., prisons). Community hospitals include specialty, pediatric, public, and academic medical hospitals. Excluded for this analysis are long-term care facilities such as rehabilitation, psychiatric, and alcoholism and chemical dependency hospitals. Unit of analysis The unit of analysis for inpatient data is the hospital discharge (i.e., the hospital stay), not a person or patient. This means that a person who is admitted to the hospital multiple times in 1 year will be counted each time as a separate discharge from the hospital. Inpatient stays include those admitted through the emergency department (ED). The unit of analysis for ED data is the ED visit, not a person or patient. This means that a person who is seen in the ED multiple times in 1 year will be counted each time as a separate visit in the ED. ED visits exclude those for patients admitted to the hospital, including patients transferred to other hospitals. Average annual percent change Average annual percent change (i.e., growth rate) was calculated using the following formula:
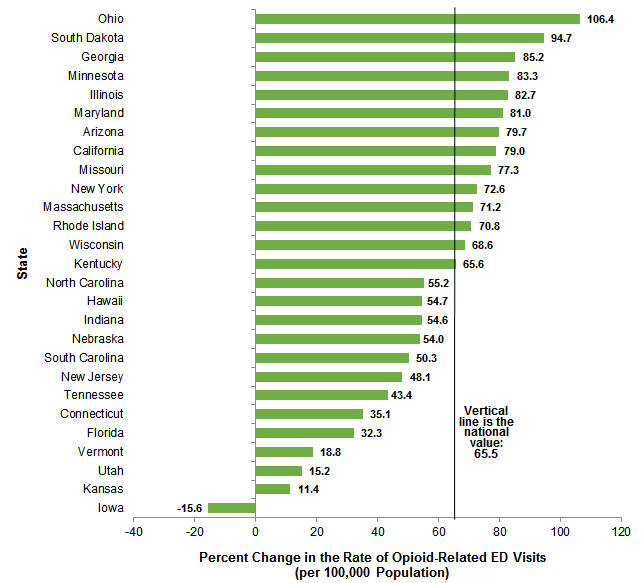
Average annual percentage change equals open parenthesis, open parenthesis, end value divided by beginning value, close parenthesis, to the power of 1 divided by change in years, minus 1, close parenthesis, multiplied by 100.
About HCUP The Healthcare Cost and Utilization Project (HCUP, pronounced "H-Cup") is a family of healthcare databases and related software tools and products developed through a Federal-State-Industry partnership and sponsored by the Agency for Healthcare Research and Quality (AHRQ). HCUP databases bring together the data collection efforts of State data organizations, hospital associations, and private data organizations (HCUP Partners) and the Federal government to create a national information resource of encounter-level healthcare data. HCUP includes the largest collection of longitudinal hospital care data in the United States, with all-payer, encounter-level information beginning in 1988. These databases enable research on a broad range of health policy issues, including cost and quality of health services, medical practice patterns, access to healthcare programs, and outcomes of treatments at the national, State, and local market levels. HCUP would not be possible without the contributions of the following data collection Partners from across the United States: Alaska State Hospital and Nursing Home Association Arizona Department of Health Services Arkansas Department of Health California Office of Statewide Health Planning and Development Colorado Hospital Association Connecticut Hospital Association District of Columbia Hospital Association Florida Agency for Health Care Administration Georgia Hospital Association Hawaii Health Information Corporation Illinois Department of Public Health Indiana Hospital Association Iowa Hospital Association Kansas Hospital Association Kentucky Cabinet for Health and Family Services Louisiana Department of Health and Hospitals Maine Health Data Organization Maryland Health Services Cost Review Commission Massachusetts Center for Health Information and Analysis Michigan Health & Hospital Association Minnesota Hospital Association Mississippi Department of Health Missouri Hospital Industry Data Institute Montana MHA - An Association of Montana Health Care Providers Nebraska Hospital Association Nevada Department of Health and Human Services New Hampshire Department of Health & Human Services New Jersey Department of Health New Mexico Department of Health New York State Department of Health North Carolina Department of Health and Human Services North Dakota (data provided by the Minnesota Hospital Association) Ohio Hospital Association Oklahoma State Department of Health Oregon Association of Hospitals and Health Systems Oregon Office of Health Analytics Pennsylvania Health Care Cost Containment Council Rhode Island Department of Health South Carolina Revenue and Fiscal Affairs Office South Dakota Association of Healthcare Organizations Tennessee Hospital Association Texas Department of State Health Services Utah Department of Health Vermont Association of Hospitals and Health Systems Virginia Health Information Washington State Department of Health West Virginia Health Care Authority Wisconsin Department of Health Services Wyoming Hospital Association About Statistical Briefs HCUP Statistical Briefs are descriptive summary reports presenting statistics on hospital inpatient, ambulatory surgery, and emergency department use and costs, quality of care, access to care, medical conditions, procedures, patient populations, and other topics. The reports use HCUP administrative healthcare data. About the NIS The HCUP National (Nationwide) Inpatient Sample (NIS) is a nationwide database of hospital inpatient stays. The NIS is nationally representative of all community hospitals (i.e., short-term, non-Federal, nonrehabilitation hospitals). The NIS includes all payers. It is drawn from a sampling frame that contains hospitals comprising more than 95 percent of all discharges in the United States. The vast size of the NIS allows the study of topics at the national and regional levels for specific subgroups of patients. In addition, NIS data are standardized across years to facilitate ease of use. Over time, the sampling frame for the NIS has changed; thus, the number of States contributing to the NIS varies from year to year. The NIS is intended for national estimates only; no State-level estimates can be produced. The 2012 NIS was redesigned to optimize national estimates. The redesign incorporates two critical changes:
The new sampling strategy is expected to result in more precise estimates than those that resulted from the previous NIS design by reducing sampling error: for many estimates, confidence intervals under the new design are about half the length of confidence intervals under the previous design. The change in sample design for 2012 makes it necessary to recalculate prior years' NIS data to enable analyses of trends that use the same definitions of discharges and hospitals. About the NEDS The HCUP Nationwide Emergency Department Database (NEDS) is a unique and powerful database that yields national estimates of emergency department (ED) visits. The NEDS was constructed using records from both the HCUP State Emergency Department Databases (SEDD) and the State Inpatient Databases (SID). The SEDD capture information on ED visits that do not result in an admission (i.e., treat-and-release visits and transfers to another hospital); the SID contain information on patients initially seen in the emergency department and then admitted to the same hospital. The NEDS was created to enable analyses of ED utilization patterns and support public health professionals, administrators, policymakers, and clinicians in their decision making regarding this critical source of care. The NEDS is produced annually beginning in 2006. Over time, the sampling frame for the NEDS has changed; thus, the number of States contributing to the NEDS varies from year to year. The NEDS is intended for national estimates only; no State-level estimates can be produced. About the SID The HCUP State Inpatient Databases (SID) are hospital inpatient databases from data organizations participating in HCUP. The SID contain the universe of the inpatient discharge abstracts in the participating HCUP States, translated into a uniform format to facilitate multistate comparisons and analyses. Together, the SID encompass more than 95 percent of all U.S. community hospital discharges. The SID can be used to investigate questions unique to one State, to compare data from two or more States, to conduct market-area variation analyses, and to identify State-specific trends in inpatient care utilization, access, charges, and outcomes. About the SEDD The HCUP State Emergency Department Databases (SEDD) include information from hospital-owned emergency departments (EDs) from data organizations participating in HCUP, translated into a uniform format to facilitate multistate comparisons and analyses. The SEDD capture information on ED visits that do not result in an admission to the same hospital (i.e., patients who are treated in the ED and then discharged, transferred to another hospital, left against medical advice, or died). The SEDD contain a core set of clinical and nonclinical information on all patients, including individuals covered by Medicare, Medicaid, or private insurance, as well as those who are uninsured. The SEDD can be used to investigate questions unique to one State, to compare data from two or more States, to conduct market-area variation analyses, and to identify State-specific trends in injury surveillance, emerging infections, and other conditions treated in the ED. About HCUP Fast Stats HCUP Fast Stats is an interactive, online tool that provides easy access to HCUP-based statistics for select State and national health information topics. HCUP Fast Stats uses side-by-side comparisons of visual statistical displays, trend figures, or simple tables to convey complex information at a glance. Topics currently available in HCUP Fast Stats include the Effect of Health Insurance Expansion on Hospital Use by State; National Hospital Utilization and Costs; and Opioid-Related Hospital Use, National and State. HCUP Fast Stats presents statistics using data from HCUP's National (Nationwide) Inpatient Sample (NIS), the Nationwide Emergency Department Sample (NEDS), the State Inpatient Databases (SID), and the State Emergency Department Databases (SEDD). For More Information For other information on malnutrition-related hospital stays in the United States, refer to the HCUP Statistical Briefs located at http://www.hcup-us.ahrq.gov/reports/statbriefs/sb_mhsa.jsp. For additional HCUP statistics, visit:
For a detailed description of HCUP and more information on the design of the National (Nationwide) Inpatient Sample, Nationwide Emergency Department Sample (NEDS), State Inpatient Databases (SID), or State Emergency Department Databases (SEDD), please refer to the following database documentation: Agency for Healthcare Research and Quality. Overview of the National (Nationwide) Inpatient Sample (NIS). Healthcare Cost and Utilization Project (HCUP). Rockville, MD: Agency for Healthcare Research and Quality. Updated November 2015. http://www.hcup-us.ahrq.gov/nisoverview.jsp. Accessed February 17, 2016. Agency for Healthcare Research and Quality. Overview of the Nationwide Emergency Department Sample (NEDS). Healthcare Cost and Utilization Project (HCUP). Rockville, MD: Agency for Healthcare Research and Quality. Updated January 2016. http://www.hcup-us.ahrq.gov/nedsoverview.jsp. Accessed February 17, 2016. Agency for Healthcare Research and Quality. Overview of the State Inpatient Databases (SID). Healthcare Cost and Utilization Project (HCUP). Rockville, MD: Agency for Healthcare Research and Quality. Updated January 2016. http://www.hcup-us.ahrq.gov/sidoverview.jsp. Accessed February 17, 2016. Agency for Healthcare Research and Quality. Overview of the State Emergency Department Databases (SEDD). Healthcare Cost and Utilization Project (HCUP). Rockville, MD: Agency for Healthcare Research and Quality. Updated January 2016. http://www.hcup-us.ahrq.gov/seddoverview.jsp. Accessed February 17, 2016. Suggested Citation Weiss AJ (Truven Health Analytic), Elixhauser A (AHRQ), Barrett ML (M.L. Barrett, Inc.), Steiner CA (AHRQ), Bailey MK (Truven Health Analytics), O'Malley L (Truven Health Analytics). Opioid-Related Inpatient Stays and Emergency Department Visits by State, 2009-2014. HCUP Statistical Brief #219. December 2016. Agency for Healthcare Research and Quality, Rockville, MD. http://www.hcup-us.ahrq.gov/reports/statbriefs/sb219-Opioid-Hospital-Stays-ED-Visits-by-State.pdf. Acknowledgments The authors would like to acknowledge the contributions of Brian Eppert of Coding Leap, LLC, and Minya Sheng of Truven Health Analytics. *** AHRQ welcomes questions and comments from readers of this publication who are interested in obtaining more information about access, cost, use, financing, and quality of healthcare in the United States. We also invite you to tell us how you are using this Statistical Brief and other HCUP data and tools, and to share suggestions on how HCUP products might be enhanced to further meet your needs. Please e-mail us at hcup@ahrq.gov or send a letter to the address below:David Knutson, Director Center for Delivery, Organization, and Markets Agency for Healthcare Research and Quality 5600 Fishers Lane Rockville, MD 20857 This Statistical Brief was posted online on December 15, 2016. the revised version of this Statistical Brief was posted online on January 26, 2017. * This Statistical Brief was revised to include opioid-related external cause of injury codes (E codes) for accidental poisoning and adverse effects (E850.0-E850.2, E935.0-E935.2, E940.1) in the calculation of the State-level rates. This affected the number of inpatient stays and emergency department (ED) visits involving opioids at the State level, resulting in an increase in the rates reported for all States. Consequently, some shifts occurred in the rankings among States, both in the 2014 rate and in the percent change in rate between 2009 and 2014. Additionally, Maine was added to the list of States reported with inpatient data. The numbers for national rates, both inpatient and ED, are unchanged as E codes were included originally for national estimates. 1 Rudd RA, Aleshire N, Zibbell JE, Gladden RM. Increases in drug and opioid overdose deaths—United States 2000-2014. Morbidity and Mortality Weekly Report. 2016;64:1374-82. 2 Ibid. 3 Owens PL, Barrett ML, Weiss AJ, Washington RE, Kronick R. Hospital Inpatient Utilization Related to Opioid Overuse Among Adults, 1993-2012. HCUP Statistical Brief #177. August 2014. Agency for Healthcare Research and Quality, Rockville, MD. https://www.hcup-us.ahrq.gov/reports/statbriefs/sb177-Hospitalizations-for-Opioid-Overuse.jsp. Accessed December 1, 2016. 4 U.S. Department of Health and Human Services. The U.S. Opioid Epidemic. Updated October 31, 2016. http://www.hhs.gov/opioids/about-the-epidemic/#us-epidemic. Accessed December 1, 2016. 5 U.S. Department of Health and Human Services. Opioid Abuse in the U.S. and HHS Actions to Address Opioid-Drug Related Overdoses and Deaths. March 26, 2015. https://aspe.hhs.gov/basic-report/opioid-abuse-us-and-hhs-actions-address-opioid-drug-related-overdoses-and-deaths. Accessed December 1, 2016. 6 Agency for Healthcare Research and Quality. HCUP Fast Stats website, Opioid-Related Hospital Use path. https://datatools.ahrq.gov/hcup-fast-stats. Accessed January 26, 2017. 7 Agency for Healthcare Research and Quality. HCUP Fast Stats website, Opioid-Related Hospital Use path. https://datatools.ahrq.gov/hcup-fast-stats. Accessed January 26, 2017. |
| Internet Citation: Statistical Brief #219. Healthcare Cost and Utilization Project (HCUP). February 2017. Agency for Healthcare Research and Quality, Rockville, MD. hcup-us.ahrq.gov/reports/statbriefs/sb219-Opioid-Hospital-Stays-ED-Visits-by-State.jsp. |
| Are you having problems viewing or printing pages on this website? |
| If you have comments, suggestions, and/or questions, please contact hcup@ahrq.gov. |
| If you are experiencing issues related to Section 508 accessibility of information on this website, please contact hcup@ahrq.gov. |
| Privacy Notice, Viewers & Players |
| Last modified 2/6/17 |