STATISTICAL BRIEF #177 |
August 2014
Pamela L Owens, Ph.D., Marguerite L. Barrett, M.S., Audrey J. Weiss, Ph.D., Raynard E. Washington, Ph.D., and Richard Kronick, Ph.D. Introduction Opioids, or pain medications, are commonly used to manage pain associated with injury, illness, or following surgery. Opioids include both prescription pain medications, such as morphine, codeine, fentanyl, oxycodone, and hydrocodone, as well as illegal drugs such as heroin.1 A variety of negative side effects can occur from opioid use, including vomiting, severe allergic reactions, and overdose.2 In 2010, opioids, predominantly prescription medications, were estimated to be nonmedically used by more than 12 million people,3 resulted in 425,000 emergency department visits,4 and were related to approximately 17,000 deaths.5,6 Opioid overdose can occur for a variety of reasons, including accidental and deliberate misuse of a prescription (e.g., taking more doses than prescribed), taking medication prescribed for someone else, and combining opioids with other substances such as alcohol. The U.S. Department of Health and Human Services has recognized opioid misuse and abuse as a significant public health issue.8,9,10 This HCUP Statistical Brief presents data on adult inpatient hospitalizations involving overuse of opioids, including opioid dependence, abuse, poisoning, and adverse effects. Hospitalizations that involved illegal drug use were excluded from this analysis. Trends in hospital inpatient stays related to opioid overuse among adults are presented along with characteristics of these types of stays. Differences between group rate estimates noted in the text are statistically significant at the 0.05 level or better and differ by at least 10 percent. Findings Trends in inpatient hospitalizations involving opioid overuse, 1993-2012 The trend in the rate of hospital inpatient stays involving opioid overuse from 1993 to 2012 is presented in Figure 1. The rate is calculated per 100,000 population aged 18 years and older. |
|
|
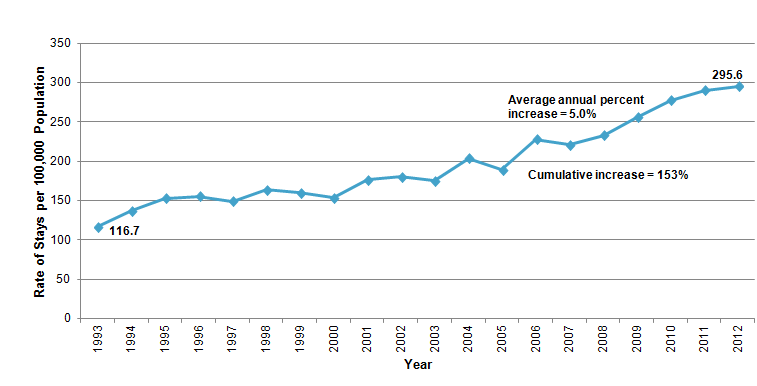
Figure 1. Rate of hospital inpatient stays related to opioid overuse* among adults, 1993-2012
* Opioid overuse was identified using all-listed diagnoses. Figure 1 is a line graph showing the rate of hospital stays per 100,000 population across time. Opioid overuse was identified using all-listed diagnoses. The rate of stays began at 116.7 in 1993 and rose rather steadily to 295.6 in 2012. The average annual percent increase was 5.0, and the cumulative increase was 153 percent. Source: Agency for Healthcare Research and Quality (AHRQ), Center for Delivery, Organization, and Markets, Healthcare Cost and Utilization Project (HCUP), Nationwide Inpatient Sample (NIS), 1993-2012. |
The rate of inpatient stays that included a diagnosis of opioid overuse among adults aged 18 years and older increased more than 150 percent between 1993 and 2012, from 116.7 to 295.6 stays per 100,000 population. This represents an average increase of 5.0 percent per year. The percentage of stays with opioid overuse that were admitted from the ED increased from 43 percent in 1993 to 64 percent in 2005 and remained relatively constant from 2005-2012 (data not shown). Characteristics of inpatient hospitalizations involving opioid overuse, 1993-2012 Table 1 presents the number of hospital inpatient stays involving opioid overuse among adults in 2012 by patient sex, patient age, and hospital region. The rate of stays per 100,000 population is provided for 1993, 2000, 2006, and 2012. The average annual percentage change from 1993 to 2012 also is provided. Figures 2, 3, and 4 present the rate of hospital inpatient stays for opioid overuse by patient sex (Figure 2), adult age group (Figure 3), and hospital region (Figure 4) in 1993 and 2012. |
| Table 1. Rate and change over time of hospital inpatient stays related to opioid overuse* among adults, 1993-2012 | ||||||
| Characteristic | Number of inpatient stays, 2012 | Rate of inpatient stays per 100,000 population | Average annual percentage change in rate of stays 1993-2012 (all years) | |||
|---|---|---|---|---|---|---|
| 1993 | 2000 | 2006 | 2012 | |||
| All U.S. adult stays | 709,500 | 116.7 | 153.5 | 227.9 | 295.6 | 5.0 |
| Patient sex | ||||||
| Male | 350,900 | 144.0 | 175.6 | 251.5 | 300.6 | 4.0 |
| Female | 358,600 | 91.6 | 132.8 | 205.6 | 290.8 | 6.3 |
| Patient age | ||||||
| 18-24 years | 69,500 | 70.7 | 86.0 | 133.2 | 221.8 | 6.2 |
| 25-44 years | 258,300 | 188.6 | 205.7 | 272.7 | 312.3 | 2.7 |
| 45-64 years | 280,000 | 66.6 | 150.9 | 255.5 | 338.1 | 8.9 |
| 65-84 years | 86,000 | 46.0 | 81.9 | 144.1 | 230.8 | 8.9 |
| 85+ years | 15,800 | 51.1 | 101.1 | 175.7 | 265.3 | 9.1 |
| Hospital region | ||||||
| Northeast | 168,900 | 264.0 | 276.4 | 432.9 | 392.7 | 2.1 |
| Midwest | 163,700 | 61.3 | 168.0 | 209.9 | 320.8 | 9.1 |
| South | 223,100 | 94.0 | 98.5 | 169.6 | 254.0 | 5.4 |
| West | 153,900 | 79.1 | 120.1 | 170.6 | 281.9 | 6.9 |
| * Opioid overuse was identified using all-listed diagnoses. Source: Agency for Healthcare Research and Quality (AHRQ), Center for Delivery, Organization, and Markets, Healthcare Cost and Utilization Project (HCUP), Nationwide Inpatient Sample (NIS), 1993, 2000, 2006, and 2012 | ||||||
|
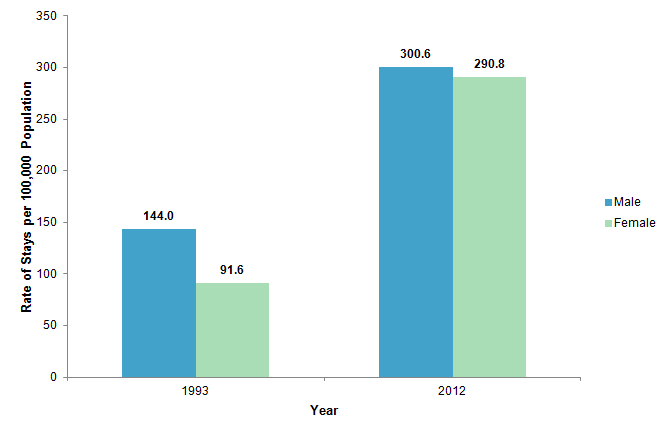
Figure 2. Rate of hospital inpatient stays related to opioid overuse* by patient sex, 1993 and 2012
* Opioid overuse was identified using all-listed diagnoses. Figure 2 is a bar graph showing the rate of hospital stays per 100,000 population for males and females in 1993 and 2012. Opioid overuse was identified using all-listed diagnoses. 1993: Males, 144.0, Females, 91.6. 2006: Males, 300.6, Females, 290.8. Source: Agency for Healthcare Research and Quality (AHRQ), Center for Delivery, Organization, and Markets, Healthcare Cost and Utilization Project (HCUP), Nationwide Inpatient Sample (NIS), 1993 and 2012. |
|
|
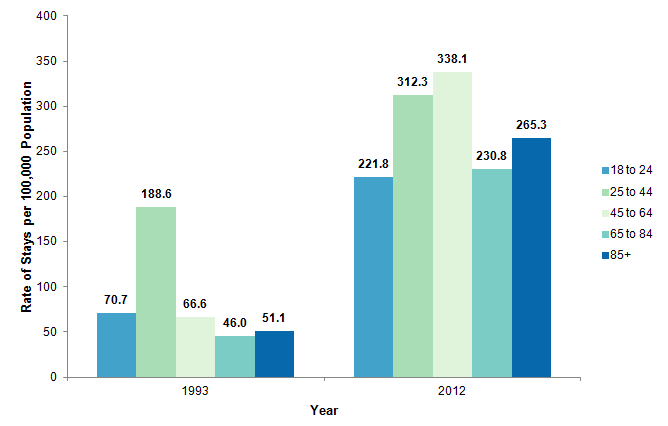
Figure 3. Rate of hospital inpatient stays related to opioid overuse* by adult age group, 1993 and 2012
* Opioid overuse was identified using all-listed diagnoses. Figure 3 is a bar graph showing the rate of stays per 100,000 population for adults in 5 age groups in 1993 and 2012. Opioid overuse was defined using all-listed diagnoses. 1993: Age Groups - 18 to 24 years, 70.7, 25 to 44 years, 188.6, 45 to 64 years, 66.6 ,65 to 84 years, 46.0, 85 years and older, 51.1. 2012: Age Groups - 18 to 24 years, 221.8, 25 to 44 years, 312.3, 45 to 64 years, 338.1, 65 to 84 years, 230.8, 85 years and older, 265.3. Source: Agency for Healthcare Research and Quality (AHRQ), Center for Delivery, Organization, and Markets, Healthcare Cost and Utilization Project (HCUP), Nationwide Inpatient Sample (NIS), 1993 and 2012.
|
|
|
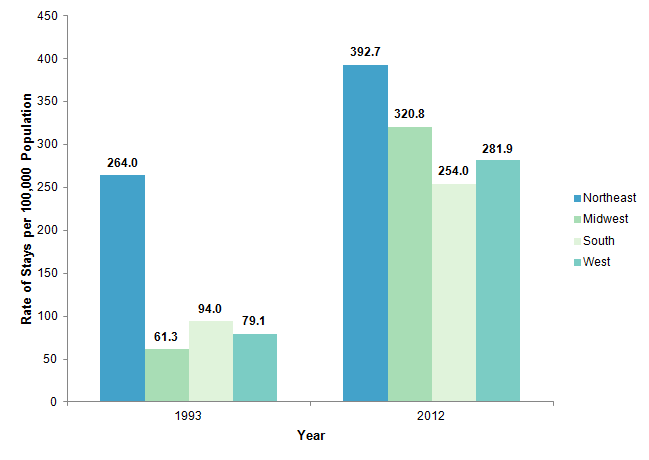
Figure 4. Rate of hospital inpatient stays related to opioid overuse* among adults by hospital region, 1993 and 2012
* Opioid overuse was identified using all-listed diagnoses. Figure 4 is a bar graph showing the rate of stays per 100,000 population for four geographic regions in 1993 and 2012. Opioid overuse was defined using all-listed diagnoses. 1993: Region - Northeast, 264.0, Midwest, 61.3, South, 94.0, West, 79.1. 2012: Region - Northeast, 392.7, Midwest, 320.8, South, 254.0, West, 281.9.Source: Agency for Healthcare Research and Quality (AHRQ), Center for Delivery, Organization, and Markets, Healthcare Cost and Utilization Project (HCUP), Nationwide Inpatient Sample (NIS), 1993 and 2012.
|
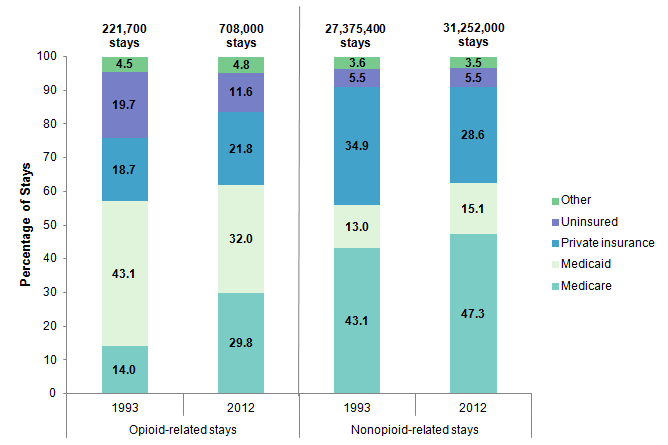
Inpatient hospitalizations involving opioid overuse by payer, 1993-2012 Table 2 presents the number of hospital inpatient stays involving opioid overuse by expected primary payer in 1993, 2000, 2006, and 2012. The average annual percentage change from 1993 to 2012 also is provided. Figure 5 presents the distribution of adult opioid-related and nonopioid-related hospital stays by payer in 1993 and 2012. Unlike the previous table and figures, the values presented here for payer are based on the number of inpatient stays and not population rates. Population denominator data for payer-specific rates are difficult because HCUP discharges are categorized by the primary expected payer for the hospital service at the time of discharge, while population surveys capture the health insurance coverage over a specific time period such as the year.11 |
| Table 2. Number and change over time of hospital inpatient stays related to opioid overuse* among adults by payer, 1993-2012 | ||||||
| Characteristic | Number of inpatient stays | Average annual percentage change in number of stays 1993-2012 (all years) | ||||
|---|---|---|---|---|---|---|
| 1993 | 2000 | 2006 | 2012 | |||
| Payer | ||||||
| Medicare | 30,900 | 59,500 | 116,800 | 211,200 | 10.6 | |
| Medicaid | 95,600 | 130,700 | 181,800 | 226,600 | 4.6 | |
| Private insurance | 41,500 | 72,900 | 104,100 | 154,400 | 7.2 | |
| Uninsured | 43,800 | 44,900 | 86,500 | 82,100 | 3.4 | |
| Other | 9,900 | 12,700 | 22,100 | 33,700 | 6.6 | |
| * Opioid overuse was identified using all-listed diagnoses. Source: Agency for Healthcare Research and Quality (AHRQ), Center for Delivery, Organization, and Markets, Healthcare Cost and Utilization Project (HCUP), Nationwide Inpatient Sample (NIS), 1993, 2000, and 2006, and 2012 | ||||||
|
|
Figure 5. Distribution of opioid-related* and nonopioid-related hospital inpatient stays among adults by payer, 1993 and 2012
* Opioid overuse was identified using all-listed diagnoses. The total number of stays in this figure is slightly below the count of all adult stays, because some discharge records are missing payer information. Figure 5. Distribution of opioid-related and nonopioid-related hospital inpatient stays among adults by payer, 1993 and 2012. Figure 5 is a stacked bar graph showing the percentage of hospital stays for five types of payers in 1993 and 2012. Opioid overuse was defined using all-listed diagnoses. The total number of stays in this figure is slightly below the count of all adult stays, because some discharge records are missing payer information. Opioid-related stays 1993: 221,700 total stays, Medicare, 14.0, Medicaid, 43.1, Private insurance, 18.7, Uninsured, 19.7, Other payer, 4.5. Opioid-related stays 2012: 708,000 total stays, Medicare, 29.8, Medicaid, 32.0, Private insurance, 21.8, Uninsured, 11.6, Other payer, 4.8. Nonopioid-related stays 1993: 27,375,400 total stays, Medicare, 43.1, Medicaid, 13.0, Private insurance, 34.9, Uninsured, 5.5, Other payer, 3.6. Nonopioid-related stays 2012: 31,252,000 total stays, Medicare, 47.3, Medicaid, 15.1, Private insurance, 28.6, Uninsured, 5.5, Other payer, 3.5.Source: Agency for Healthcare Research and Quality (AHRQ), Center for Delivery, Organization, and Markets, Healthcare Cost and Utilization Project (HCUP), Nationwide Inpatient Sample (NIS), 1993 and 2012.
|
Data Source The estimates in this Statistical Brief are based upon data from the Healthcare Cost and Utilization Project (HCUP) 1993-2012 Nationwide Inpatient Sample (NIS). The 2012 Nationwide Inpatient Sample is a preliminary analysis file derived from the HCUP State Inpatient Databases (SID) that was designed to provide national estimates using weighted records from a sample of hospitals from 44 States using the same methodology employed for the 1993-2011 Nationwide Inpatient Sample. It should be noted that the 2012 Nationwide Inpatient Sample (NIS), which uses a sampling approach based on hospitals, is a separate file from the 2012 National Inpatient Sample (NIS), which uses a sampling approach based on discharges. This analysis was limited to adult discharges aged 18 years and older. Supplemental sources included population denominator data for use with HCUP databases.12 Definitions Diagnoses and ICD-9-CM The principal diagnosis is that condition established after study to be chiefly responsible for the patient's admission to the hospital. Secondary diagnoses are concomitant conditions that coexist at the time of admission or develop during the stay. All-listed diagnoses include the principal diagnosis plus these additional secondary conditions. ICD-9-CM is the International Classification of Diseases, Ninth Revision, Clinical Modification, which assigns numeric codes to diagnoses. There are approximately 14,000 ICD-9-CM diagnosis codes. The average number of secondary diagnoses reported on the hospital discharge record has increased over time, as illustrated in Table 3. |
| Table 3. Average number of secondary diagnosis codes on hospital discharge records, 1993-2012 | ||||
| Year | Average number of secondary diagnoses per hospital discharge record | Year | Average number of secondary diagnoses per hospital discharge record | |
|---|---|---|---|---|
| 1993 | 2.86 | 2003 | 4.45 | |
| 1994 | 3.14 | 2004 | 4.70 | |
| 1995 | 3.33 | 2005 | 4.98 | |
| 1996 | 3.50 | 2006 | 5.35 | |
| 1997 | 3.59 | 2007 | 5.75 | |
| 1998 | 3.68 | 2008 | 6.34 | |
| 1999 | 3.70 | 2009 | 6.71 | |
| 2000 | 3.77 | 2010 | 7.10 | |
| 2001 | 3.98 | 2011 | 7.76 | |
| 2002 | 4.24 | 2012 | 7.93 | |
Case definition Opioid overuse was identified using the ICD-9-CM diagnosis codes listed in Table 4, based on all-listed diagnoses on the hospital discharge record. |
| Table 4. ICD-9-CM diagnosis codes defining opioid overuse (inclusion criteria) | |
| ICD-9-CM diagnosis code | Description |
|---|---|
| 304.00 | OPIOID DEPENDENCE-UNSPECIFIED |
| 304.01 | OPIOID DEPENDENCE-CONTINUOUS |
| 304.02 | OPIOID DEPENDENCE-EPISODIC |
| 304.03 | OPIOID DEPENDENCE, IN REMISSION |
| 304.70 | OPIOID OTHER DEP-UNSPECIFIED |
| 304.71 | OPIOID OTHER DEP-CONTINUOUS |
| 304.72 | OPIOID OTHER DEP-EPISODIC |
| 304.73 | OPIOID OTHER DEP-IN REMISSION |
| 305.50 | OPIOID ABUSE-UNSPECIFIED |
| 305.51 | OPIOID ABUSE-CONTINUOUS |
| 305.52 | OPIOID ABUSE-EPISODIC |
| 305.53 | OPIOID ABUSE-IN REMISSION |
| 965.00 | OPIUM POISONING |
| 965.09 | POISONING BY OTHER OPIATES AND RELATED NARCOTICS |
| E850.2 | ACCIDENTAL POISONING BY OTHER OPIATES AND RELATED NARCOTICS |
| E935.2 | OTHER OPIATES AND RELATED NARCOTICS CAUSING ADVERSE EFFECTS IN THERAPEUTIC USE |
Hospital stays that included illegal drug use, as defined using the ICD-9-CM diagnosis codes in Table 5 and identified using all-listed diagnoses, were excluded.
|
| Table 5. ICD-9-CM diagnosis codes defining illegal drug use (exclusion criteria) | |
| ICD-9-CM diagnosis code | Description |
|---|---|
| 965.01 | HEROIN POISONING |
| 969.6 | PSYCHODYSLEPTIC POISONING |
| E850.0 | ACCIDENTAL POISONING BY HEROIN |
| E854.1 | ACCIDENTAL POISONING BY HALLUCINOGENS |
| E935.0 | ADVERSE EFFECTS OF HEROIN |
| E939.6 | ADVERSE EFFECTS OF HALLUCINOGENS |
Average annual percentage change Average annual percentage change is calculated using the following formula: Average annual percentage change equals open bracket, open parenthesis, end value divided by beginning value, close parenthesis, to the power of 1 divided by change in years, minus 1, close bracket, multiplied by 100. Types of hospitals included in HCUP HCUP is based on data from community hospitals, which are defined as short-term, non-Federal, general, and other hospitals, excluding hospital units of other institutions (e.g., prisons). HCUP data include obstetrics and gynecology, otolaryngology, orthopedic, cancer, pediatric, public, and academic medical hospitals. Excluded are long-term care, rehabilitation, psychiatric, and alcoholism and chemical dependency hospitals. However, if a patient received long-term care, rehabilitation, or treatment for psychiatric or chemical dependency conditions in a community hospital, the discharge record for that stay will be included in the Nationwide Inpatient Sample (NIS). Unit of analysis The unit of analysis is the hospital discharge (i.e., the hospital stay), not a person or patient. This means that a person who is admitted to the hospital multiple times in one year will be counted each time as a separate "discharge" from the hospital. Payer Payer is the expected primary payer for the hospital stay. To make coding uniform across all HCUP data sources, payer combines detailed categories into general groups:
Hospital stays billed to the State Children's Health Insurance Program (SCHIP) may be classified as Medicaid, Private Insurance, or Other, depending on the structure of the State program. Because most State data do not identify SCHIP patients specifically, it is not possible to present this information separately. When more than one payer is listed for a hospital discharge, the first-listed payer is used. Region Region is one of the four regions defined by the U.S. Census Bureau:
The Healthcare Cost and Utilization Project (HCUP, pronounced "H-Cup") is a family of healthcare databases and related software tools and products developed through a Federal-State-Industry partnership and sponsored by the Agency for Healthcare Research and Quality (AHRQ). HCUP databases bring together the data collection efforts of State data organizations, hospital associations, private data organizations, and the Federal government to create a national information resource of encounter-level healthcare data (HCUP Partners). HCUP includes the largest collection of longitudinal hospital care data in the United States, with all-payer, encounter-level information beginning in 1988. These databases enable research on a broad range of health policy issues, including cost and quality of health services, medical practice patterns, access to healthcare programs, and outcomes of treatments at the national, State, and local market levels. HCUP would not be possible without the contributions of the following data collection Partners from across the United States: Alaska State Hospital and Nursing Home Association Arizona Department of Health Services Arkansas Department of Health California Office of Statewide Health Planning and Development Colorado Hospital Association Connecticut Hospital Association Florida Agency for Health Care Administration Georgia Hospital Association Hawaii Health Information Corporation Illinois Department of Public Health Indiana Hospital Association Iowa Hospital Association Kansas Hospital Association Kentucky Cabinet for Health and Family Services Louisiana Department of Health and Hospitals Maine Health Data Organization Maryland Health Services Cost Review Commission Massachusetts Center for Health Information and Analysis Michigan Health & Hospital Association Minnesota Hospital Association Mississippi Department of Health Missouri Hospital Industry Data Institute Montana MHA - An Association of Montana Health Care Providers Nebraska Hospital Association Nevada Department of Health and Human Services New Hampshire Department of Health & Human Services New Jersey Department of Health New Mexico Department of Health New York State Department of Health North Carolina Department of Health and Human Services North Dakota (data provided by the Minnesota Hospital Association) Ohio Hospital Association Oklahoma State Department of Health Oregon Association of Hospitals and Health Systems Oregon Health Policy and Research Pennsylvania Health Care Cost Containment Council Rhode Island Department of Health South Carolina Revenue and Fiscal Affairs Office South Dakota Association of Healthcare Organizations Tennessee Hospital Association Texas Department of State Health Services Utah Department of Health Vermont Association of Hospitals and Health Systems Virginia Health Information Washington State Department of Health West Virginia Health Care Authority Wisconsin Department of Health Services Wyoming Hospital Association About Statistical Briefs HCUP Statistical Briefs are descriptive summary reports presenting statistics on hospital inpatient and emergency department use and costs, quality of care, access to care, medical conditions, procedures, patient populations, and other topics. The reports use HCUP administrative healthcare data. About the NIS The HCUP National (Nationwide) Inpatient Sample (NIS) is a national (nationwide) database of hospital inpatient stays. The NIS is nationally representative of all community hospitals (i.e., short-term, non-Federal, nonrehabilitation hospitals). The NIS is a sample of hospitals and includes all patients from each hospital, regardless of payer. It is drawn from a sampling frame that contains hospitals comprising more than 95 percent of all discharges in the United States. The vast size of the NIS allows the study of topics at the national and regional levels for specific subgroups of patients. In addition, NIS data are standardized across years to facilitate ease of use. About the SID The HCUP State Inpatient Databases (SID) are hospital inpatient databases from data organizations participating in HCUP. The SID contain the universe of the inpatient discharge abstracts in the participating HCUP States, translated into a uniform format to facilitate multistate comparisons and analyses. Together, the SID encompass more than 95 percent of all U.S. community hospital discharges in 2009. The SID can be used to investigate questions unique to one State, to compare data from two or more States, to conduct market-area variation analyses, and to identify State-specific trends in inpatient care utilization, access, charges, and outcomes. About HCUPnet HCUPnet is an online query system that offers instant access to the largest set of all-payer healthcare databases that are publicly available. HCUPnet has an easy step-by-step query system that creates tables and graphs of national and regional statistics as well as data trends for community hospitals in the United States. HCUPnet generates statistics using data from HCUP's Nationwide Inpatient Sample (NIS), the Kids' Inpatient Database (KID), the Nationwide Emergency Department Sample (NEDS), the State Inpatient Databases (SID), and the State Emergency Department Databases (SEDD). For More Information For more information about HCUP, visit http://www.hcup-us.ahrq.gov/. For additional HCUP statistics, visit HCUPnet, our interactive query system, at https://datatools.ahrq.gov/hcupnet. For information on other hospitalizations in the United States, refer to the following HCUP Statistical Briefs located at http://www.hcup-us.ahrq.gov/reports/statbriefs/statbriefs.jsp:
For a detailed description of HCUP, more information on the design of the Nationwide Inpatient Sample (NIS), and methods to calculate estimates, please refer to the following publications: Introduction to the HCUP Nationwide Inpatient Sample, 2009. Online. May 2011. U.S. Agency for Healthcare Research and Quality. http://hcup-us.ahrq.gov/db/nation/nis/NIS_2009_INTRODUCTION.pdf. Accessed December 13, 2013. Introduction to the HCUP State Inpatient Databases. Online. August 2013. U.S. Agency for Healthcare Research and Quality. http://hcup-us.ahrq.gov/db/state/siddist/Introduction_to_SID.pdf. Accessed July 8, 2014. Houchens R, Elixhauser A. Final Report on Calculating Nationwide Inpatient Sample (NIS) Variances, 2001. HCUP Methods Series Report #2003-2. Online. June 2005 (revised June 6, 2005). U.S. Agency for Healthcare Research and Quality. http://www.hcup-us.ahrq.gov/reports/methods/2003_02.pdf. Accessed December 13, 2013. Houchens RL, Elixhauser A. Using the HCUP Nationwide Inpatient Sample to Estimate Trends. (Updated for 1988-2004). HCUP Methods Series Report #2006-05. Online. August 18, 2006. U.S. Agency for Healthcare Research and Quality. http://www.hcup-us.ahrq.gov/reports/methods/2006_05_NISTrendsReport_1988-2004.pdf. Accessed December 13, 2013. Suggested Citation Owens PL (AHRQ), Barrett ML (M.L. Barrett, Inc.), Weiss AJ (Truven Health Analytics), Washington RE (AHRQ), Kronick R (AHRQ). Hospital Inpatient Utilization Related to Opioid Overuse Among Adults, 1993-2012. HCUP Statistical Brief #177. August 2014. Agency for Healthcare Research and Quality, Rockville, MD. http://www.hcup-us.ahrq.gov/reports/statbriefs/sb177-Hospitalizations-for-Opioid-Overuse.pdf. Acknowledgments The authors would like to acknowledge the contribution of Minya Sheng of Truven Health Analytics. *** AHRQ welcomes questions and comments from readers of this publication who are interested in obtaining more information about access, cost, use, financing, and quality of healthcare in the United States. We also invite you to tell us how you are using this Statistical Brief and other HCUP data and tools, and to share suggestions on how HCUP products might be enhanced to further meet your needs. Please e-mail us at hcup@ahrq.gov or send a letter to the address below:Irene Fraser, Ph.D., Director Center for Delivery, Organization, and Markets Agency for Healthcare Research and Quality 540 Gaither Road Rockville, MD 20850 1 Substance Abuse and Mental Health Services Administration (SAMHSA). SAMHSA Opioid Overdose Prevention Toolkit. HHS Publication No. (SMA) 13-4742. Rockville, MD: Substance Abuse and Mental Health Services Administration, 2013. 2 Ibid. 3 SAMHSA. Results from the 2010 National Survey on Drug Use and Health: volume 1: summary of national findings. Rockville, MD: Substance Abuse and Mental Health Services Administration, Office of Applied Studies; 2011. https://www.cdc.gov/vitalsigns/painkilleroverdoses/index.html. Accessed July 11, 2014. 4 SAMHSA. The DAWN Report: Highlights of the 2011 Drug Abuse Warning Network (DAWN) Findings on Drug-Related Emergency Department Visits. February 22, 2013. Rockville, MD: Substance Abuse and Mental Health Services Administration, Center for Behavioral Health Statistics and Quality. https://www.samhsa.gov/data/sites/default/files/DAWN127/DAWN127/sr127-DAWN-highlights.htm. Accessed July 15, 2014. 5 Jones CM, Mack KA, Paulozzi LJ. Pharmaceutical overdose deaths, United States, 2010. Journal of the American Medical Association. 2013;309(7):657-9. 6 Centers for Disease Control and Prevention (CDC). National Center for Injury Prevention and Control. CDC Vital Signs Fact Sheet: Opioid Painkiller Prescribing: Where you Live Makes a Difference. July 2014. http://www.cdc.gov/vitalsigns/pdf/2014-07-vitalsigns.pdf. Accessed June 30, 2014. 7 SAMHSA. SAMHSA Opioid Overuse Prevention Toolkit. 2013. 8 Food and Drug Administration. FDA's Efforts to Address the Misuse and Abuse of Opioids. Last updated April 9, 2014. http://www.fda.gov/Drugs/DrugSafety/InformationbyDrugClass/ucm337852.htm. Accessed May 27, 2014. 9 SAMHSA. SAMHSA Opioid Overuse Prevention Toolkit. 2013. 10 Centers for Disease Control and Prevention, National Center for Injury Prevention and Control. Policy Impact: Prescription Painkiller Overdoses. November 2011. http://www.cdc.gov/drugoverdose/pdf/policyimpact-prescriptionpainkillerod-a.pdf. Accessed June 26, 2014. 11 For more information on the differences between population estimates by insurance and HCUP discharge counts by expected payer, please refer to Appendix B of the HCUP Methods Series #2013-01 Population Denominator Data for use with HCUP Databases (Updated with 2012 Population data). http://www.hcup-us.ahrq.gov/reports/methods/methods.jsp. Accessed July 11, 2014. 12 Barrett M, Lopez-Gonzalez L, Coffey R, Levit K. Population Denominator Data for use with the HCUP Databases (Updated with 2012 Population data). HCUP Methods Series Report #2013-01. Online. March 8, 2013. U.S. Agency for Healthcare Research and Quality. http://www.hcup-us.ahrq.gov/reports/methods/2013_01.pdf. Accessed December 13, 2013. |
| Internet Citation: Statistical Brief #177. Healthcare Cost and Utilization Project (HCUP). September 2025. Agency for Healthcare Research and Quality, Rockville, MD. hcup-us.ahrq.gov/reports/statbriefs/sb177-Hospitalizations-for-Opioid-Overuse.jsp. |
| Are you having problems viewing or printing pages on this website? |
| If you have comments, suggestions, and/or questions, please contact hcup@ahrq.gov. |
| If you are experiencing issues related to Section 508 accessibility of information on this website, please contact hcup@ahrq.gov. |
| Privacy Notice, Viewers & Players |
| Last modified 9/3/25 |