STATISTICAL BRIEF #175 |
July 2014
Audrey J. Weiss, Ph.D., Marguerite L. Barrett, M.S., and Claudia A. Steiner, M.D., M.P.H. Introduction Nearly one-third of all healthcare spending in the United States is attributed to inpatient hospital services.1 Between 1997 and 2011, aggregate inflation-adjusted hospital costs grew by 3.6 percent annually.2 Average inpatient hospital costs vary substantially by condition. For example, in 2011 the average hospital cost for a newborn infant was well below the average cost across all hospital stays, while the average cost for acute myocardial infarction was well above the average cost for all conditions.3 Timely information on trends in the costs and types of hospitalizations provide analysts and policymakers with baseline information that can be used to help evaluate the impact of healthcare improvement efforts. A novel initiative from the Agency for Healthcare Research and Quality (AHRQ) Healthcare Cost and Utilization Project (HCUP) is used in this Statistical Brief to produce timely, current inpatient statistics on the cost and utilization of hospitalizations according to general types of conditions (e.g., medical, surgical).4 In this HCUP Statistical Brief, we use historical HCUP inpatient data from 2003 through 2011 along with early 2012 data from nine HCUP States to develop national projections of 2012 and 2013 hospital costs and other inpatient statistics for all hospitalizations (any reason). We examine five distinct hospital service lines that together encompass all types of inpatient discharges: medical, surgical, injury, mental health, and maternal and neonatal. Differences greater than 10 percent between annual weighted estimates are noted in the text. Because analyses in this Statistical Brief are based on all discharges from all States weighted to a national level, the values may differ slightly from results reported from the HCUP Nationwide Inpatient Sample (NIS). Findings Average hospital costs, total discharges, and average length of stay by hospital service line, 2003-2013 Table 1 summarizes the average hospital costs, total discharges, and average length of stay for all inpatient hospitalizations and hospitalizations for five component hospital service lines in 2003 and 2011 (actual values) and for 2013 (projected values). The average annual percentage change from 2003 to 2011 (actual change) and from 2011 to 2013 (projected change) is presented. |
|
| Table 1. Average hospital costs (inflation-adjusted), total discharges, and average length of stay by hospital service line, 2003-2013 | |||||
| Outcome by hospital service line | 2003 (actual) | 2011 (actual) | Average annual percentage change from 2003 to 2011 | 2013 (projected) | Average annual percentage change from 2011 to projected 2013 |
|---|---|---|---|---|---|
| Average hospital costs, $ (inflation-adjusted) | |||||
| All hospitalizations | 9,100 | 10,600 | 2.0 | 11,000 | 1.9 |
| Service lines | |||||
| Medical | 7,900 | 9,100 | 1.7 | 9,400 | 1.6 |
| Surgical | 17,600 | 21,400 | 2.4 | 22,500 | 2.6 |
| Injury | 12,100 | 14,400 | 2.2 | 15,100 | 2.2 |
| Mental health | 5,800 | 6,400 | 1.4 | 6,600 | 1.1 |
| Maternal/neonatal | 3,500 | 4,300 | 2.5 | 4,500 | 2.4 |
| Total discharges, thousands | |||||
| All hospitalizations | 37,400 | 37,700 | 0.1 | 37,300 | -0.5 |
| Service lines | |||||
| Medical | 16,900 | 17,800 | 0.6 | 17,800 | -0.1 |
| Surgical | 8,000 | 7,700 | -0.5 | 7,500 | -1.4 |
| Injury | 1,700 | 1,800 | 0.3 | 1,800 | -0.2 |
| Mental health | 1,800 | 2,100 | 1.9 | 2,200 | 1.4 |
| Maternal/neonatal | 8,900 | 8,400 | -0.4 | 8,300 | -0.7 |
| Average length of stay, days | |||||
| All hospitalizations | 4.8 | 4.7 | -0.1 | 4.6 | -0.8 |
| Service lines | |||||
| Medical | 4.9 | 4.7 | -0.4 | 4.6 | -1.1 |
| Surgical | 5.8 | 5.6 | -0.4 | 5.5 | -0.2 |
| Injury | 5.0 | 4.8 | -0.4 | 4.7 | -0.8 |
| Mental health | 7.4 | 6.9 | -0.7 | 6.7 | -1.4 |
| Maternal/neonatal | 3.0 | 3.2 | 0.6 | 3.2 | 0.4 |
| Note: Inflation-adjusted costs are presented in 2013 dollars. Source: Agency for Healthcare Research and Quality (AHRQ), Center for Delivery, Organization, and Markets, Healthcare Cost and Utilization Project (HCUP), State Inpatient Databases (SID), 2003-2011, and early State data, 2012 | |||||
|
|
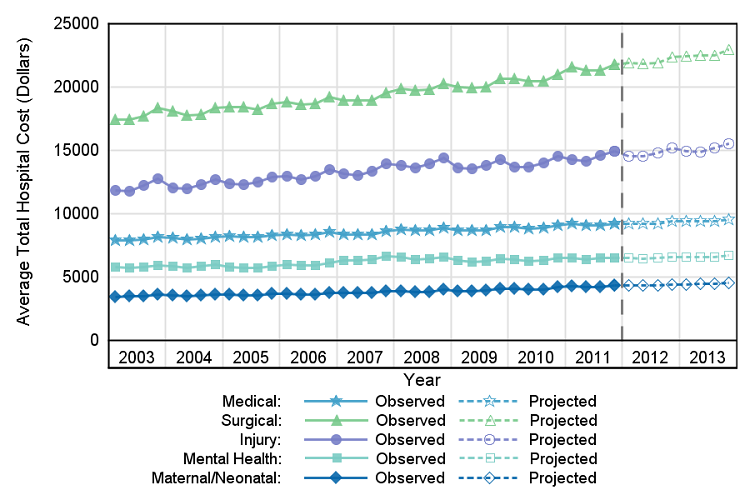
Figure 1. Average hospital costs (inflation-adjusted) by service line, quarterly values 2003-2013
Note: Inflation-adjusted costs are presented in fourth quarter 2013 dollars. Figure 1 is a line graph showing the slope of the observed changes in average total hospital costs in dollars per quarter from 2003 through 2011 and projected costs for 2012 and 2013. Inflation-adjusted costs are presented in fourth quarter 2013 dollars. Observed medical-related hospital costs began at 7896 in 2003 and increased slightly across time, ending at 9238 in 2011. Costs are projected to increase to 9566 by the end of 2013. Observed surgical-related hospital costs were the highest. They began at 17468 in 2003 and rose steadily to 21761 in 2011. Costs are projected to increase to 22943 by the end of 2013. Observed injury-related hospital costs began at 11825 in 2003 and increased across time, ending at 14928 in 2011. Costs are projected to increase to 15541 by the end of 2013. Observed mental health-related hospital costs began at 5781 in 2003 and increased slightly across time, ending at 6535 in 2011. Costs are projected to increase to 6708 by the end of 2013. Observed maternal and neonatal-related hospital costs were the lowest. Observed costs began at 3460 in 2003 and rose slightly across time, ending at 4373 in 2011. Costs are projected to increase to 4566 by the end of 2013. Source: Agency for Healthcare Research and Quality (AHRQ), Center for Delivery, Organization, and Markets, Healthcare Cost and Utilization Project (HCUP), State Inpatient Databases (SID), 2003-2011, and early State data, 2012. |
|
|
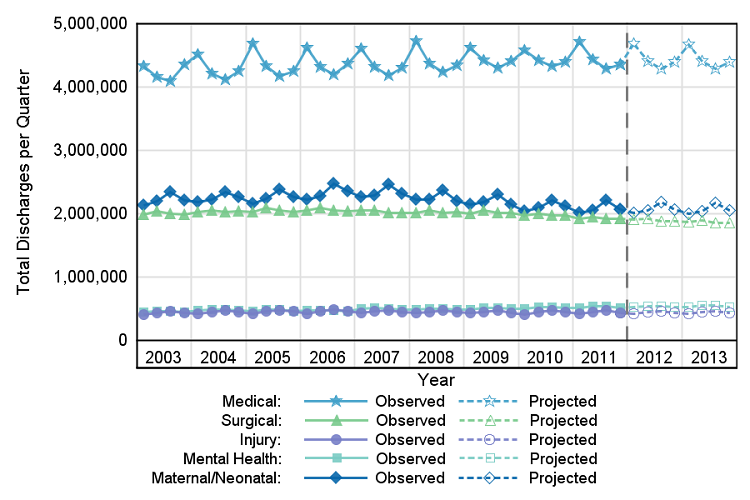
Figure 2. Total discharges by service line, quarterly values 2003-2013
Source: Agency for Healthcare Research and Quality (AHRQ), Center for Delivery, Organization, and Markets, Healthcare Cost and Utilization Project (HCUP), State Inpatient Databases (SID), 2003-2011, and early State data, 2012 Figure 2 is a line graph showing the slope of the observed changes in the number of total discharges per quarter from 2003 through 2011 and the projected number of total discharges for 2012 and 2013. The numbers of observed medical-related hospital discharges were the highest. They began at 4326189 in 2003 and remained stable across time, aside from some seasonal variations. The number of discharges in quarter 1 was consistently higher than the numbers in other quarters. There were 4351442 discharges at the end of 2011. The number of discharges is projected to be 4394703 by the end of 2013. The number of observed surgical-related hospital discharges began at 1983800 in 2003 and decreased slightly across time, ending at 1915677 in 2011. The number of discharges is projected to decrease to 1857773 by the end of 2013. The number of observed injury-related hospital discharges began at 407776 in 2003 and rose slightly across time, ending at 438474 in 2011. The number of discharges is projected to continue to remain stable at 439357 by the end of 2013. The number of observed mental health-related hospital discharges began at 444307 in 2003 and rose slightly across time, ending at 516328 in 2011. The number of discharges is projected to increase slightly to 531086 by the end of 2013. The number of observed maternal and neonatal-related hospital discharges began at 2128606 in 2003 and decreased slightly across time, with some seasonal variations. The number of discharges in quarter 3 was consistently slightly higher than the numbers in other quarters. There were 2072615 discharges at the end of 2011. The number of discharges is projected to be 2048566 by the end of 2013. Source: Agency for Healthcare Research and Quality (AHRQ), Center for Delivery, Organization, and Markets, Healthcare Cost and Utilization Project (HCUP), State Inpatient Databases (SID), 2003-2011, and early State data, 2012. |
|
|
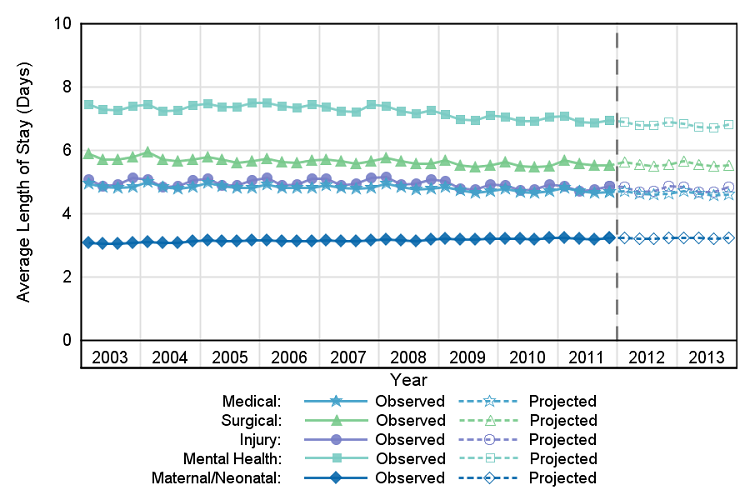
Figure 3. Average length of stay by service line, quarterly values 2003-2013
Source: Agency for Healthcare Research and Quality (AHRQ), Center for Delivery, Organization, and Markets, Healthcare Cost and Utilization Project (HCUP), State Inpatient Databases (SID), 2003-2011, and early State data, 2012 Figure 3 is a line graph showing the slope of the observed changes in the average length of stay in days per quarter from 2003 through 2011 and the projected number of total discharges for 2012 and 2013. The average length of medical-related hospital stays was the longest. They began at 4.9 days and were stable across time, ending at 4.7 in 2011. The projected average length of these hospital stays continues to be stable, ending at 4.6 days in 2013. The average length of surgical-related hospital stays began at 5.9 and was stable across time, ending at 5.5 in 2011. The projected average length of these hospital stays continues to be stable, ending at 5.5 in 2013. The average length of injury-related hospital stays began at 5.1 and was stable across time, ending at 4.9 in 2011. The projected average length of these hospital stays continues to be stable, ending at 4.8 in 2013. The average length of mental health-related hospital stays began at 7.5 and declined slightly across time, ending at 6.9 in 2011. The projected average length of these hospital stays is projected to continue a slight decline, ending at 6.8 in 2013. The average length of maternal and neonatal-related hospital stays was the shortest. They began at 3.1 and were stable across time, ending at 3.2 in 2011. The projected average length of these hospital stays continues to be stable, ending at 3.2 in 2013. Source: Agency for Healthcare Research and Quality (AHRQ), Center for Delivery, Organization, and Markets, Healthcare Cost and Utilization Project (HCUP), State Inpatient Databases (SID), 2003-2011, and early State data, 2012. |
The estimates in this Statistical Brief are based upon data from the Healthcare Cost and Utilization Project (HCUP) State Inpatient Databases (SID) for 2003 through 2011. The SID from 2003 through 2011 include about 305 million inpatient discharges from 47 States. At the time these statistics were generated, we had early quarterly data for nine States for 2012. The 2012 projections incorporated observed rates for these nine States and estimated rates from time-series models for the remaining States. For 2013, the projections were entirely based on rates estimated from time-series models. National quarterly projections for 2012 and 2013 were generated using the SAS Time Series Forecasting System™ (Version 9.2).5 Projections were calculated first by State and then weighted proportionally to the nine Census divisions and the nation. For each State, the software automatically selected from among 40 different time series models the model with the lowest mean absolute percentage error (MAPE) for that State. National quarterly trends were calculated as a weighted average of the State-level quarterly trends within each division. Each State's weight was proportional to its total number of discharges (excluding newborns) as reported in the American Hospital Association (AHA) Annual Survey of Hospitals. These AHA-based weights were used throughout the period, 2003-2012. Definitions Case definition Coding criteria for the five hospital service lines are provided in Table 2 and are based on International Classification of Diseases, Ninth Revision, Clinical Modification (ICD-9-CM) codes, Clinical Classifications Software (CCS) categories, and diagnosis-related groups (DRGs) (see definitions below). Each discharge was assigned to a single hospital service line hierarchically, based on the following order: maternal and neonatal, mental health, injury, surgical, and medical. Diagnoses, ICD-9-CM Clinical Classifications Software (CCS), and Diagnosis-Related Groups (DRGs) The principal diagnosis is that condition established after study to be chiefly responsible for the patient's admission to the hospital. Secondary diagnoses are concomitant conditions that coexist at the time of admission or develop during the stay. All-listed diagnoses include the principal diagnosis plus these additional secondary conditions. ICD-9-CM assigns numeric codes to diagnoses. There are approximately 14,000 ICD-9-CM diagnosis codes. CCS categorizes ICD-9-CM diagnoses into a manageable number of clinically meaningful categories.6 This "clinical grouper" makes it easier to quickly understand patterns of diagnoses. CCS categories identified as "Other" typically are not reported; these categories include miscellaneous, otherwise unclassifiable diagnoses that may be difficult to interpret as a group. DRGs comprise a patient classification system that categorizes patients into groups that are clinically coherent and homogeneous with respect to resource use. DRGs group patients according to diagnosis, type of treatment (procedures), age, and other relevant criteria. Each hospital stay has one assigned DRG. |
| Table 2. Coding criteria for the five hospital service lines analyzed in this research |
| Maternal and Neonatal Service Line |
| Maternal and neonatal stays are defined using the following CCS principal diagnosis categories:
Maternal
|
| Mental Health Service Line |
| Mental health visits are defined using the following CCS principal diagnosis categories:
Starting in 2007
|
| Injury Service Line |
| Injuries are identified using the principal diagnosis and a scheme recommended by Safe States Alliance, which was previously known as the State and Territorial Injury Prevention Directors Association (STIPDA). The table below lists the diagnosis codes in the range 800-999 used to identify injuries.
Included
|
| Surgical Service Line |
| Surgical stays are identified by a surgical DRG. The DRG grouper first assigns the discharge to a major diagnostic category (MDC) based on the principal diagnosis. For each MDC, there is a list of procedure codes that qualify as operating room procedures. If the discharge involves an operating room procedure, it is assigned to one of the surgical DRGs within the MDC category; otherwise, it is assigned to a medical DRG. |
| Medical Service Line |
| Medical stays are identified by a medical DRG. The DRG grouper first assigns the discharge to an MDC, based on the principal diagnosis. For each MDC, there is a list of procedure codes that qualify as operating room procedures. If the discharge involves an operating room procedure, it is assigned to one of the surgical DRGs within the MDC category; otherwise, it is assigned to a medical DRG. |
Average annual percentage change Average annual percentage change is calculated using the following formula: Average annual percentage change equals open bracket, open parenthesis, end value divided by beginning value, close parenthesis, to the power of 1 divided by change in years, minus 1, close bracket, multiplied by 100. Types of hospitals included in HCUP HCUP is based on data from community hospitals, which are defined as short-term, non-Federal, general, and other hospitals, excluding hospital units of other institutions (e.g., prisons). HCUP data include obstetrics and gynecology, otolaryngology, orthopedic, cancer, pediatric, public, and academic medical hospitals. Excluded are long-term care, rehabilitation, psychiatric, and alcoholism and chemical dependency hospitals. However, if a patient received long-term care, rehabilitation, or treatment for psychiatric or chemical dependency conditions in a community hospital, the discharge record for that stay will be included in the State Inpatient Databases (SID). Unit of analysis The unit of analysis is the hospital discharge (i.e., the hospital stay), not a person or patient. This means that a person who is admitted to the hospital multiple times in one year will be counted each time as a separate "discharge" from the hospital. Costs and charges Total hospital charges were converted to costs using HCUP Cost-to-Charge Ratios (CCRs) based on hospital accounting reports from the Centers for Medicare & Medicaid Services (CMS).7 Costs will reflect the actual expenses incurred in the production of hospital services, such as wages, supplies, and utility costs; charges represent the amount a hospital billed for the case. For each hospital, a hospital-specific CCR is used. The CCRs are at the hospital level and are not sensitive to possible differences by hospital service line. Hospital charges reflect the amount the hospital billed for the entire hospital stay and do not include professional (physician) fees. For the purposes of this Statistical Brief, costs are reported to the nearest hundred. Quarterly cost data from the HCUP Projections8 were weighted to produce annual costs. Quarterly and annual costs were inflation adjusted using the Gross Domestic Product (GDP) from the U.S. Department of Commerce, Bureau of Economic Analysis (BEA), with either the 2013 annual (Table 1) or 2013 fourth quarterly value (Figure 1) as the index base.9 That is, all costs are expressed in 2013 dollars. About HCUP The Healthcare Cost and Utilization Project (HCUP, pronounced "H-Cup") is a family of healthcare databases and related software tools and products developed through a Federal-State-Industry partnership and sponsored by the Agency for Healthcare Research and Quality (AHRQ). HCUP databases bring together the data collection efforts of State data organizations, hospital associations, private data organizations, and the Federal government to create a national information resource of encounter-level healthcare data (HCUP Partners). HCUP includes the largest collection of longitudinal hospital care data in the United States, with all-payer, encounter-level information beginning in 1988. These databases enable research on a broad range of health policy issues, including cost and quality of health services, medical practice patterns, access to healthcare programs, and outcomes of treatments at the national, State, and local market levels. HCUP would not be possible without the contributions of the following data collection Partners from across the United States: Alaska State Hospital and Nursing Home Association Arizona Department of Health Services Arkansas Department of Health California Office of Statewide Health Planning and Development Colorado Hospital Association Connecticut Hospital Association Florida Agency for Health Care Administration Georgia Hospital Association Hawaii Health Information Corporation Illinois Department of Public Health Indiana Hospital Association Iowa Hospital Association Kansas Hospital Association Kentucky Cabinet for Health and Family Services Louisiana Department of Health and Hospitals Maine Health Data Organization Maryland Health Services Cost Review Commission Massachusetts Center for Health Information and Analysis Michigan Health & Hospital Association Minnesota Hospital Association Mississippi Department of Health Missouri Hospital Industry Data Institute Montana MHA - An Association of Montana Health Care Providers Nebraska Hospital Association Nevada Department of Health and Human Services New Hampshire Department of Health & Human Services New Jersey Department of Health New Mexico Department of Health New York State Department of Health North Carolina Department of Health and Human Services North Dakota (data provided by the Minnesota Hospital Association) Ohio Hospital Association Oklahoma State Department of Health Oregon Association of Hospitals and Health Systems Oregon Health Policy and Research Pennsylvania Health Care Cost Containment Council Rhode Island Department of Health South Carolina Budget & Control Board South Dakota Association of Healthcare Organizations Tennessee Hospital Association Texas Department of State Health Services Utah Department of Health Vermont Association of Hospitals and Health Systems Virginia Health Information Washington State Department of Health West Virginia Health Care Authority Wisconsin Department of Health Services Wyoming Hospital Association About Statistical Briefs HCUP Statistical Briefs are descriptive summary reports presenting statistics on hospital inpatient and emergency department use and costs, quality of care, access to care, medical conditions, procedures, patient populations, and other topics. The reports use HCUP administrative healthcare data. About the SID The HCUP State Inpatient Databases (SID) are hospital inpatient databases from data organizations participating in HCUP. The SID contain the universe of the inpatient discharge abstracts in the participating HCUP States, translated into a uniform format to facilitate multistate comparisons and analyses. Together, the SID encompass more than 95 percent of all U.S. community hospital discharges in 2009. The SID can be used to investigate questions unique to one State, to compare data from two or more States, to conduct market-area variation analyses, and to identify State-specific trends in inpatient care utilization, access, charges, and outcomes. For More Information For more information about HCUP, visit http://www.hcup-us.ahrq.gov/. For additional HCUP statistics, visit HCUPnet, our interactive query system, at https://datatools.ahrq.gov/hcupnet. For information on other hospitalizations in the United States, refer to the following HCUP Statistical Briefs located at http://www.hcup-us.ahrq.gov/reports/statbriefs/statbriefs.jsp:
For a detailed description of HCUP and more information on the State Inpatient Databases (SID), please refer to the following publication: Introduction to the HCUP State Inpatient Databases. Online. August 2013. U.S. Agency for Healthcare Research and Quality. http://hcup-us.ahrq.gov/db/state/siddist/Introduction_to_SID.pdf. Accessed December 13, 2013. Suggested Citation Weiss AJ (Truven Health Analytics), Barrett ML (M.L. Barrett, Inc.), Steiner CA (AHRQ). Trends and Projections in Inpatient Hospital Costs and Utilization, 2003-2013. HCUP Statistical Brief #175. July 2014. Agency for Healthcare Research and Quality, Rockville, MD. http://www.hcup-us.ahrq.gov/reports/statbriefs/sb175-Hospital-Cost-Utilization-Projections-2013.pdf. Acknowledgments The authors would like to acknowledge the contributions of Clare Sun of Truven Health Analytics. *** AHRQ welcomes questions and comments from readers of this publication who are interested in obtaining more information about access, cost, use, financing, and quality of healthcare in the United States. We also invite you to tell us how you are using this Statistical Brief and other HCUP data and tools, and to share suggestions on how HCUP products might be enhanced to further meet your needs. Please e-mail us at hcup@ahrq.gov or send a letter to the address below:Irene Fraser, Ph.D., Director Center for Delivery, Organization, and Markets Agency for Healthcare Research and Quality 540 Gaither Road Rockville, MD 20850 1 Gonzalez JM. National healthcare expenses in the U.S. civilian noninstitutionalized population, 2011. MEPS Statistical Brief #425. November 2013. Agency for Healthcare Research and Quality, Rockville, MD. http://meps.ahrq.gov/data_files/publications/st425/stat425.pdf. Accessed March 28, 2014. 2 Pfuntner A, Wier LM, Steiner C. Costs for hospital stays in the United States, 2011. HCUP Statistical Brief #168. December 2013. Agency for Healthcare Research and Quality, Rockville, MD. http://www.hcup-us.ahrq.gov/reports/statbriefs/sb168-Hospital-Costs-United-States-2011.pdf. Accessed January 28, 2014. 3 Ibid. 4 Complete and detailed description, methodology, data, and projections are provided in: Steiner C, Andrews R, Barrett M, Weiss A. HCUP Projections: Cost of Inpatient Discharges 2012 to 2013. HCUP Projections Report #2013-01. December 11, 2013. Agency for Healthcare Research and Quality: Rockville, MD. http://www.hcup-us.ahrq.gov/reports/projections/2013-01.pdf. Accessed January 31, 2014. 5 SAS Institute. Large-Scale Automatic Forecasting Using Inputs and Calendar Events. White Paper, SAS Institute Inc., 2009. 6 HCUP Clinical Classifications Software (CCS). Healthcare Cost and Utilization Project (HCUP). U.S. Agency for Healthcare Research and Quality, Rockville, MD. Updated April 2014. http://www.hcup-us.ahrq.gov/toolssoftware/ccs/ccs.jsp. Accessed May 29, 2014. 7 HCUP Cost-to-Charge Ratio (CCR) Files. Healthcare Cost and Utilization Project (HCUP). 2001-2011. U.S. Agency for Healthcare Research and Quality, Rockville, MD. Updated August 2013. http://www.hcup-us.ahrq.gov/db/state/costtocharge.jsp. Accessed May 29, 2014. 8 Steiner C, Andrews R, Barrett M, Weiss A. HCUP Projections: Cost of Inpatient Discharges 2012 to 2013. HCUP Projections Report #2013-01. December 11, 2013. Agency for Healthcare Research and Quality, Rockville, MD. http://www.hcup-us.ahrq.gov/reports/projections/2013-01.pdf. Accessed January 31, 2014. 9 U.S. Bureau of Economic Analysis. National Income and Product Account Tables, Table 1.1.4 Price Indexes for Gross Domestic Product. http://www.bea.gov/iTable/iTable.cfm?ReqID=9&step=1#reqid=9&step=1&isuri=1. Accessed March 20, 2014. |