
HEALTHCARE COST AND UTLIZATION PROJECT – HCUP
A FEDERAL-STATE-INDUSTRY PARTNERSHIP IN HEALTH DATA
Sponsored by the Agency for Healthcare Research and Quality
|
THE NIS WAS REDESIGNED BEGINNING WITH 2012.
The new NIS is a sample of discharges from all hospitals participating in HCUP. For prior years, the NIS was a sample of hospitals. Please read all documentation carefully. |
| These pages provide only an Introduction to the NIS 2014 package.
For full documentation and notification of changes, visit the HCUP User Support (HCUP-US) website at http://www.hcup-us.ahrq.gov. |
Issued November 2016
Agency for Healthcare Research and Quality
Healthcare Cost and Utilization Project (HCUP)
Phone: (866) 290-HCUP (4287)
Email: hcup@ahrq.gov
website: http://www.hcup-us.ahrq.gov
NIS Data and Documentation Distributed by:
HCUP Central Distributor
Phone: (866) 556-4287 (toll-free)
Fax: (866) 792-5313
E-mail: HCUPDistributor@ahrq.gov
HCUP NATIONWIDE INPATIENT SAMPLE (NIS) SUMMARY OF DATA USE RESTRICTIONS |
***** REMINDER ***** |
All users of the NIS must take the on-line HCUP Data Use Agreement (DUA) training course, and read and sign a Data Use Agreement.a Authorized users of HCUP data agree to the following restrictions:b
Any violation of the limitations in the Data Use Agreement is punishable under Federal law by a fine of up to $10,000 and up to 5 years in prison. Violations may also be subject to penalties under State statutes. |
a The on-line Data Use Agreement training session and the Data Use Agreement are available on the HCUP User Support (HCUP-US) website. |
All HCUP data users, including data purchasers and collaborators, must complete the online HCUP Data Use Agreement (DUA) Training Tool, and read and sign the HCUP Data Use Agreement. Proof of training completion and signed Data Use Agreements must be submitted to the HCUP Central Distributor as described below.
The on-line DUA training course is available at: http://www.hcup-us.ahrq.gov/tech_assist/dua.jsp.
The HCUP Nationwide Data Use Agreement are is available on the AHRQ-sponsored HCUP website at: http://www.hcup-us.ahrq.gov
HCUP Central Distributor
Data purchasers will be required to provide their DUA training completion code and will execute their DUAs electronically as a part of the online ordering process. The DUAs and training certificates for collaborators and others with access to HCUP data should be submitted directly to the HCUP Central Distributor using the contact information below.
The HCUP Central Distributor can also help with questions concerning HCUP database purchases, your current order, training certificate codes, or invoices, if your questions are not covered in the Purchasing FAQs on the Online HCUP Central Distributor website.
Purchasing FAQs:
https://www.distributor.hcup-us.ahrq.gov/Purchasing-Frequently-Asked-Questions.aspx
Phone: 866-556-HCUP (4287) (toll free in the United States)
Email: HCUPDistributor@AHRQ.gov
Fax: 866-792-5313 (toll free)
Mailing address:
HCUP Central Distributor
Social & Scientific Systems, Inc.
8757 Georgia Ave, 12th Floor
Silver Spring, MD 20910
HCUP User Support:
Information about the content of the HCUP databases and Requirements for Publishing with HCUP Data is available on the HCUP-US website. For questions about using the HCUP databases, software tools, supplemental files, and other HCUP products, or about data use restrictions and publishing with the data, please review the HCUP Frequently Asked Questions or contact HCUP User Support:
HCUP FAQs:
http://www.hcup-us.ahrq.gov/tech_assist/faq.jsp
Email: hcup@ahrq.gov
Phone: 866-290-HCUP (4287) (toll free)
WHAT'S NEW IN THE 2014 NATIONAL INPATIENT SAMPLE (NIS)? |
|
|
UNDERSTANDING THE NIS |
| This document, Introduction to the NIS, 2014, summarizes the content of the NIS and describes the development of the NIS sample and weights. Important considerations for data analysis are provided along with references to detailed reports. In-depth documentation for the NIS is available on the HCUP-US website. |
HEALTHCARE COST AND UTILIZATION PROJECT — HCUP
A FEDERAL-STATE-INDUSTRY PARTNERSHIP IN HEALTH DATA
Sponsored by the Agency for Healthcare Research and Quality
The Agency for Healthcare Research and Quality and
the staff of the Healthcare Cost and Utilization Project (HCUP) thank users for
purchasing the HCUP National Inpatient Sample (NIS).
HCUP National Inpatient Sample (NIS)
The National Inpatient Sample (NIS) is part of the Healthcare Cost and Utilization Project (HCUP), sponsored by the Agency for Healthcare Research and Quality (AHRQ).
The NIS is a database of hospital inpatient stays derived from billing data submitted by hospitals to statewide data organizations across the U.S. These inpatient data include clinical and resource use information typically available from discharge abstracts. Researchers and policy makers use the NIS to make national estimates of healthcare utilization, access, charges, quality, and outcomes.
The NIS covers all patients, including individuals covered by Medicare, Medicaid, or private insurance, and the uninsured. For Medicare, the NIS includes Medicare Advantage patients, a population that is missing from Medicare claims data but that comprises as much as 20 percent of Medicare beneficiaries. The NIS' large sample size enables analyses of rare conditions, uncommon treatments, and special patient populations.
The NIS is sampled from the State Inpatient Databases (SID), which include all inpatient data that are currently contributed to HCUP. The 2014 NIS sampling frame is comprised of 44 States and the District of Columbia, covering more than 96 percent of the U.S. population in Appendix I, Figure 1 and including more than 94 percent of discharges from U.S. community hospitals Appendix I, Table 4. A list of the statewide data organizations participating in the NIS and a summary of NIS States, hospitals, and discharges by year are provided in Appendix 1 (Table 2 and Table 3). The NIS includes weights for calculating national estimates.
The 2012 National Inpatient Sample (NIS) was redesigned to improve national estimates. To highlight the design change, beginning with 2012 data, AHRQ renamed the NIS from the "Nationwide Inpatient Sample" to the "National Inpatient Sample." The redesign incorporates three major types of changes:
The new sampling strategy produces more precise estimates than the previous NIS design by reducing sampling error. For many estimates, confidence intervals under the new design are about half the length of confidence intervals under the previous design.
Key features of the most recent NIS (2014) include:
Changes to the NIS may impact some types of analyses. For example, the elimination of hospital identifiers means that hospital linkages can no longer be done with the NIS, and the sampling of discharges means that analyses relying on a census of discharges from sampled hospitals (e.g. hospital volume analysis) can no longer be performed. Because inpatient data are available for many individual States through the HCUP Central Distributor, state inpatient data can be used for those analyses that require a census of discharges from individual hospitals, local market areas, and States.
A summary of design changes is provided in Table 1 in Appendix I, The National Inpatient Sample (NIS) Design Changes. For a detailed description of the NIS redesign, please see the 2012 NIS Redesign Report available on the HCUP-US website.
The NIS is available yearly, beginning with 1988, allowing analysis of trends over time. Analyses of time trends using the HCUP NIS are recommended from 1993 forward because earlier samples were drawn from only 8 to 11 States, covering less than 50 percent of the hospital discharge population. For trends analysis using NIS data 2011 and earlier, revised weights should be used to make estimates comparable to the new 2012 design. Users should refer to 1993-2011 NIS Trend Weights Files and the report, Using the HCUP Nationwide Inpatient Sample to Estimate Trends, available on the HCUP-US website, for details.
Periodically, new data elements are added to the NIS and some are dropped. Appendix III provides a summary of data elements and when they are effective.
Access to the NIS is open to users who sign data use agreements. Uses are limited to research and aggregate statistical reporting.
For more information on the NIS, please visit the AHRQ-sponsored HCUP-US website at http://www.hcup-us.ahrq.gov.
The National Inpatient Sample (NIS) contains all-payer data on hospital inpatient stays from States participating in the Healthcare Cost and Utilization Project (HCUP). Each year of the NIS includes over 7 million inpatient stays.
The NIS contains clinical and resource use information included in a typical discharge abstract. The NIS is a database of hospital inpatient stays derived from billing data submitted by hospitals to statewide data organizations across the U.S.
NIS 2012 Redesign
The 2012 National Inpatient Sample (NIS) was redesigned to improve national estimates. To highlight the design change, beginning with 2012 data, AHRQ renamed the NIS from the "Nationwide Inpatient Sample" to the "National Inpatient Sample." The redesign incorporates three major types of changes.
Impact of New Design on Estimates
The new NIS is now stratified by nine Census Divisions rather than four Census Regions, which will allow more refined analyses of geographic variation in U.S. hospitalizations. The new sampling strategy produces more precise estimates than the previous NIS design by reducing sampling error. For national-level estimates, the 2012 NIS systematic design reduces the margin of error by 42 to 48 percent over the previous NIS design for the outcomes studied (total discharges, average length-of-stay, average charges, and mortality rates); thus the new NIS design generates estimates that are about twice as precise as those from the old design. The margin of error is commonly used by the popular press to describe the reliability of sample statistics. Technically, it is the half-width of a confidence interval around a sample statistic, such as a rate or a mean. The systematic design also consistently reduced the margin of error for estimates at the DRG level.
As a result of the changes implemented in the 2012 redesign, users should expect one-time disruptions to historical trends for counts, rates, and means estimated from the NIS, beginning with data year 2012. For 2012 it is expected to see overall trends in discharge counts to decline by about 4.3 percent, overall trends in average length-of-stay to decline by about 1.5 percent, overall trends in total charges to decline by about 0.5 percent, and overall trends in hospital mortality to decline by about 2.0 percent. New weights for prior years of the NIS to make prior year estimates comparable to the new design implemented in 2012 are available for download under 1993-2011 NIS Trend Weights Files from the NIS Database Documentation page on the HCUP-US website.
A summary of design changes is provided in Table 1 in Appendix I, The National Inpatient Sample (NIS) Design Changes. For a detailed description of the NIS redesign and the effects on sample estimates, please see the 2012 NIS Redesign Report available on the HCUP-US website.
The NIS sampling and weighting strategy was also revised in 1998. A detailed report describing this revision, Changes in NIS Sampling and Weighting Strategy for 1998, is available on the HCUP-US website.
Types of Hospitals Included in the NIS
The NIS is a sample of discharges from U.S. community hospitals, defined as "all non-Federal, short-term, general, and other specialty hospitals, excluding hospital units of institutions."1 Included among community hospitals are specialty hospitals such as obstetrics-gynecology, ear-nose-throat, orthopedic, and pediatric institutions. Also included are public hospitals and academic medical centers. Starting in 2005, the AHA included long term acute care facilities with average lengths-of-stay less than 30 days in the definition of community hospitals, and such facilities were included in the NIS sampling frame. However, because long-term acute care hospital data was not uniformly available from all States participating in HCUP, and their average length of stay (ALOS) was over 25 days (unlike other community hospitals with an ALOS of about 4.5 days), long-term acute care hospitals were excluded in the 2012 NIS redesign. Exclusion of long-term acute care hospitals mainly affects statistics related to the elderly — estimates of discharge counts, ALOS, charges, and mortality are reduced for the older age groups because of the demographics of patients in long-term acute care hospitals.
Sample Design for 2012 NIS
This universe of U.S. community hospitals is divided into strata using five hospital characteristics: ownership/control, bed size, teaching status, urban/rural location, and the nine U.S. census divisions (the four census regions were used prior to the 2012 NIS).
Prior to 2012, the NIS was a stratified probability sample of hospitals in the frame, with sampling probabilities proportional to the number of U.S. community hospitals in each stratum. The frame included all hospitals in the SID, and thus was limited by the availability of inpatient data from the data sources currently participating in HCUP. Starting with the 2012 NIS, a systematic sampling design was used to construct the database. Rather than first drawing a sample of hospitals and then keeping all discharges from that sample, in the 2012 NIS redesign a sample of discharges was drawn from all hospitals in the hospital frame. The new systematic sample is a self-weighted sample design similar to simple random sampling, but it is more efficient. It ensures that the sample is representative of the population on the following critical factors:
Weighted Estimates
To facilitate the production of national estimates, discharge weights are provided, along with information necessary to calculate the variance of estimates. Detailed information on the design of the NIS prior to 2006 is available in the year-specific reports on Design of the Nationwide Inpatient Sample found on the NIS Related Reports page on the HCUP-US website. Detailed information on the design of the NIS from 2006-2012 is available in the NIS Introduction for each year on the NIS Database Documentation - Archive page on the HCUP-US website.
NIS Data Sources, Hospitals, and Inpatient Stays
The NIS is sampled from the State Inpatient Databases (SID), which include all inpatient data that are currently contributed to HCUP. The 2014 NIS sampling frame is comprised of 44 States and the District of Columbia, covering more than 96 percent of the U.S. population (Appendix I, Figure 1) and including more than 94 percent of discharges from U.S. community hospitals (Appendix I, Table 4). A list of the statewide data organizations participating in the NIS and a summary of NIS States, hospitals, and discharges by year are provided in Appendix 1 (Table 2 and Table 3). The NIS includes weights for calculating national estimates.
Partner Restrictions
Some HCUP Partners that contributed data to the NIS imposed restrictions on the release of certain data elements or on the number and types of hospitals that could be included in the database. Because of confidentiality laws, some data sources were prohibited from providing HCUP with discharge records that indicated specific medical conditions and procedures, specifically HIV/AIDS, behavioral health, and abortion. Detailed information on these State-specific restrictions is available in Appendix II.
Contents of NIS
Each release of the NIS includes:
The NIS Database is distributed as fixed-width ASCII-formatted data files delivered via secure digital download from the Online HCUP Central Distributor. The files are compressed and encrypted with SecureZIP® from PKWARE. Users will need the password provided by the HCUP Central Distributor.
The NIS product is downloaded in a single zipped file for each year which contains several data-related files and accompanying documentation. The four data-related files include the following compressed files:
Inpatient Core File: This inpatient discharge-level file contains a sample of hospital discharge records from participating States. The unit of observation is an inpatient stay record. A list of data elements in the Inpatient Core File is provided in Table 1 in Appendix III. This file is available in all years of the NIS.
Hospital Weights File: This hospital-level file contains one observation for each hospital included in the NIS and contains weights and variance estimation data elements, as well as linkage data elements. The unit of observation is the hospital. Prior to the 2012 NIS, the HCUP hospital identifier (HOSPID) provided the linkage between the NIS Inpatient Core files and the Hospital Weights file. Beginning with the 2012 NIS, the NIS hospital number (HOSP_NIS) provides the linkage between the NIS Inpatient Core files and the Hospital Weights file. The HOSP_NIS values are reassigned each year, so they cannot be used to link hospitals across years. A list of data elements in the Hospital Weights File is provided in Table 2 of Appendix III. This file is available in all years of the NIS.
Disease Severity Measures File: This discharge-level file contains information from two different sets of disease severity measures. Information from the severity file is to be used in conjunction with the Inpatient Core file. The unit of observation is an inpatient stay record. Prior to the 2012 NIS, the HCUP unique record identifier (KEY) provided the linkage between the Core files and the Disease Severity Measures file. Beginning with the 2012 NIS, the unique NIS record number (KEY_NIS) provides the linkage between the Core files and the Disease Severity Measures file. A list of data elements in the Severity Measures file is provided in Table 3 of Appendix III. This file is available beginning with the 2002 NIS.
Diagnosis and Procedure Groups File: This discharge-level file contains data elements derived from AHRQ software tools based on the ICD-9-CM diagnostic and procedure information in the HCUP databases. The unit of observation is an inpatient stay record. Prior to the 2012 NIS, the HCUP unique record identifier (KEY) provided the linkage between the Core file and the Diagnosis and Procedure Groups file. Beginning with the 2012 NIS, the unique NIS record number (KEY_NIS) provides the linkage between the Core files and the Diagnosis and Procedure Groups file. A list of data elements in the Diagnosis and Procedure Groups file is provided in Table 4 of Appendix III. This file is available beginning with the 2005 NIS.
On the HCUP-US website, NIS users can access complete file documentation, including data element notes, file layouts, summary statistics, and related technical reports. Similarly, users can also download SAS, SPSS, and Stata load programs from this website. Available online documentation and supporting files are detailed in Appendix I, Table 5.
NIS Data Elements
All releases of the NIS contain two types of data: inpatient stay records and hospital information with weights to calculate national estimates. Appendix III identifies the data elements in each NIS file:
Not all data elements in the NIS are uniformly coded or available across all States. The tables in Appendix III are not complete documentation for the data. Please refer to the NIS documentation located on the HCUP-US website for comprehensive information about data elements and the files.
Getting Started
In order to load and analyze the NIS data on a computer, users will need the following:
Decompressing the NIS Files
To copy and decompress the data from the DVD, follow these steps:
Downloading and Running the Load Programs
Programs to load the data into SAS, SPSS, or Stata, are available on the HCUP User Support website (HCUP-US). The SAS and SPSS programs are available beginning with 1998. The Stata programs begin with 2004. To download and run the load programs, follow these steps:
NIS Documentation
Year-specific NIS documentation files on the HCUP-US website provide important resources for the user. Refer to these resources to understand the structure and content of the NIS and to aid in using the database.
Table 5 in Appendix I details both the NIS related reports and the comprehensive NIS database documentation available on HCUP-US.
HCUP On-Line Tutorials
For additional assistance, AHRQ has created the HCUP Online Tutorial Series, a series of free, interactive courses which provide training on technical methods for conducting research with HCUP data. Topics include an HCUP Overview Course and these tutorials:
The Load and Check HCUP Data tutorial provides instructions on how to unzip (decompress) HCUP data, save it on your computer, and load the data into a standard statistical software package. This tutorial also describes how to verify that the data have loaded correctly.
The HCUP Sampling Design tutorial is designed to help users learn how to account for sample design in their work with HCUP national (nationwide) databases.
The Producing National HCUP Estimates tutorial is designed to help users understand how the three national (nationwide) databases — the NIS, Nationwide Emergency Department Sample (NEDS), and Kids' Inpatient Database (KID) — can be used to produce national and regional estimates.
The Calculating Standard Errors tutorial shows how to accurately determine the precision of the estimates produced from the HCUP nationwide databases. Users will learn two methods for calculating standard errors for estimates produced from the HCUP national (nationwide) databases.
The HCUP Multi-year Analysis tutorial presents solutions that may be necessary when conducting analyses that span multiple years of HCUP data.
New tutorials are added periodically and existing tutorials are updated when necessary. The Online Tutorial Series is located on the HCUP-US website.
HOW TO USE THE NIS FOR DATA ANALYSIS
This section provides a brief synopsis of special considerations when using the NIS. For more details, refer to the comprehensive documentation on the HCUP-US website.
Data Use Agreement
If anyone other than the original purchaser uses the NIS data, be sure to have them read and sign a Data Use Agreement, after viewing the on-line Data Use Agreement Training Tool available on the HCUP-US website. A copy of the signed Data Use Agreements must be sent to the HCUP Central Distributor. See page 4 for the mailing address.
Choosing Data Elements for Analysis
ICD-9-CM Diagnosis and Procedure Codes
Missing Values
Missing data values can compromise the quality of estimates. If the outcome for discharges with missing values is different from the outcome for discharges with valid values, then sample estimates for that outcome will be biased and inaccurately represent the discharge population. For example, race is missing on about 6% of discharges in the 2014 NIS because some hospitals and HCUP State Partners do not supply it. (The percentage of missing race values was higher in previous years.) Therefore race-specific estimates may be biased. This is especially true for estimates of discharge totals by race.
There are several techniques available to help assess and overcome this missing data bias.2 Descriptions of such data preparation and adjustment are outside the scope of this report; however, it is recommended that researchers evaluate and adjust for missing data, if necessary. For details, see the report, Missing Data Methods for the NIS and the SID, available on the HCUP-US website.
Hospital-Level Data Elements
Beginning with the 2012 NIS, specific hospital identifiers (e.g. the AHA identifier) are no longer available. This means that you will not be able to link the NIS to outside data sources that require hospital-specific identifiers. However, there are hospital-level data elements for all hospitals in the NIS that allow you to study certain hospital characteristics including ownership/control, teaching status, rural/urban location, bed size, and the nine census divisions (as well as the four regions).
Longitudinal Hospital Analyses
Beginning with the 2012 data, the NIS includes a sample of discharges from all HCUP hospitals. However, the NIS hospital number (HOSP_NIS) values are reassigned each year, so they cannot be used to link hospitals across years. Thus the redesigned NIS cannot support longitudinal analyses of specific hospitals.
Hospital Volume Estimates
Prior to the 2012 NIS, the NIS was a sample of hospitals with 100% of discharges from the sampled hospitals included. Therefore, hospital volumes (i.e. totals of patients for a hospital) could be calculated for each sampled hospital. However, beginning with the 2012 NIS, it is no longer possible to estimate hospital volumes. The redesigned NIS is a sample of discharges from all HCUP hospitals, approximating a 20% sample of the target universe of hospital discharges. Individual hospital sampling rates, however, vary considerably depending on which stratum they are in and how well it is represented in the sampling frame. If a stratum is under-represented in the sampling frame, it will be oversampled to achieve the target sample size. Because information on the rate at which discharges were sampled from each hospital is not provided, users cannot reliably estimate individual hospital volumes using the 2012 or later NIS. However, users could estimate percentages of discharges (e.g. percentage of Medicare discharges) for a hospital equal to the percentage of discharges observed in the sample for the hospital.
Calculating National Estimates
Studying Trends
Studying Readmissions
Variance Calculations
It may be important for researchers to calculate a measure of precision for some estimates based on the NIS sample data. Variance estimates must take into account both the sampling design and the form of the statistic. A stratified systematic sample of discharges was drawn from a sorted list of discharges comprising all discharges in the sampling frame. To accurately calculate variances from the NIS, you must use appropriate statistical software and techniques. For details, see the special report, Calculating Nationwide Inpatient Sample Variances, available on the HCUP-US Website.
If discharges inside the sampling frame are similar to discharges outside the frame, the sample of discharges can be treated as if they were randomly selected from the entire universe of discharges within each stratum. Although the NIS is no longer a cluster sample, discharges are still clustered by hospitals. Therefore, hospitals (HOSP_NIS) should be treated as clusters when calculating statistics. Standard formulas for a stratified, single-stage cluster sample without replacement should still be used to calculate statistics and their variances in most applications.
A multitude of statistics can be estimated from the NIS data. Several computer programs are listed below that calculate statistics and their variances from sample survey data. Some of these programs use general methods of variance calculations (e.g., the jackknife and balanced half-sample replications) that take into account the sampling design. However, it may be desirable to calculate variances using formulas specifically developed for some statistics.
These variance calculations are based on finite-sample theory, which is an appropriate method for obtaining cross-sectional, national estimates of outcomes. According to finite-sample theory, the intent of the estimation process is to obtain estimates that are precise representations of the national population at a specific point in time. In the context of the NIS, any estimates that attempt to accurately describe characteristics and interrelationships among hospitals and discharges during a specific year should be governed by finite-sample theory. Examples of this would be estimates of expenditure and utilization patterns.
Alternatively, in the study of hypothetical population outcomes not limited to a specific point in time, the concept of a "superpopulation" may be useful. Analysts may be less interested in specific characteristics from the finite population (and time period) from which the sample was drawn than they are in hypothetical characteristics of a conceptual "superpopulation" from which any particular finite population in a given year might have been drawn. According to this superpopulation model, the national population in a given year is only a snapshot in time of the possible interrelationships among hospital and discharge characteristics. In a given year, all possible interactions between such characteristics may not have been observed, but analysts may wish to predict or simulate interrelationships that may occur in the future.
Under the finite-population model, the variances of estimates approach zero as the sampling fraction approaches one. This is the case because the population is fixed at that point in time, and because the estimate is for a fixed characteristic as it existed when sampled. This is in contrast to the superpopulation model, which adopts a stochastic viewpoint rather than a deterministic viewpoint. That is, the national discharge population in a particular year is viewed as a random sample that resulted from a specific set of random events drawn from an underlying superpopulation of similar random events that might have occurred. For example, the outcome of a particular hospitalization might differ depending admission timing, hospital staffing during the stay, and so on. Different methods are used for calculating variances under the two sample theories. The choice of an appropriate method for calculating variances for nationwide estimates depends on the type of measure and the intent of the estimation process.
Computer Software for Variance Calculations
The discharge weights are useful for producing discharge-level statistics for analyses that use the discharge as the unit of analysis. The discharge weights may be used to estimate national population statistics.
In most cases, computer programs are readily available to perform these calculations. Several statistical programming packages allow weighted analyses.;4 For example, nearly all SAS procedures incorporate weights. In addition, several statistical analysis programs have been developed to specifically calculate statistics and their standard errors from survey data. Version eight or later of SAS contains procedures (PROC SURVEYMEANS and PROC SURVEYREG) for calculating statistics based on specific sampling designs. Stata and SUDAAN are two other common statistical software packages that perform calculations for numerous statistics arising from the stratified, single-stage cluster sampling design. Examples of the use of SAS and Stata to calculate NIS variances are presented in the special report, Calculating National Inpatient Sample (NIS) Variances for Data Years 2012 and Later, available on the HCUP-US website. For an excellent review of programs to calculate statistics from survey data, visit the following website: http://www.hcp.med.harvard.edu/statistics/survey-soft/. ![]()
The NIS database includes a Hospital Weights File with data elements required by these programs to calculate finite population statistics. The file includes hospital identifiers (Primary Sampling Units or PSUs), stratification data elements, and stratum-specific totals for the numbers of discharges and hospitals so that finite-population corrections can be applied to variance estimates.
In addition to these subroutines, standard errors can be estimated by validation and cross-validation techniques. Given that a very large number of observations will be available for most analyses, it may be feasible to set aside a part of the data for validation purposes. Standard errors and confidence intervals can then be calculated from the validation data.
If the analytic file is too small to set aside a large validation sample, cross-validation techniques may be used. For example, ten-fold cross-validation would split the data into ten subsets of equal size. The estimation would take place in ten iterations. In each iteration, the outcome of interest is predicted for one-tenth of the observations by an estimate based on a model fit to the other nine-tenths of the observations. Unbiased estimates of error variance are then obtained by comparing the actual values to the predicted values obtained in this manner.
SAMPLING PROCEDURE
The NIS Hospital Universe
Each year, the AHA's Health Forum administers the AHA Annual Survey of Hospitals. The purpose of the survey is to collect utilization, financial, service, and personnel information on each of the nation's hospitals. The survey's overall response rate averages approximately 85 percent each year, which is high for a voluntary survey given its length and the size of the universe (about 6,000 hospitals). For hospitals that do not respond, the AHA imputes items based on prior-year information, so that data are available for all hospitals in the universe.
The hospital universe is defined by all hospitals that were open during any part of the calendar year and were designated as community hospitals in the AHA Annual Survey. For purposes of the NIS, the definition of a community hospital is that used by the AHA: "all nonfederal short-term general and other specialty hospitals, excluding hospital units of institutions." Consequently, Veterans Affairs hospitals and other Federal hospitals are excluded. Beginning with the 1998 redesign, rehabilitation hospitals are excluded. Beginning with the 2012 redesign, long-term acute care hospitals are also excluded.
Long-term acute care hospitals are classified as community hospitals by the AHA if they have an average length-of-stay (ALOS) less than 30 days. However, long-term acute care hospital data was not uniformly available from all States participating in HCUP, and ALOS data from these facilities was over 25 days (unlike other community hospitals with an ALOS of about 4.5 days). Thus, long term acute care facilities were eliminated from the 2012 NIS.
Prior to the 2012 NIS, NIS sample weights were calculated by dividing the number of universe discharges by the number of sampled discharges within each hospital stratum. The number of universe discharges had been estimated using data from the AHA annual hospital survey. In particular, the total number of discharges in the universe was estimated by the sum of births and admissions contained in the AHA annual survey for all hospitals in the universe.
Given that HCUP Partners supply more than 95 percent of discharges nationwide, beginning with the 2012 NIS, the universe count of discharges within each stratum is estimated using the actual count of discharges contained in HCUP data. The AHA counts are used only for hospitals in the universe that do not appear in HCUP data coming from the statewide data organizations.
This option was not considered for the previous 1998 redesign because HCUP data included a much smaller percentage of discharges in the United States, and the differences between HCUP counts and AHA counts would tend to adversely affect trends as the mix of HCUP States changed from year to year. In 2011, for hospitals in both the AHA and the SID, in 43 of 46 States, the AHA survey data estimated State discharge totals that were between 1 percent and 17 percent higher than the observed SID discharge totals. Overall, the AHA survey estimated about a 4 percent higher count of discharges than the observed SID count.
In the 2012 redesign, a logical corollary of switching from AHA discharge estimates to SID discharge counts was to distinguish unique hospitals using the SID hospital identifiers rather than the AHA hospital identifiers. For the vast majority of hospitals, the SID hospital identifiers are in one-to-one correspondence with the AHA hospital identifiers. However, about 10 percent of the AHA identifiers actually correspond to two or more hospitals in the SID that have common ownership within a hospital system. For these "combined" AHA identifiers, the number of estimated discharges and the number of hospital beds in the AHA data reflect the sum of estimated discharges and the sum of beds, respectively, from the constituent hospitals. As a result, these combined hospitals could have been allocated to the wrong bed size stratum in the sample design. Also, the between-hospital variance was combined with the within-hospital variance for these combined hospitals. Therefore, use of the SID hospital identifiers in the 2012 NIS disaggregates the previously combined hospitals in many States, which is likely to improve the classification of hospitals and improve variance estimates.
For more information on how hospitals in the data set were mapped to hospitals as defined by the AHA, refer to the special report, HCUP Hospital Identifiers.5 For a list of all data sources, refer to Table 2 in Appendix I.
Stratification Data Elements
Given the increase in the number of contributing States, AHRQ evaluated and revised the sampling and weighting strategy for the 1998 NIS and subsequent data years in order to best represent the U.S. This included changes to the definitions of the strata data elements, the exclusion of rehabilitation hospitals from the NIS hospital universe, and a change to the calculation of hospital universe discharges for the weights. A full description of this process is available in the special report on Changes in NIS Sampling and Weighting Strategy for 1998, available on the HCUP-US website. (A description of the sampling procedures and definitions of strata data elements used from 1988 through 1997 can be found in the special report: Design of the HCUP Nationwide Inpatient Sample, 1997. This report is also available on the HCUP-US website.)
Again for the 2012 NIS and subsequent data years, AHRQ evaluated and revised the sampling strategy in order to best represent the U.S. See Table 1 in Appendix I, The National Inpatient Sample (NIS) Design Changes, for a summary of design changes. For a detailed description of the NIS redesign, please see the 2012 NIS Redesign Report available on the HCUP-US website.
Prior to 2012, the NIS sampling strata were defined based on five hospital characteristics contained in the AHA hospital files. Beginning with the 2012 NIS, the only hospital-level stratification factor that changes is census division rather than census region6; and the stratification data elements were defined as follows:
Census Division — New England, Middle Atlantic, East North Central, West North Central, South Atlantic, South Central, Mountain, and Pacific. This is an important stratification data element because practice patterns have been shown to vary substantially by region. For example, lengths of stay tend to be longer in East Coast hospitals than in West Coast hospitals. The NIS States by census division are shown in Figure 2 of Appendix I.
No distinction was made by teaching status among rural hospitals, because rural teaching hospitals were rare. For example, in 2014, rural teaching hospitals comprised less than 3% of the total hospital universe. Bed size categories were defined within location and teaching status because they would otherwise have been redundant. Rural hospitals tend to be small; urban non-teaching hospitals tend to be medium-sized; and urban teaching hospitals tend to be large. Yet it was important to recognize gradations of size within these types of hospitals. For example, in serving rural discharges, the role of "large" rural hospitals (particularly rural referral centers) often differs from the role of "small" rural hospitals.
To further ensure geographic representativeness of the sample, implicit stratification data elements included de-identified hospital number, Diagnosis Related Group (DRG) and admission month. The discharges were sorted according to these data elements prior to systematic random sampling.
Design Considerations
Prior to 2012, the NIS was a stratified probability sample of hospitals in the frame, with sampling probabilities proportional to the number of U.S. community hospitals in each stratum: sampling probabilities were calculated to select 20% of the universe of U.S. community, non-rehabilitation hospitals contained in each stratum. This sample size was determined by AHRQ based on their experience with similar research databases. The overall design objective was to select a sample of hospitals that accurately represents the target universe, which includes hospitals outside the frame (i.e., having zero probability of selection). Moreover, this sample was to be geographically dispersed, yet drawn only from data supplied by HCUP Partners.
Starting with the 2012 NIS, a systematic sampling design is used to construct the database. Rather than first drawing a sample of hospitals and then keeping all discharges from that sample, in the 2012 NIS redesign a sample of discharges was drawn from all hospitals in the hospital frame. Both designs selected approximately 20 percent of the target universe of discharges from United States community hospitals, excluding rehabilitation and long-term acute care hospitals.
The new systematic sample is a self-weighted sample design similar to simple random sampling, but it is more efficient. It ensures that the sample is representative of the population on the following critical factors: hospital factors (hospital - unidentified, census division, ownership, urban-rural location, teaching status, number of beds) and patient factors (diagnosis-related group, admission month). Within each stratum all discharges are sorted in the following order on patient-level "control" variables: encrypted hospital ID, DRG, admission month, and a random number.
It should be possible, for example, to estimate DRG-specific average lengths of stay across all U.S. hospitals using weighted average lengths of stay, based on averages or regression coefficients calculated from the NIS. Ideally, relationships among outcomes and their correlates estimated from the NIS should accurately represent all U.S. hospitals. It is advisable to verify your estimates against other data sources, especially for specific patient populations (e.g. organ transplant recipients).
The 2012 NIS Redesign Report assessed the accuracy of NIS estimates and considered alternative stratified sampling allocation schemes. However, systematic sampling design was preferred for several reasons:
Overview of the Sampling Procedure
The strata for the 2012 and later NIS systematic sampling design are the same as those for the previous NIS sample design except that the four census regions are replaced by the nine census divisions—New England, Middle Atlantic, East North Central, West North Central, South Atlantic, South Central, Mountain, and Pacific. Within each stratum, dischargers are sorted by re-identified hospital number. Then, within each hospital, discharges are sorted by their DRG and their admission month. This sorting ensures that the NIS sample will be representative on these factors.
Next, within each stratum, a number of discharges proportionate to the number of discharges in the universe are selected systematically from the sorted list. For example, if the sampling frame was equal to the universe and 20 percent of the universe was required, then every fifth discharge would be selected from the sorted list of discharges, beginning with a randomly selected start at discharge number 1, 2, 3, 4, or 5 on the list.
To ensure a self-weighted sample that has 20 percent of the universe within each stratum represented, sampling rates would vary within each stratum, depending on the proportion of the population of discharges covered by the discharges in the sampling frame. Thus, the sampling rate would not always be 20 percent within each stratum. For strata that were missing more discharges, the sampling rate would be higher to ensure that the number of sampled discharges would equal 20 percent of the universe.
WEIGHTS
To obtain nationwide estimates, discharge weights were developed to extrapolate NIS sample discharges to the discharge universe. NIS discharge weights are calculated by dividing the number of universe discharges by the number of sampled discharges within each NIS stratum. Historically, the number of universe discharges had been estimated using data from the AHA annual hospital survey. In particular, the total number of discharges in the universe was estimated by the sum of births and admissions contained in the AHA annual survey for all hospitals in the universe.
Given that HCUP Partners supply more than 95 percent of discharges nationwide, beginning with the 2012 NIS, the universe count of discharges was estimated within each stratum using the actual count of discharges contained in HCUP data. The only exceptions are for strata with HCUP hospitals that, according to the AHA files, were open for the entire year but contributed less than a full year of data to HCUP. For those hospitals, the number of observed discharges was adjusted by a factor of 12 ÷ M, where M is the number of months for which the hospital contributed discharges to HCUP. For example, when a hospital contributed only six months of discharge data to HCUP, the adjusted number of discharges is double the observed number.
For non-HCUP hospitals in the universe, adjusted AHA discharge estimates were calculated by multiplying the AHA admissions plus births volume by the overall ratio of HCUP discharges to AHA volumes for HCUP hospitals in the census division.
The discharge weights are constant for all discharges within a stratum, where the stratum is defined by hospital characteristics: census division, rural/urban location, bed size, teaching status, and ownership. The previous design provided discharge weights that reflected the universe of discharges in each of the four census regions. The 2012 NIS design provides discharge weights that reflect the universe of discharges in each of the nine census divisions.
Each discharge weight is essentially equal to the number of target universe discharges that each sampled discharge represents in its stratum. Discharge weights to the universe were calculated as follows: Within stratum s, each NIS sample discharge's universe weight was calculated as:
DWs(universe) = DNs(universe) ÷ DNs(sample)
where DWs(universe) was the discharge weight; DNs(universe) represented the number of discharges from community hospitals in the universe within stratum s; and DNs(sample) was the number of discharges selected for the NIS. Thus, each discharge's weight (DISCWT) is equal to the number of universe discharges it represents in stratum s during that year.7 Because 20% of the universe discharges in each stratum were sampled, the discharge weights are near five.
Prior to the 2012 NIS redesign, the NIS included weights to project NIS hospitals to the number of hospital in the target universe. However, with the 2012 NIS redesign the hospital weights are discontinued because the NIS is now a sample of discharges from all available HCUP SID community hospitals, excluding rehabilitation and long-term acute care hospitals.
Appendix I: Tables and Figures
| Feature | Previous Design (1998-2011) | New 2012 and Later Design |
|---|---|---|
| Universe | Included long-term acute care hospitals | Removed long-term acute care hospitals |
| Discharge estimates based on AHA admissions plus births | Discharge estimates based on SID discharges when available (for about 90% of all hospitals); otherwise, based on adjusted AHA counts | |
| Hospitals defined based on AHA IDs | Hospitals defined based on State-supplied hospital identifiers for HCUP states | |
| Sample design | Sample hospitals and then retain all discharges from each sampled hospital | Systematic sample of discharges from all frame hospitals |
Stratified by:
|
Stratified by:
|
|
| Sorted by three-digit hospital ZIP Code within strata before sampling | Sorted by hospital and by DRG and admission month within strata before sampling | |
| Sample without self-weighting requires weights for all estimates | Self-weighting sample requires weights for estimating totals, but not for means and rates | |
| Data elements | Includes State and hospital identifiers and data elements with State-specific coding |
|
Abbreviations: AHA, American Hospital Association; DRG, diagnosis-related group; ID, identification numbers; SID, State Inpatient Databases
a Census region: Northeast, Midwest, South, West.
b Census division: New England, Middle Atlantic, East North Central, West North Central, South Atlantic, East South Central, West South Central, Mountain, Pacific.
Table 2: States Participating in 2014 NIS
| State | Data Organization |
|---|---|
| AR | Arkansas Department of Health |
| AZ | Arizona Department of Health Services |
| CA | Office of Statewide Health Planning & Development |
| CO | Colorado Hospital Association |
| CT | Connecticut Hospital Association |
| DC | District of Columbia Hospital Association |
| FL | Florida Agency for Health Care Administration |
| GA | Georgia Hospital Association |
| HI | Hawaii Health Information Corporation |
| IA | Iowa Hospital Association |
| IL | Illinois Department of Public Health |
| IN | Indiana Hospital Association |
| KS | Kansas Hospital Association |
| KY | Kentucky Cabinet for Health and Family Services |
| LA | Louisiana Department of Health and Hospitals |
| MA | Division of Health Care Finance and Policy |
| MD | Health Services Cost Review Commission |
| MI | Michigan Health & Hospital Association |
| MN | Minnesota Hospital Association |
| MO | Hospital Industry Data Institute |
| MT | MHA - An Association of Montana Health Care Providers |
| NC | North Carolina Department of Health and Human Services |
| ND | North Dakota (data provided by the Minnesota Hospital Association) |
| NE | Nebraska Hospital Association |
| NJ | New Jersey Department of Health |
| NM | New Mexico Department of Health |
| NV | Nevada Department of Health and Human Services |
| NY | New York State Department of Health |
| OH | Ohio Hospital Association |
| OK | Oklahoma State Department of Health |
| OR | Oregon Association of Hospitals and Health Systems |
| PA | Pennsylvania Health Care Cost Containment Council |
| RI | Rhode Island Department of Health |
| SC | South Carolina State Budget & Control Board |
| SD | South Dakota Association of Healthcare Organizations |
| TN | Tennessee Hospital Association |
| TX | Texas Department of State Health Services |
| UT | Utah Department of Health |
| VT | Vermont Association of Hospitals and Health Systems |
| VA | Virginia Health Information |
| WA | Washington State Department of Health |
| WI | Wisconsin Department of Health Services |
| WV | West Virginia Health Care Authority |
| WY | Wyoming Hospital Association |
| Year | States | Number of States | Number of Hospitals | Number of Discharges in the NIS, Unweighted | Number of Discharges in the NIS, Weighted | Number of Discharges in the NIS, Weighted with Trend Weight |
|---|---|---|---|---|---|---|
| 1988 | CA CO FL IA IL MA NJ WA | 8 | 759 | 5,265,756 | 35,171,448 | -- |
| 1989 | AZ CA CO FL IA IL MA NJ PA WA WI | 11 | 882 | 6,110,064 | 35,104,645 | -- |
| 1990 | AZ CA CO FL IA IL MA NJ PA WA WI | 11 | 871 | 6,268,515 | 35,215,397 | -- |
| 1991 | AZ CA CO FL IA IL MA NJ PA WA WI | 11 | 859 | 6,156,188 | 35,036,492 | -- |
| 1992 | AZ CA CO FL IA IL MA NJ PA WA WI | 11 | 856 | 6,195,744 | 35,011,385 | -- |
| 1993 | AZ CA CO CT FL IA IL KS MA MD NJ NY OR PA SC WA WI | 17 | 913 | 6,538,976 | 34,715,985 | 33,736,753 |
| 1994 | AZ CA CO CT FL IA IL KS MA MD NJ NY OR PA SC WA WI | 17 | 904 | 6,385,011 | 34,622,203 | 33,149,768 |
| 1995 | AZ CA CO CT FL IA IL KS MA MD MO NJ NY OR PA SC TN WA WI | 19 | 938 | 6,714,935 | 34,791,998 | 33,647,121 |
| 1996 | AZ CA CO CT FL IA IL KS MA MD MO NJ NY OR PA SC TN WA WI | 19 | 906 | 6,542,069 | 34,874,386 | 33,386,097 |
| 1997 | AZ CA CO CT FL GA HI IA IL KS MA MD MO NJ NY OR PA SC TN UT WA WI | 22 | 1,012 | 7,148,420 | 35,408,207 | 33,232,257 |
| 1998 | AZ CA CO CT FL GA HI IA IL KS MA MD MO NJ NY OR PA SC TN UT WA WI | 22 | 984 | 6,827,350 | 34,874,001 | 33,923,632 |
| 1999 | AZ CA CO CT FL GA HI IA IL KS MA MD ME MO NJ NY OR PA SC TN UT VA WA WI | 24 | 984 | 7,198,929 | 35,467,673 | 34,440,994 |
| 2000 | AZ CA CO CT FL GA HI IA IL KS KY MA MD ME MO NC NJ NY OR PA SC TN TX UT VA WA WI WV | 28 | 994 | 7,450,992 | 36,417,565 | 35,300,425 |
| 2001 | AZ CA CO CT FL GA HI IA IL KS KY MA MD ME MI MN MO NC NE NJ NY OR PA RI SC TN TX UT VA VT WA WI WV | 33 | 986 | 7,452,727 | 37,187,641 | 36,093,550 |
| 2002 | CA CO CT FL GA HI IA IL KS KY MA MD ME MI MN MO NC NE NJ NV NY OH OR PA RI SC SD TN TX UT VA VT WA WI WV | 35 | 995 | 7,853,982 | 37,804,021 | 36,523,831 |
| 2003 | AZ CA CO CT FL GA HI IA IL IN KS KY MA MD MI MN MO NC NE NH NJ NV NY OH OR PA RI SC SD TN TX UT VA VT WA WI WV | 37 | 994 | 7,977,728 | 38,220,659 | 37,074,605 |
| 2004 | AR AZ CA CO CT FL GA HI IA IL IN KS KY MA MD MI MN MO NC NE NH NJ NV NY OH OR RI SC SD TN TX UT VA VT WA WI WV | 37 | 1,004 | 8,004,571 | 38,661,786 | 37,496,978 |
| 2005 | AR AZ CA CO CT FL GA HI IA IL IN KS KY MA MD MI MN MO NC NE NH NJ NV NY OH OK OR RI SC SD TN TX UT VT WA WI WV | 37 | 1,054 | 7,995,048 | 39,163,834 | 37,843,039 |
| 2006 | AR AZ CA CO CT FL GA HI IA IL IN KS KY MA MD MI MN MO NC NE NH NJ NV NY OH OK OR RI SC SD TN TX UT VA VT WA WI WV | 38 | 1,045 | 8,074,825 | 39,450,216 | 38,076,556 |
| 2007 | AR AZ CA CO CT FL GA HI IA IL IN KS KY MA MD ME MI MN MO NC NE NH NJ NV NY OH OK OR RI SC SD TN TX UT VA VT WA WI WV WY | 40 | 1,044 | 8,043,415 | 39,541,948 | 38,155,908 |
| 2008 | AR AZ CA CO CT FL GA HI IA IL IN KS KY LA MA MD ME MI MN MO NC NE NH NJ NV NY OH OK OR PA RI SC SD TN TX UT VA VT WA WI WV WY | 42 | 1,056 | 8,158,381 | 39,885,120 | 38,210,889 |
| 2009 | AR AZ CA CO CT FL GA HI IA IL IN KS KY LA MA MD ME MI MN MO MT NC NE NH NJ NM NV NY OH OK OR PA RI SC SD TN TX UT VA VT WA WI WV WY | 44 | 1,050 | 7,810,762 | 39,434,956 | 37,734,584 |
| 2010 | AK AR AZ CA CO CT FL GA HI IA IL IN KS KY LA MA MD ME MI MN MO MS MT NC NE NJ NM NV NY OH OK OR PA RI SC SD TN TX UT VA VT WA WI WV WY | 45 | 1,051 | 7,800,441 | 39,008,298 | 37,352,013 |
| 2011 | AK AR AZ CA CO CT FL GA HI IA IL IN KS KY LA MA MD ME MI MN MO MS MT NC ND NE NJ NM NV NY OH OK OR PA RI SC SD TN TX UT VA VT WA WI WV WY | 46 | 1,049 | 8,023,590 | 38,590,733 | 36,962,415 |
| 2012 | AK AR AZ CA CO CT FL GA HI IA IL IN KS KY LA MA MD MI MN MO MT NC ND NE NJ NM NV NY OH OK OR PA RI SC SD TN TX UT VA VT WA WI WV WY | 44 | 4,378 | 7,296,968 | 36,484,846 | N/A |
| 2013 | AR AZ CA CO CT DC FL GA HI IA IL IN KS KY LA MA MD MI MN MO MT NC ND NE NJ NM NV NY OH OK OR PA RI SC SD TN TX UT VA VT WA WI WV WY | 44 | 4,363 | 7,119,563 | 35,597,792 | N/A |
| 2014 | AR AZ CA CO CT DC FL GA HI IA IL IN KS KY LA MA MD ME MI MN MO MT NC ND NE NJ NM NV NY OH OK OR PA RI SC SD TN TX UT VA VT WA WI WV WY | 45 | 4,411 | 7,071,762 | 35,358,818 | N/A |
| Number of Hospitals and Discharges in 2014 Universe, Frame, and NIS, by Census Division | ||||||||
|---|---|---|---|---|---|---|---|---|
| Universe | Frame | NIS | ||||||
| Census Region | Census Division | Hospitals | Discharges | Hospitals | Discharges | Hospitals | Discharges | Weighted Discharges |
| Northeast | New England | 187 | 1,626,694 | 157 | 1,490,529 | 156 | 325,338 | 1,626,694 |
| Northeast | Middle Atlantic | 448 | 4,997,003 | 446 | 4,987,918 | 446 | 999,401 | 4,997,003 |
| Northeast | Subtotal | 635 | 6,623,697 | 603 | 6,478,447 | 602 | 1,324,739 | 6,623,697 |
| Midwest | East North Central | 752 | 5,491,899 | 735 | 5,456,766 | 735 | 1,098,380 | 5,491,899 |
| Midwest | West North Central | 687 | 2,451,014 | 645 | 2,424,992 | 644 | 490,204 | 2,451,014 |
| Midwest | Subtotal | 1,439 | 7,942,913 | 1,380 | 7,881,758 | 1,379 | 1,588,584 | 7,942,913 |
| South | South Atlantic | 725 | 7,211,065 | 714 | 7,091,524 | 714 | 1,442,211 | 7,211,065 |
| South | East South Central | 401 | 2,423,423 | 198 | 1,241,229 | 198 | 484,683 | 2,423,423 |
| South | West South Central | 781 | 4,139,760 | 669 | 4,059,509 | 669 | 827,952 | 4,139,760 |
| South | Subtotal | 1,907 | 13,774,248 | 1,581 | 12,392,262 | 1,581 | 2,754,846 | 13,774,248 |
| West | Mountain | 388 | 2,185,671 | 332 | 2,037,734 | 331 | 437,135 | 2,185,671 |
| West | Pacific | 540 | 4,832,289 | 519 | 4,731,261 | 518 | 966,458 | 4,832,289 |
| West | Subtotal | 928 | 7,017,960 | 851 | 6,768,995 | 849 | 1,403,593 | 7,017,960 |
| Total | Total | 4,909 | 35,358,818 | 4,415 | 33,521,462 | 4,411 | 7,071,762 | 35,358,818 |
Description of the NIS Database
|
Information on the Redesign of the NIS in 2012
|
| Location and Teaching Status | Hospital Bed Size | ||
|---|---|---|---|
| Small | Medium | Large | |
| NORTHEAST | |||
| Rural | 1 - 49 | 50 - 99 | 100+ |
| Urban, non-teaching | 1 - 124 | 125 - 199 | 200+ |
| Urban, teaching | 1 - 249 | 250 - 424 | 425+ |
| MIDWEST | |||
| Rural | 1 - 29 | 30 - 49 | 50+ |
| Urban, non-teaching | 1 - 74 | 75 - 174 | 175+ |
| Urban, teaching | 1 - 249 | 250 - 374 | 375+ |
| SOUTH | |||
| Rural | 1 - 39 | 40 - 74 | 75+ |
| Urban, non-teaching | 1 - 99 | 100 - 199 | 200+ |
| Urban, teaching | 1 - 249 | 250 - 449 | 450+ |
| WEST | |||
| Rural | 1 - 24 | 25 - 44 | 45+ |
| Urban, non-teaching | 1 - 99 | 100 - 174 | 175+ |
| Urban, teaching | 1 - 199 | 200 - 324 | 325+ |
Figure 1: Percentage of U.S. Population Covered in the 2014 NIS by Census Division and Region, Calculated using the Estimated U.S. Population on July 1, 2014
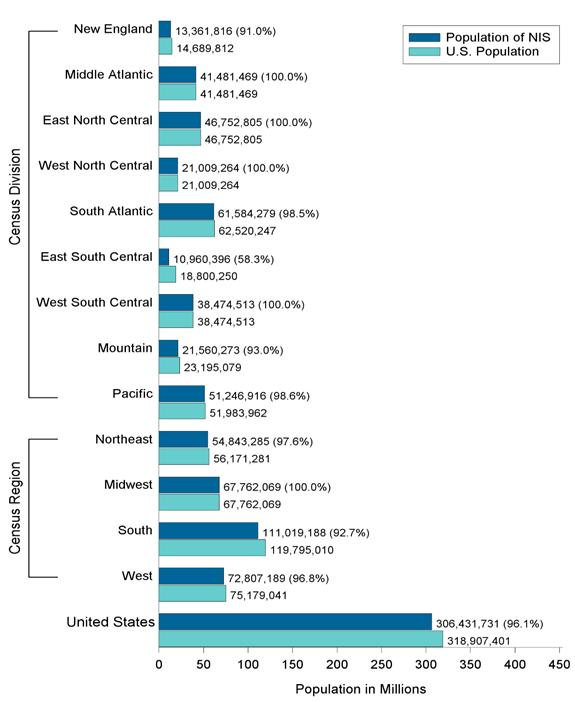
Source: Table 1. Annual Estimates of the Population for the United States, Regions, States, and Puerto Rico: April 1, 2010 to July 1, 2015 (NST-EST2015-01). Source: U.S. Census Bureau, Population Division. Release Date: December 2015.
Figure 2: NIS States, by Census Division
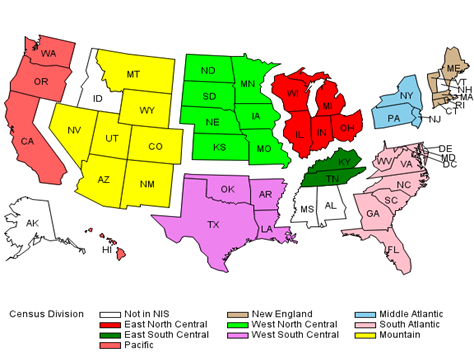
All States, by U.S Census Bureau Region and Census Division
Notes: New Hampshire participates in HCUP, but did not provide data in time for the 2010-2014 NIS. Mississippi participates in HCUP, but did not provide data in time for the 2012-2014 NIS.
Alaska participates in HCUP, but did not provide data in time for the 2013-2014 NIS.
States and areas in italics do not participate in HCUP.
a Prior to June 1984, the Midwest Region was designated as the North Central Region.
Source: U.S. Census Bureau. Census Bureau Regions and Divisions with State FIPS Codes. http://www2.census.gov/geo/pdfs/maps-data/maps/reference/us_regdiv.pdf. Accessed August 8, 2015.
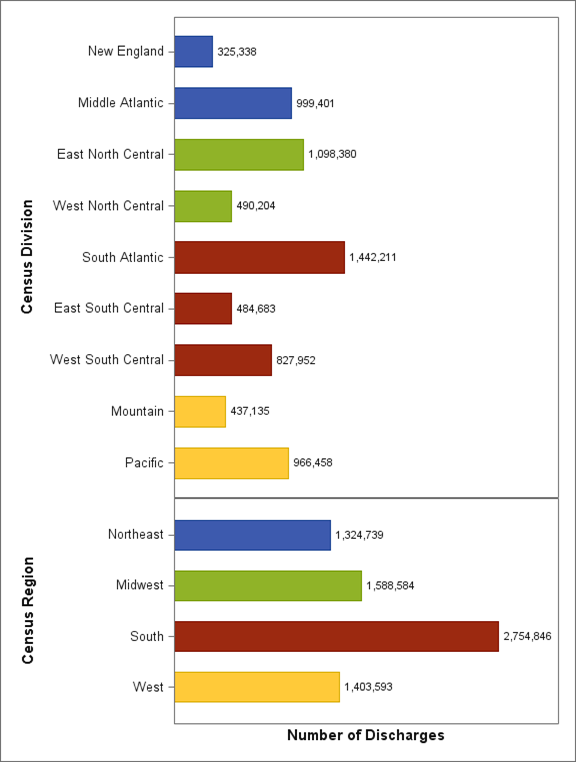
Figure 3: Number of Discharges (in Thousands) in 2014 NIS by Census Division and Census Region
APPENDIX II: STATE-SPECIFIC RESTRICTIONS
The table below enumerates the types of restrictions applied to the National Inpatient Sample. Restrictions include the following types:
| Confidentiality of Records — Restricted Release of Age in Years |
|---|
|
| Missing Discharges |
|---|
|
APPENDIX III: DATA ELEMENTS
Table 1: Data Elements in the 2014 NIS Inpatient Core Files
For prior years, refer to the Availability of NIS Data Elements by Year table on the NIS Database Documentation page on HCUP-US website or to previous versions of the NIS Introduction.
| Type of Data Element | HCUP Name | Coding Notes |
|---|---|---|
| Admission information | ||
| Admission day | AWEEKEND | Admission on weekend: (0) admission on Monday-Friday, (1) admission on Saturday-Sunday |
| Admission month | AMONTH | Admission month coded from (1) January to (12) December |
| Transferred into hospital | TRAN_IN | Transfer In Indicator: (0) not a transfer, (1) transferred in from a different acute care hospital [ATYPE NE 4 & (ASOURCE=2 or POO=4)], (2) transferred in from another type of health facility [ATYPE NE 4 & (ASOURCE=3 or POO=5, 6)] |
| Indicator of emergency department service | HCUP_ED | Indicator that discharge record includes evidence of emergency department (ED) services: (0) Record does not meet any HCUP Emergency Department criteria, (1) Emergency Department revenue code on record, (2) Positive Emergency Department charge (when revenue center codes are not available), (3) Emergency Department CPT procedure code on record, (4) Admission source of ED, (5) State-defined ED record; no ED charges available |
| Admission type | ELECTIVE | Indicates elective admission: (1) elective, (0) non-elective admission |
| Patient demographic and location information | ||
| Age at admission | AGE | Age in years coded 0-124 years |
| AGE_NEONATE | Neonatal age (first 28 days after birth) indicator: (0) non-neonatal age (1) neonatal age | |
| Sex of patient | FEMALE | Indicates sex for NIS beginning in 1998: (0) male, (1) female |
| Race of patient | RACE | Race, uniform coding: (1) white, (2) black, (3) Hispanic, (4) Asian or Pacific Islander, (5) Native American, (6) other (For 2014, Race contains missing values on about 6% of the records.)> |
| Location of patient's residence | PL_NCHS | Patient Location: NCHS Urban-Rural Code. This is a six-category urban-rural classification scheme for U.S. counties: (1) "Central" counties of metro areas of >=1 million population, (2) "Fringe" counties of metro areas of >=1 million population, (3) Counties in metro areas of 250,000-999,999 population, (4) Counties in metro areas of 50,000-249,999 population, (5) Micropolitan counties, (6) Not metropolitan or micropolitan counties |
| Median household income for patient's ZIP Code | ZIPINC_QRTL | Median household income quartiles for patient's ZIP Code. For 2008, the median income quartiles are defined as: (1) $1 - $38,999; (2) $39,000 - $47,999; (3) $48,000 - 62,999; and (4) $63,000 or more. |
| Payer information | ||
| Primary expected payer | PAY1 | Expected primary payer, uniform: (1) Medicare, (2) Medicaid, (3) private including HMO, (4) self-pay, (5) no charge, (6) other |
| Diagnosis and procedure information | ||
| ICD-9-CM diagnoses | DX1 - DX30 | Diagnoses, principal and secondary (ICD-9-CM). Beginning in 2003, the diagnosis array does not include any external cause of injury codes. These codes have been stored in a separate array ECODEn. The number of diagnoses and associated data elements was increased from 15 to 25 beginning with 2009 data, and from 25 to 30 beginning with 2014 data. |
| NDX | Number of diagnoses coded on the record | |
| External causes of injury and poisoning | ECODE1 - ECODE4 | External cause of injury and poisoning code, primary and secondary (ICD-9-CM). Beginning in 2003, external cause of injury codes are stored in a separate array ECODEn from the diagnosis codes in the array DXn. Prior to 2003, these codes are contained in the diagnosis array (DXn). |
| NECODE | Number of external cause of injury codes on the record. A maximum of 4 codes are retained on the NIS. | |
| ICD-9-CM procedures | PR1 - PR15 | Procedures, principal and secondary (ICD-9-CM) |
| NPR | Number of procedures coded on the record | |
| PRDAY1 | Number of days from admission to principal procedure. | |
| PRDAY2 - PRDAY15 | Number of days from admission to secondary procedures | |
| DRG information | ||
| Diagnosis Related Group (DRG) | DRG | DRG in use on discharge date |
| DRG_NoPOA | DRG in use on discharge date, calculated without Present On Admission (POA) indicators | |
| DRGVER | Grouper version in use on discharge date | |
| DRG24 | DRG Version 24 (effective October 2006 - September 2007) | |
| Major Diagnosis Category (MDC) | MDC | MDC in use on discharge date |
| MDC_noPOA | MDC in use on discharge date, calculated without Present on Admission (POA) indicators | |
| MDC24 | MDC Version 24 (effective October 2006 - September 2007) | |
| Other data elements derived from ICD-9-CM codes
see also: Table 3, Data Elements in the NIS Disease Severity Measures File and Table 4, Data Elements in the NIS Diagnosis and Procedures Groups File | ||
| Clinical Classifications Software (CCS) category | DXCCS1 - DXCCS30 | Clinical Classifications Software (CCS) category for all diagnoses for NIS beginning in 1998. The number of diagnoses and associated data elements was increased from 15 to 25 beginning with 2009 data, and from 25 to 30 beginning with 2014 data. |
| E_CCS1 - E_CCS4 | CCS category for the external cause of injury and poisoning codes | |
| PRCCS1 - PRCCS15 | CCS category for all procedures for NIS beginning in 1998 | |
| Number of chronic conditions | NCHRONIC | Count of chronic conditions in the diagnosis vector |
| Operating room procedure indicator | ORPROC | Major operating room procedure indicator for the record: (0) no major operating room procedure, (1) major operating room procedure |
| Neonatal / maternal flag | NEOMAT | Assigned from diagnoses and procedure codes: (0) not maternal or neonatal, (1) maternal diagnosis or procedure, (2) neonatal diagnosis, (3) maternal and neonatal on same record |
| Indicates in-hospital birth | HOSPBRTH | Indicator that discharge record includes diagnosis of birth that occurred in the hospital: (0) Not an in-hospital birth, (1) In-hospital birth |
| Hospitalization type (service line) | SERVICELINE | All discharges are categorized into five hospitalization types (i.e., service lines) in the following hierarchical order: (1) maternal/neonatal, (2) mental health/substance abuse, (3) injury, (4) surgical, and (5) medical. |
| Resource use information | ||
| Total charges | TOTCHG | Total charges, edited |
| Length of stay | LOS | Length of stay, edited |
| Discharge information | ||
| Discharge quarter | DQTR | Coded: (1) First quarter, Jan - Mar, (2) Second quarter, Apr - Jun, (3) Third quarter, Jul - Sep, (4) Fourth quarter, Oct - Dec |
| Discharge year | YEAR | Calendar year |
| Disposition of patient (discharge status) | DIED | Indicates in-hospital death: (0) did not die during hospitalization, (1) died during hospitalization |
| DISPUNIFORM | Disposition of patient, uniform coding used beginning in 1998: (1) routine, (2) transfer to short-term hospital, (5) other transfers, including skilled nursing facility, intermediate care, and another type of facility, (6) home healthcare, (7) against medical advice, (20) died in hospital, (99) discharged alive, destination unknown | |
| TRAN_OUT | Transfer Out Indicator: (0) not a transfer, (1) transferred out to a different acute care hospital, (2) transferred out to another type of health facility | |
| Weights (to calculate national estimates) | ||
| Discharge weights (weights for 1988-1993 are on Hospital Weights file) | DISCWT | Discharge weight on Core file and Hospital Weights file for NIS beginning in 1998. In all data years except 2000, this weight is used to create national estimates for all analyses. In 2000 only, this weight is used to create national estimates for all analyses, excluding those that involve total charges. |
| Hospital information | ||
| Hospital identifiers (encrypted) | HOSP_NIS | NIS hospital number (links to Hospital Weights file; does not link to previous years) |
| Hospital location | HOSP_DIVISION | Census Division of hospital (STRATA): (1) New England, (2) Middle Atlantic, (3) East North Central, (4) West North Central, (5) South Atlantic, (6) East South Central, (7) West South Central, (8) Mountain, (9) Pacific |
| Hospital stratifier | NIS_STRATUM | Stratum used to sample hospitals, based on geographic region, control, location/teaching status, and bed size. Stratum information is also contained in the Hospital Weights file. |
| Record identifier, synthetic | KEY_NIS | Unique record number for file beginning in 2012 |
Table 2: Data Elements in the 2014 NIS Hospital Weights Files
For prior years, refer to the Availability of NIS Data Elements by Year table on the NIS Database Documentation page on HCUP-US website or to previous versions of the NIS Introduction.
| Type of Data Element | HCUP Name | Coding Notes |
|---|---|---|
| Discharge counts | N_DISC_U | Number of universe discharges in the stratum |
| S_DISC_U | Number of sampled discharges in the sampling stratum (NIS_STRATUM or STRATUM) | |
| TOTAL_DISC | Total number of discharges from this hospital in the NIS | |
| Discharge weights | DISCWT | Discharge weight used in the NIS beginning in 1998. In all data years except 2000, this weight is used to create national estimates for all analyses. In 2000 only, this weight is used to create national estimates for all analyses, excluding those that involve total charges. |
| Discharge Year | YEAR | Discharge year |
| N_HOSP_U | Number of universe hospitals in the stratum | |
| S_HOSP_U | Number of sampled hospitals in the stratum (NIS_STRATUM or STRATUM) | |
| Hospital identifiers | HOSP_NIS | NIS hospital number (links to Hospital Weights file; does not link to previous years) |
| Hospital characteristics | HOSP_BEDSIZE | Bed size of hospital (STRATA): (1) small, (2) medium, (3) large |
| H_CONTRL | Control/ownership of hospital: (1) government, nonfederal, (2) private, non-profit, (3) private, investor-own | |
| HOSP_LOCTEACH | Location/teaching status of hospital (STRATA): (1) rural, (2) urban non-teaching, (3) urban teaching | |
| HOSP_REGION | Region of hospital (STRATA): (1) Northeast, (2) Midwest, (3) South, (4) West | |
| HOSP_DIVISION | Census Division of hospital (STRATA): (1) New England, (2) Middle Atlantic, (3) East North Central, (4) West North Central, (5) South Atlantic, (6) East South Central, (7) West South Central, (8) Mountain, (9) Pacific | |
| NIS_STRATUM | Stratum used to sample hospitals beginning in 1998; includes geographic region, control, location/teaching status, and bed size |
Table 3: Data Elements in the 2014 NIS Disease Severity Measures Files
For prior years, refer to the Availability of NIS Data Elements by Year table on the NIS Database Documentation page on HCUP-US website or to previous versions of the NIS Introduction.
| Type of Data Element | HCUP Name | Coding Notes |
|---|---|---|
| AHRQ Comorbidity Software (AHRQ) | CM_AIDS | AHRQ comorbidity measure: Acquired immune deficiency syndrome : (0) Comorbidity is not present, (1) Comorbidity is present |
| CM_ALCOHOL | AHRQ comorbidity measure: Alcohol abuse: (0) Comorbidity is not present, (1) Comorbidity is present | |
| CM_ANEMDEF | AHRQ comorbidity measure: Deficiency anemias : (0) Comorbidity is not present, (1) Comorbidity is present | |
| CM_ARTH | AHRQ comorbidity measure: Rheumatoid arthritis/ collagen vascular diseases : (0) Comorbidity is not present, (1) Comorbidity is present | |
| CM_BLDLOSS | AHRQ comorbidity measure: Chronic blood loss anemia: (0) Comorbidity is not present, (1) Comorbidity is present | |
| CM_CHF | AHRQ comorbidity measure: Congestive heart failure: (0) Comorbidity is not present, (1) Comorbidity is present | |
| CM_CHRNLUNG | AHRQ comorbidity measure: Chronic pulmonary disease: (0) Comorbidity is not present, (1) Comorbidity is present | |
| CM_COAG | AHRQ comorbidity measure: Coagulopathy: (0) Comorbidity is not present, (1) Comorbidity is present | |
| CM_DEPRESS | AHRQ comorbidity measure: Depression: (0) Comorbidity is not present, (1) Comorbidity is present | |
| CM_DM | AHRQ comorbidity measure: Diabetes, uncomplicated: (0) Comorbidity is not present, (1) Comorbidity is present | |
| CM_DMCX | AHRQ comorbidity measure: Diabetes with chronic complications: (0) Comorbidity is not present, (1) Comorbidity is present | |
| CM_DRUG | AHRQ comorbidity measure: Drug abuse: (0) Comorbidity is not present, (1) Comorbidity is present | |
| CM_HTN_C | AHRQ comorbidity measure: Hypertension, (combine uncomplicated and complicated): (0) Comorbidity is not present, (1) Comorbidity is present | |
| CM_HYPOTHY | AHRQ comorbidity measure: Hypothyroidism: (0) Comorbidity is not present, (1) Comorbidity is present | |
| CM_LIVER | AHRQ comorbidity measure: Liver disease: (0) Comorbidity is not present, (1) Comorbidity is present | |
| CM_LYMPH | AHRQ comorbidity measure: Lymphoma : (0) Comorbidity is not present, (1) Comorbidity is present | |
| CM_LYTES | AHRQ comorbidity measure: Fluid and electrolyte disorders: (0) Comorbidity is not present, (1) Comorbidity is present | |
| CM_METS | AHRQ comorbidity measure: Metastatic cancer: (0) Comorbidity is not present, (1) Comorbidity is present | |
| CM_NEURO | AHRQ comorbidity measure: Other neurological disorders: (0) Comorbidity is not present, (1) Comorbidity is present | |
| CM_OBESE | AHRQ comorbidity measure: Obesity: (0) Comorbidity is not present, (1) Comorbidity is present | |
| CM_PARA | AHRQ comorbidity measure: Paralysis: (0) Comorbidity is not present, (1) Comorbidity is present | |
| CM_PERIVASC | AHRQ comorbidity measure: Peripheral vascular disorders: (0) Comorbidity is not present, (1) Comorbidity is present | |
| CM_PSYCH | AHRQ comorbidity measure: Psychoses: (0) Comorbidity is not present, (1) Comorbidity is present | |
| CM_PULMCIRC | AHRQ comorbidity measure: Pulmonary circulation disorders: (0) Comorbidity is not present, (1) Comorbidity is present | |
| CM_RENLFAIL | AHRQ comorbidity measure: Renal failure: (0) Comorbidity is not present, (1) Comorbidity is present | |
| CM_TUMOR | AHRQ comorbidity measure: Solid tumor without metastasis : (0) Comorbidity is not present, (1) Comorbidity is present | |
| CM_ULCER | AHRQ comorbidity measure: Peptic ulcer disease excluding bleeding: (0) Comorbidity is not present, (1) Comorbidity is present | |
| CM_VALVE | AHRQ comorbidity measure: Valvular disease: (0) Comorbidity is not present, (1) Comorbidity is present | |
| CM_WGHTLOSS | AHRQ comorbidity measure: Weight loss: (0) Comorbidity is not present, (1) Comorbidity is present | |
| All Patient Refined DRG (3M) | APRDRG | All Patient Refined DRG |
| APRDRG_Risk_Mortality | All Patient Refined DRG: Risk of Mortality Subclass: (0) No class specified, (1) Minor likelihood of dying, (2) Moderate likelihood of dying, (3) Major likelihood of dying, (4) Extreme likelihood of dying | |
| APRDRG_Severity | All Patient Refined DRG: Severity of Illness Subclass: (0) No class specified, (1) Minor loss of function (includes cases with no comorbidity or complications), (2) Moderate loss of function, (3) Major loss of function, (4)Extreme loss of function | |
| Linkage Data Elements | HOSP_NIS | NIS hospital number (links to Hospital Weights file; does not link to previous years) |
| KEY_NIS | Unique record number for file beginning in 2012 |
Table 4: Data Elements in the 2014 NIS Diagnosis and Procedure Groups Files
For prior years, refer to the Availability of NIS Data Elements by Year table on the NIS Database Documentation page on HCUP-US website or to previous versions of the NIS Introduction.
| Type of Data Element | HCUP Name | Coding Notes |
|---|---|---|
| Chronic Condition Indicator | CHRON1 - CHRON30 | Chronic condition indicator for all diagnoses: (0) non-chronic condition, (1) chronic condition. The number of diagnoses and associated data elements was increased from 15 to 25 beginning with 2009 data, and from 25 to 30 beginning with 2014 data. |
| BODYSYSTEM1 - BDYSYSTEM30 (formerly CHRONB1-CHRONB25) | Body system indicator for all diagnoses: (1) Infectious and parasitic disease, (2) Neoplasms, (3) Endocrine, nutritional, and metabolic diseases and immunity disorders, (4) Diseases of blood and blood-forming organs, (5) Mental disorders, (6) Diseases of the nervous system and sense organs, (7) Diseases of the circulatory system, (8) Diseases of the respiratory system, (9) Diseases of the digestive system, (10) Diseases of the genitourinary system, (11) Complications of pregnancy, childbirth, and the puerperium, (12) Diseases of the skin and subcutaneous tissue, (13) Diseases of the musculoskeletal system, (14) Congenital anomalies, (15) Certain conditions originating in the perinatal period, (16) Symptoms, signs, and ill-defined conditions, (17) Injury and poisoning, (18) Factors influencing health status and contact with health services. The number of diagnoses and associated data elements was increased from 15 to 25 beginning with 2009 data, and from 25 to 30 beginning with 2014 data. CHRONBn was renamed to BODYSYSTEMn beginning with 2014 data. |
|
| Multi-Level Clinical Classifications Software (CCS) Category | DXMCCS1 | Multi-level clinical classification software (CCS) for principal diagnosis. Four levels for diagnoses presenting both the general groupings and very specific conditions |
| E_MCCS1 | Multi-level clinical classification software (CCS) for first listed E Code. Four levels for E codes presenting both the general groupings and very specific conditions | |
| PRMCCS1 | Multi-level clinical classification software (CCS) for principal procedure. Three levels for procedures presenting both the general groupings and very specific conditions | |
| Procedure Class | PCLASS1 - PCLASS15 | Procedure Class for all procedures: (1) Minor Diagnostic, (2) Minor Therapeutic, (3) Major Diagnostic, (4) Major Therapeutic |
| Linkage Data Elements | HOSP_NIS | NIS hospital number (links to Hospital Weights file; does not link to previous years) |
| KEY_NIS | Unique record number for file beginning in 2012 |
APPENDIX IV: TEACHING HOSPITAL INDICATOR ASSIGNMENT
We used the following American Hospital Association Annual Survey Database (Health Forum, LLC © 2016) data elements to assign the NIS Teaching Hospital Indicator:
AHA Data Element Name = Description [HCUP Data Element Name].
BDH = Number of short-term hospital beds [B001H].
BDTOT = Number of total facility beds [B001].
FTRES = Number of full-time employees: interns & residents (medical & dental) [E125].
PTRES = Number of part-time employees: interns & residents (medical & dental) [E225].
MAPP8 = Council of Teaching Hospitals (COTH) indicator [A101].
MAPP3 = Residency training approval by the Accreditation Council for Graduate Medical Education (ACGME) [A102].
Beginning with the 1998 NIS, we used the following SAS code to assign the teaching hospital status indicator, HOSP_TEACH:
/*******************************************************/
/* FIRST ESTABLISH SHORT-TERM BEDS DEFINITION */
/*******************************************************/
IF BDH NE . THEN BEDTEMP = BDH ;      /* SHORT TERM BEDS */
ELSE IF BDH =. THEN BEDTEMP = BDTOT ; /* TOTAL BEDS PROXY */
/*******************************************************/
/* ESTABLISH IRB NEEDED FOR TEACHING STATUS */
/* BASED ON F-T P-T RESIDENT INTERN STATUS */
/*******************************************************/
IRB = (FTRES + .5*PTRES) / BEDTEMP ;
/*******************************************************/
/* CREATE TEACHING STATUS DATA ELEMENT */
/*******************************************************/
IF (MAPP8 EQ 1) OR (MAPP3 EQ 1) THEN HOSP_TEACH = 1 ;
ELSE IF (IRB GE 0.25) THEN HOSP_TEACH = 1 ;
ELSE HOSP_TEACH = 0 ;
1 See the AHA "community hospital designation" at http://www.ahadataviewer.com/glossary. ![]()
2 See, for example, van Buuren, S. (2012). Flexible Imputation of Missing Data. CRC Press, Boca Raton, FL.
3 Prior to 1998, the discharge weight was named DISCWT_U. For 2000 only, use DISCWT to create national estimates for all analyses except those that involve total charges; and use DISCWTCHARGE to create national estimates of total charges.
4 Carlson BL, Johnson AE, Cohen SB. "An Evaluation of the Use of Personal Computers for Variance Estimation with Complex Survey Data." Journal of Official Statistics, vol. 9, no. 4, 1993: 795-814.
5 As of November 2016, this report had not been updated for the new NIS design; however the methods described are still valid.
6 However, researchers can still make estimates for census regions by aggregating census divisions.
7 Although discharge characteristics (DRG and admission month) are implicit stratifiers for sampling, they do not play a role in weighting.
| Internet Citation: 2014 Introduction to the NIS. Healthcare Cost and Utilization Project (HCUP). December 2016. Agency for Healthcare Research and Quality, Rockville, MD. hcup-us.ahrq.gov/db/nation/nis/NIS_Introduction_2014.jsp. |
| Are you having problems viewing or printing pages on this website? |
| If you have comments, suggestions, and/or questions, please contact hcup@ahrq.gov. |
| If you are experiencing issues related to Section 508 accessibility of information on this website, please contact hcup@ahrq.gov. |
| Privacy Notice, Viewers & Players |
| Last modified 12/14/16 |