STATISTICAL BRIEF #99
|
|
November 2010
Elizabeth Stranges, M.S., and Carol Stocks, R.N., M.H.S.A.
Introduction Potentially preventable hospitalizations—inpatient stays that might be avoided with the delivery of high quality outpatient treatment and disease management—serve as useful indicators of possible unmet community health needs.1 By measuring the frequency of such hospitalizations among patient subpopulations, policymakers and providers can identify those communities most in need of improvements in outpatient care as well as the conditions for which care is most needed. Rates of potentially preventable hospitalizations are higher for vulnerable populations with limited access to care.2 Targeting issues in access to primary care may serve to narrow disparities in health outcomes and improve the quality of care while reducing costs. This Statistical Brief presents data from the Healthcare Cost and Utilization Project (HCUP) on the characteristics of potentially preventable hospitalizations in 2008. The Agency for Healthcare Research and Quality (AHRQ)’s Prevention Quality Indicators (PQIs) were used to develop estimates of the number of potentially preventable hospitalizations for chronic and acute conditions in 2008. Rates of hospitalization for chronic conditions were based on admissions for diabetes, specific respiratory conditions, and specific circulatory conditions. Rates of hospitalization for acute conditions were based on admissions for dehydration, bacterial pneumonia, and urinary tract infections. The data presented here are observed admissions and are not risk-adjusted for age or sex. Findings General findings In 2008, one out of every ten hospital stays was for a potentially preventable condition; 3.9 percent of the 39.9 million inpatient discharges were for potentially preventable acute conditions and 6.2 percent were for potentially preventable chronic conditions (table 1). The majority of potentially preventable hospital stays were for patients ages 65 and older (2.4 million stays, 60 percent of all potentially preventable hospitalizations). Patients aged 45–64 accounted for 1.1 million potentially preventable stays (28 percent), and patients 18–44 accounted for the remainder (12 percent). |
|
Potentially preventable conditions accounted for about 10 percent of all hospitalizations for both males and females. However, males were more likely than females to be hospitalized for a potentially preventable chronic condition (6.8 percent of male stays, 5.8 percent of female stays) while males were less likely to be hospitalized for a potentially preventable acute condition (3.6 percent of male stays, 4.0 percent of female stays).
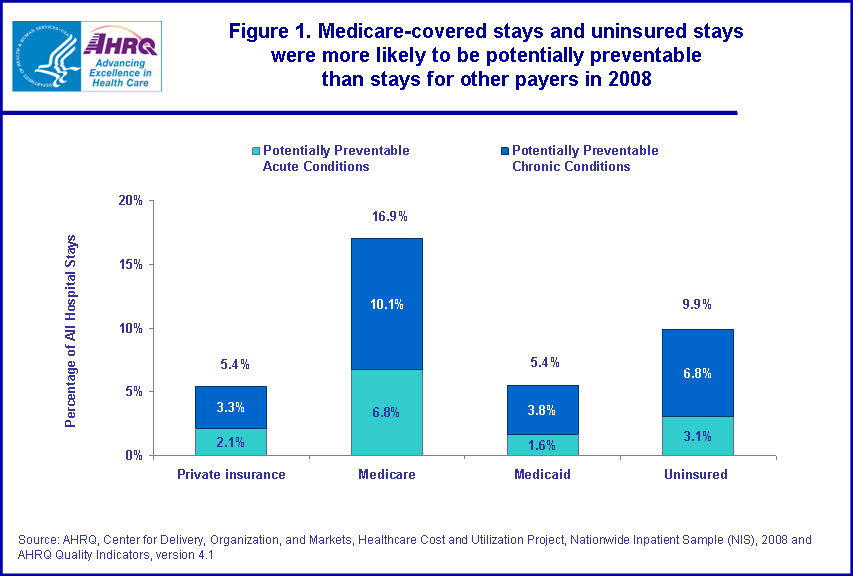
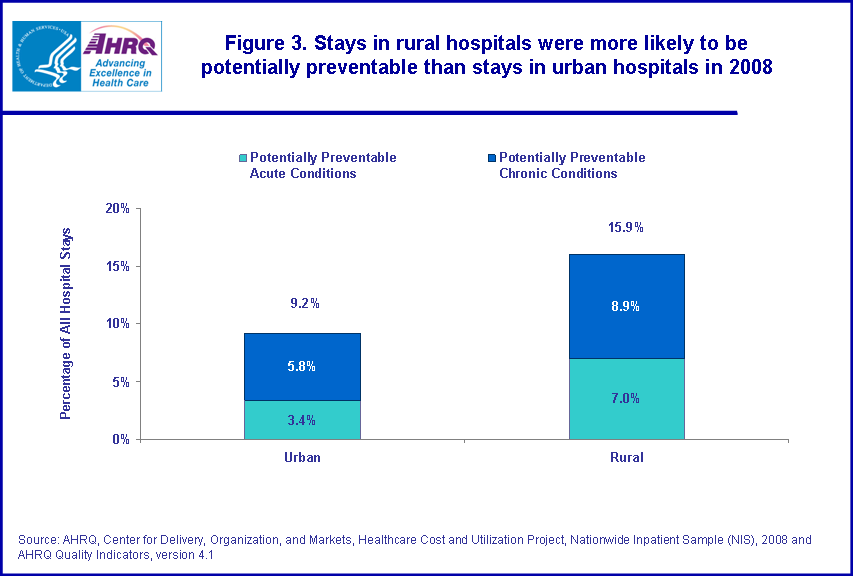
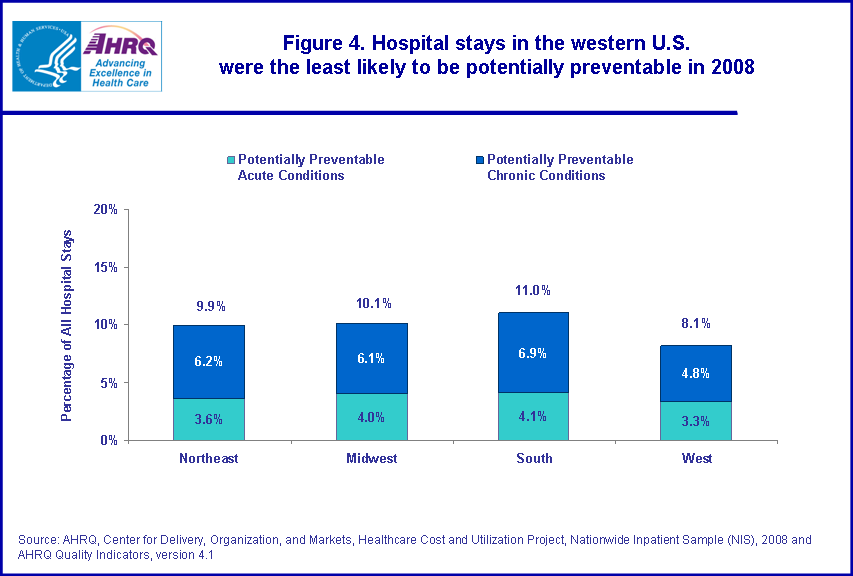
Stays for potentially preventable hospitalizations by payer, 2008 Hospital stays paid for by Medicare were over three times more likely to be potentially preventable than were stays paid for by private insurance or Medicaid. Uninsured stays were nearly twice as likely to be potentially preventable as privately insured or Medicaid-covered stays (figure 1). Potentially preventable chronic conditions accounted for 10.1 percent of Medicare stays, while potentially preventable acute conditions accounted for 6.8 percent. Roughly the same proportion of privately insured and Medicaid covered stays—one out of twenty—were potentially preventable. Chronic conditions accounted for slightly more preventable Medicaid stays (3.8 percent) than privately insured stays (3.3 percent) while acute conditions accounted for slightly fewer Medicaid stays (1.6 percent) than privately insured stays (2.1 percent). Potentially preventable conditions accounted for about one in ten uninsured hospital stays. Among uninsured stays, 6.8 percent of all stays were for potentially preventable chronic conditions and 3.1 percent of all stays were for potentially preventable acute conditions. Stays for potentially preventable hospitalizations by community income, 2008 Hospital stays for patients living in the poorest communities were more likely to be potentially preventable (11.7 percent potentially preventable) than were stays for patients living in the wealthiest communities (8.1 percent potentially preventable) (figure 2). In fact, across the four community income quartiles, as community income level increased, the share of potentially preventable hospital stays decreased. Potentially preventable stays for chronic conditions accounted for 7.5 percent of the hospitalizations among patients living in the poorest communities. In contrast, stays for these conditions accounted for only 4.8 percent of the hospitalizations among patients living in the wealthiest communities. Potentially preventable stays for acute conditions comprised 4.2 percent of hospitalizations among patients living in the poorest communities, a slightly larger portion than among patients living in the wealthiest communities (a 3.4 percent share). Stays for potentially preventable hospitalizations by hospital location, 2008 Potentially preventable conditions accounted for 9.2 percent of stays in urban hospitals but 15.9 percent of stays in rural hospitals (figure 3). Potentially preventable stays for acute conditions made up 3.4 percent of all urban hospital stays and 7.0 percent of all rural hospital stays while potentially preventable stays for chronic conditions made up 5.8 percent of urban hospital stays and 8.9 percent of rural hospital stays. Stays for potentially preventable hospitalizations by region, 2008 Hospitalizations in the West were less likely to be potentially preventable than were those in Northeast, Midwest, and South of the United States (figure 4). In the West, a total of 8.1 percent of all hospitalizations were potentially preventable: 4.8 percent of these stays were for chronic conditions and 3.3 percent were for acute conditions. In the Northeast, Midwest, and South, 10 percent of more of all hospital stays were potentially preventable. Data Source The estimates in this Statistical Brief are based upon data from the HCUP 2008 NIS. Definitions Types of hospitals included in HCUP HCUP is based on data from community hospitals, defined as short-term, non-Federal, general, and other hospitals, excluding hospital units of other institutions (e.g., prisons). HCUP data include OB-GYN, ENT, orthopedic, cancer, pediatric, public, and academic medical hospitals. They exclude long-term care, rehabilitation, psychiatric, and alcoholism and chemical dependency hospitals, but these types of discharges are included if they are from community hospitals. Unit of analysis The unit of analysis is the hospital discharge (i.e., the hospital stay), not a person or patient. This means that a person who is admitted to the hospital multiple times in one year will be counted each time as a separate "discharge" from the hospital. Prevention Quality Indicators The Prevention Quality Indicators (PQIs) are part of a set of AHRQ Quality Indicators (QIs) developed initially by investigators at Stanford University and the University of California under a contract with AHRQ. The PQIs are a set of measures that can be used with hospital inpatient discharge data to identify quality of care for "ambulatory care-sensitive conditions." These are conditions for which good outpatient care can potentially prevent the need for hospitalization or for which early intervention can prevent complications or more severe disease. PQI rates can also be affected by other factors, such as disease prevalence. In this report, only observed rates are used, not the risk-adjusted rates (i.e., for age and sex) which are used for area comparisons. The PQIs have been approved by the National Quality Forum and are maintained and updated by Batelle, Inc. under contract to AHRQ. Further information on the AHRQ QIs, including documentation and free software downloads, is available at http://www.qualityindicators.ahrq.gov/. This website includes information on the new version of the PQIs, Version 3.2. It also includes information on the new Pediatric Quality Indicators (PedQIs, formerly referred to as PDIs), which include the hospital admission rate measures for pediatric asthma and pediatric gastroenteritis. Median community-level income Median community-level income is the median household income of the patient’s ZIP Code of residence. The cut-offs for the quartile designation is determined using ZIP Code demographic data obtained from Claritas. The income quartile is missing for homeless and foreign patients. Payer Payer is the expected primary payer for the hospital stay. To make coding uniform across all HCUP data sources, payer combines detailed categories into more general groups:
Urban-rural hospital location Urban-rural location is one of six categories as defined by the National Center for Health Statistics:
Region Region is one of the four regions defined by the U.S. Census Bureau:
About HCUP HCUP is a family of powerful healthcare databases, software tools, and products for advancing research. Sponsored by the Agency for Healthcare Research and Quality (AHRQ), HCUP includes the largest all-payer encounter-level collection of longitudinal healthcare data (inpatient, ambulatory surgery, and emergency department) in the United States, beginning in 1988. HCUP is a Federal-State-Industry Partnership that brings together the data collection efforts of many organizations—such as State data organizations, hospital associations, private data organizations, and the Federal government—to create a national information resource. HCUP would not be possible without the contributions of the following data collection Partners from across the United States: Arizona Department of Health Services Arkansas Department of Health California Office of Statewide Health Planning and Development Colorado Hospital Association Connecticut Hospital Association Florida Agency for Health Care Administration Georgia Hospital Association Hawaii Health Information Corporation Illinois Department of Public Health Indiana Hospital Association Iowa Hospital Association Kansas Hospital Association Kentucky Cabinet for Health and Family Services Louisiana Department of Health and Hospitals Maine Health Data Organization Maryland Health Services Cost Review Commission Massachusetts Division of Health Care Finance and Policy Michigan Health & Hospital Association Minnesota Hospital Association Missouri Hospital Industry Data Institute Montana MHA — An Association of Montana Health Care Providers Nebraska Hospital Association Nevada Department of Health and Human Services New Hampshire Department of Health & Human Services New Jersey Department of Health and Senior Services New Mexico Health Policy Commission New York State Department of Health North Carolina Department of Health and Human Services Ohio Hospital Association Oklahoma State Department of Health Oregon Association of Hospitals and Health Systems Pennsylvania Health Care Cost Containment Council Rhode Island Department of Health South Carolina State Budget & Control Board South Dakota Association of Healthcare Organizations Tennessee Hospital Association Texas Department of State Health Services Utah Department of Health Vermont Association of Hospitals and Health Systems Virginia Health Information Washington State Department of Health West Virginia Health Care Authority Wisconsin Department of Health Services Wyoming Hospital Association About the NIS The HCUP Nationwide Inpatient Sample (NIS) is a nationwide database of hospital inpatient stays. The NIS is nationally representative of all community hospitals (i.e., short-term, non-Federal, non-rehabilitation hospitals). The NIS is a sample of hospitals and includes all patients from each hospital, regardless of payer. It is drawn from a sampling frame that contains hospitals comprising about 90 percent of all discharges in the United States. The vast size of the NIS allows the study of topics at both the national and regional levels for specific subgroups of patients. In addition, NIS data are standardized across years to facilitate ease of use. About the NHQR/DR The NHDR is an annual report, commissioned by Congress in 1999 and first published in 2003, which tracks disparities in healthcare delivery. Although the emphasis is on disparities related to race, ethnicity, and socioeconomic status (SES), this directive includes a charge to examine disparities in "priority populations"–groups with unique healthcare needs or issues that require special focus. The National Healthcare Disparities Report (NHDR) was designed and produced by AHRQ, with support from the Department of Health and Human Services (HHS) and private sector partners. For More Information For more information about HCUP, visit http://www.hcup-us.ahrq.gov. For additional HCUP statistics, visit HCUPnet, our interactive query system, at www.hcup.ahrq.gov. For information on other hospitalizations in the U.S., download HCUP Facts and Figures: Statistics on Hospital-based Care in the United States in 2008, located at http://www.hcup-us.ahrq.gov/reports.jsp. For a detailed description of HCUP, more information on the design of the NIS, and methods to calculate estimates, please refer to the following publications: Steiner, C., Elixhauser, A., Schnaier, J.The Healthcare Cost and Utilization Project: An Overview. Effective Clinical Practice 5(3):143–51, 2002. Introduction to the HCUP Nationwide Inpatient Sample, 2008. Online. May 2010. U.S. Agency for Healthcare Research and Quality. http://www.hcup-us.ahrq.gov/db/nation/nis/NIS_2008_INTRODUCTION.pdf. Suggested Citation Stranges, E., Stocks, C. Potentially Preventable Hospitalizations for Acute and Chronic Conditions, 2008. HCUP Statistical Brief #99. November 2010. Agency for Healthcare Research and Quality, Rockville, MD. http://www.hcup-us.ahrq.gov/reports/statbriefs/sb99.pdf. AHRQ welcomes questions and comments from readers of this publication who are interested in obtaining more information about access, cost, use, financing, and quality of healthcare in the United States. We also invite you to tell us how you are using this Statistical Brief and other HCUP data and tools, and to share suggestions on how HCUP products might be enhanced to further meet your needs. Please e-mail us at hcup@ahrq.gov or send a letter to the address below: Irene Fraser, Ph.D., Director Center for Delivery, Organization, and Markets Agency for Healthcare Research and Quality 540 Gaither Road Rockville, MD 20850 1 Prevention Quality Indicators Overview. AHRQ Quality Indicators. July 2004. Agency for Healthcare Research and Quality, Rockville, MD. www.qualityindicators.ahrq.gov/modules/pqi_resources.aspx#techspecs. Accessed October 27, 2021. 2 Epstein, A.J. "The role of public clinics in preventable hospitalizations among vulnerable populations." Health Services Research. 2001; 36(2): 405–420. |
| Table 1. Potentially preventable hospitalizations for acute and chronic conditions and all other hospitalizations, 2008 | ||||||
| Discharge Counts | Percentage Distribution | |||||
|---|---|---|---|---|---|---|
| Potentially Preventable Hospitalizations | All Other Stays | Potentially Preventable Hospitalizations | All Other Stays | |||
| Acute Conditions (PQI 91) | Chronic Conditions (PQI 92) | Acute Conditions (PQI 91) | Chronic Conditions (PQI 92) | |||
| Total U.S. | 1,535,900 | 2,462,500 | 35,886,800 | 3.9% | 6.2% | 90.0% |
| Patient characteristics: | ||||||
| Age groups | ||||||
| 18–44 years | 185,700 | 301,400 | 9,569,800 | 1.8% | 3.0% | 95.2% |
| 45–64 years | 340,700 | 765,300 | 8,400,200 | 3.6% | 8.1% | 88.4% |
| 65 and over | 1,009,500 | 1,395,800 | 11,555,300 | 7.2% | 10.0% | 82.8% |
| Sex | ||||||
| Male | 597,900 | 1,118,600 | 14,837,900 | 3.6% | 6.8% | 89.6% |
| Female | 938,000 | 1,343,900 | 21,048,900 | 4.0% | 5.8% | 90.2% |
| Median income of patient's ZIP Code | ||||||
| First quartile (poorest) | 475,600 | 846,400 | 9,994,100 | 4.2% | 7.5% | 88.3% |
| Second quartile | 445,400 | 703,900 | 9,811,800 | 4.1% | 6.4% | 89.5% |
| Third quartile | 328,200 | 506,600 | 8,266,200 | 3.6% | 5.6% | 90.8% |
| Fourth quartile (wealthiest) | 286,800 | 405,600 | 7,814,700 | 3.4% | 4.8% | 91.9% |
| Expected payment source | ||||||
| Private insurance | 302,000 | 461,200 | 13,368,700 | 2.1% | 3.3% | 94.6% |
| Medicare | 1,016,400 | 1,513,900 | 12,413,800 | 6.8% | 10.1% | 83.1% |
| Medicaid | 120,700 | 280,000 | 6,964,900 | 1.6% | 3.8% | 94.6% |
| Uninsured | 65,100 | 145,000 | 1,920,000 | 3.1% | 6.8% | 90.1% |
| Utilization characteristics: | ||||||
| Region | ||||||
| Northeast | 282,000 | 483,700 | 6,982,100 | 3.6% | 6.2% | 90.1% |
| Midwest | 372,300 | 558,000 | 8,278,100 | 4.0% | 6.1% | 89.9% |
| South | 624,100 | 1,048,700 | 13,508,600 | 4.1% | 6.9% | 89.0% |
| West | 257,600 | 372,100 | 7,118,000 | 3.3% | 4.8% | 91.9% |
| Location of hospital | ||||||
| Large central metro | 436,900 | 817,700 | 13,916,800 | 2.9% | 5.4% | 91.7 |
| Large fringe metro | 315,000 | 511,400 | 6,986,300 | 4.0% | 6.5% | 89.4% |
| Medium metro | 285,000 | 456,400 | 7,409,000 | 3.5% | 5.6% | 90.9% |
| Small metro | 142,500 | 221,800 | 3,289,300 | 3.9% | 6.1% | 90.0%% |
| Source: AHRQ, Center for Delivery, Organization, and Markets. Healthcare Cost and Utilization Project, Nationwide Inpatient Sample, 2008, and AHRQ Quality Indicators, version 4.1 | ||||||
|
Figure 1. Medicare-covered stays and uninsured stays were more likely to be potentially preventable than stays for other payers in 2008. Percentage of all hospital stays with private insurance; 5.4%; 3.3% had potentially preventable chronic conditions; 2.1% had potentially preventable acute conditions. Percentage of all hospital stays with Medicare; 16.9%; 10.1% had potentially preventable chronic conditions; 6.8% had potentially preventable acute conditions. Percentage of all hospital stays with Medicaid; 5.4%; 3.8% had potentially preventable chronic conditions; 1.6% had potentially preventable acute conditions. Percentage of all hospital stays with Uninsured; 9.9%; 6.8% had potentially preventable chronic conditions; 3.1% had potentially preventable acute conditions. Source: AHRQ, Center for Delivery, Organization, and Markets, Healthcare Cost and Utilization Project, Nationwide Inpatient Sample (NIS), 2008 and AHRQ Quality Indicators, version 4.1.
Figure 2. Patients from the poorest communities were most likely to have potentially
preventable hospital stays in 2008. Percentage of all hospital stays in the first quartile (poorest communities); 11.7%; 7.5% had potentially preventable chronic conditions; 4.2% had potentially preventable acute conditions. Percentage of all hospital stays in the second quartile; 10.5%; 6.4% had potentially preventable chronic conditions; 4.1% had potentially preventable acute conditions. Percentage of all hospital stays in the third quartile; 9.2%; 5.6% had potentially preventable chronic conditions; 3.6% had potentially preventable acute conditions. Percentage of all hospital stays in the fourth quartile (wealth communities); 8.1%*; 4.8% had potentially preventable chronic conditions; 3.4% had potentially preventable acute conditions. *Differences between sum and parts due to rounding.
Source: AHRQ, Center for Delivery, Organization, and Markets, Healthcare Cost and Utilization Project, Nationwide Inpatient Sample (NIS), 2008 and AHRQ Quality Indicators, version 4.1.
Figure 3. Stays in rural hospitals were more likely to be potentially preventable than stays in urban hospitals in 2008. Percentage of all hospital stays in urban hospitals; 9.2%; 5.8% had potentially preventable chronic conditions; 3.4% had potentially preventable acute conditions. Percentage of all hospital stays in rural hospitals; 15.9%; 8.9% had potentially preventable chronic conditions; 7.0% had potentially preventable acute conditions. Source: AHRQ, Center for Delivery, Organization, and Markets, Healthcare Cost and Utilization Project, Nationwide Inpatient Sample (NIS), 2008 and AHRQ Quality Indicators, version 4.1.
Figure 4. Hospital stays in the western U.S.
were the least likely to be potentially preventable in 2008. Percentage of all hospital stays in the Northeast; 9.9%; 6.2% had potentially preventable chronic conditions; 3.6% had potentially preventable acute conditions. Percentage of all hospital stays in the Midwest; 10.1%; 6.1% had potentially preventable chronic conditions; 4.0% had potentially preventable acute conditions. Percentage of all hospital stays in the South; 11.0%; 6.9% had potentially preventable chronic conditions; 4.1% had potentially preventable acute conditions. Percentage of all hospital stays in the West; 8.1%; 4.8% had potentially preventable chronic conditions; 3.3% had potentially preventable acute conditions. Source: AHRQ, Center for Delivery, Organization, and Markets, Healthcare Cost and Utilization Project, Nationwide Inpatient Sample (NIS), 2008 and AHRQ Quality Indicators, version 4.1.
|
| Internet Citation: Statistical Brief #99. Healthcare Cost and Utilization Project (HCUP). November 2010. Agency for Healthcare Research and Quality, Rockville, MD. hcup-us.ahrq.gov/reports/statbriefs/sb99.jsp. |
| Are you having problems viewing or printing pages on this website? |
| If you have comments, suggestions, and/or questions, please contact hcup@ahrq.gov. |
| If you are experiencing issues related to Section 508 accessibility of information on this website, please contact hcup@ahrq.gov. |
| Privacy Notice, Viewers & Players |
| Last modified 11/3/10 |