STATISTICAL BRIEF #98
|
|
October 2010
Anika Hines, Ph.D., M.P.H., Elizabeth Stranges, M.S., Roxanne M. Andrews, Ph.D.
Introduction Healthcare quality is a central feature of the American healthcare policy agenda. The enactment of the Affordable Care Act earlier this year has only intensified attention on this topic—promoting discourse among researchers, policy-makers, and consumers. Collectively, Americans have grown increasingly concerned about a healthcare system that ranks among the highest in annual expenditures for healthcare—equating to about 2.5 trillion dollars last year—but simultaneously experiences poorer health outcomes than other industrialized nations as well as persistent disparities among subgroups. Healthcare experts have outlined opportunities for quality improvement, emphasizing cross-cutting features such as value and equity.1 The Agency for Healthcare Research and Quality tracks the nation's healthcare quality through its annual National Healthcare Quality and Disparities Reports.2,3 Previous studies have demonstrated decreasing trends in risk-adjusted hospital mortality from various conditions,4 including acute myocardial infarction, congestive heart failure, pneumonia, and stroke in the hospital setting. Given that high mortality in some institutions may be associated with the quality of care rendered, measurement of risk-adjusted mortality rates serves as an indicator of quality. While hospital mortality trends are decreasing in the overall population, these aggregate estimates may mask differences among subpopulations. Having a clear understanding of trends in mortality among subgroups can lead to more targeted interventions towards the goal of producing an effective, efficient, and equitable healthcare system. This Statistical Brief presents data from the Healthcare Cost and Utilization Project (HCUP) on the rates of risk-adjusted inpatient mortality across subpopulations for the years 2000 and 2007. For this Statistical Brief, the Agency for Healthcare Research and Quality (AHRQ)’s Inpatient Quality Indicators (IQIs) are used to develop risk-adjusted in-hospital death rates among adults for four relatively frequent hospital conditions (acute myocardial infarction, congestive heart failure, pneumonia, and stroke).5 Risk-adjusted mortality rates are evaluated for the years 1994, 1997, and 2000 through 2007. All differences between estimates noted in the text are statistically significant at the 0.05 level or better. |
|
Findings
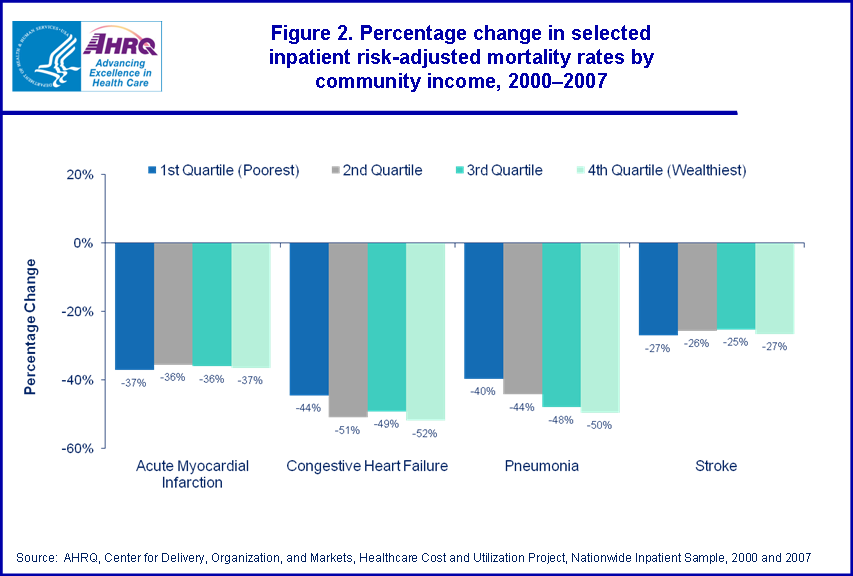
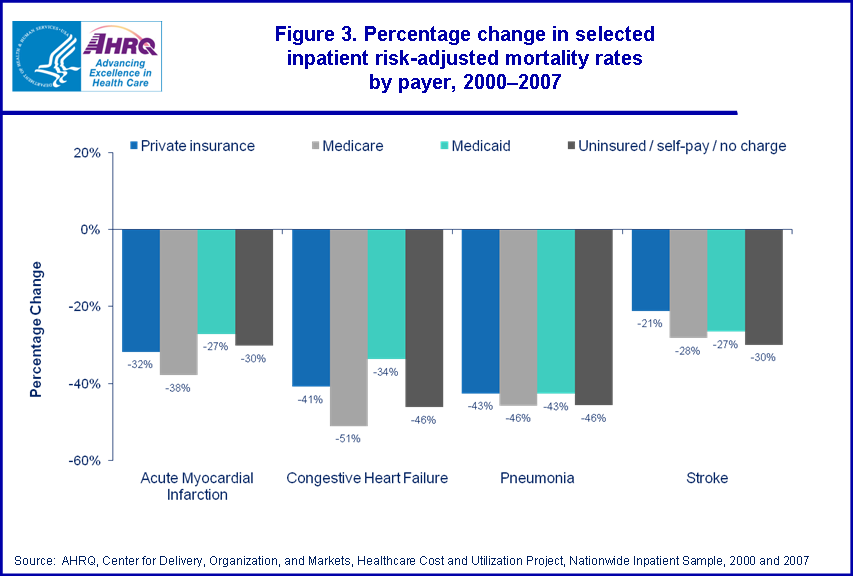
Between 1994 and 2007, national risk-adjusted mortality rates for acute myocardial infarction (AMI), congestive heart failure (CHF), pneumonia, and stroke decreased significantly (figure 1). Improvements in risk-adjusted mortality ranged from a 60 percent decrease among CHF inpatients (from 70 to 28 deaths per 1,000 admissions) to a 35 percent decrease among stroke inpatients (from 143 to 92 deaths per 1,000 admissions). Risk-adjusted mortality decreased by 55 percent among pneumonia inpatients (from 91 to 41 deaths per 1,000 admissions) and by 47 percent among AMI inpatients (from 128 to 67 deaths per 1,000 admissions). Table 1 details the national mortality rates for these conditions in 2000 and 2007; it also shows the mortality rates by selected patient characteristics. As shown in table 2, of the four conditions, congestive heart failure demonstrated the greatest decrease in mortality between 2000 and 2007, declining by 49 percent (from 55 deaths to 28 deaths per 1,000 admissions). In-hospital deaths for pneumonia decreased from 74 deaths to 41 deaths per 1,000 admissions (a 45 percent decrease) and AMI mortality declined from 106 deaths to 67 deaths per 1,000 admissions (a 36 percent decrease). The mortality rate for stroke changed less than those of the other three conditions, decreasing by 26 percent between 2000 and 2007 (from 125 deaths to 92 deaths per 1,000 admissions). Changes in inpatient risk-adjusted mortality for select diagnoses by patient subgroups, 2000–2007 Table 2 also displays changes in inpatient risk-adjusted mortality for the selected diagnostic conditions by age, sex, location of patient’s residence, and region. Between 2000 and 2007, in-hospital death rates for these diagnoses declined for all age categories, sexes, urban-rural locations, regions, community income levels, and primary payers. Changes in inpatient risk-adjusted mortality for select diagnoses by age and sex, 2000–2007 Decreases in risk-adjusted mortality between the years 2000 and 2007 were consistent across age groups for stroke and pneumonia. Inpatient mortality rates for AMI and congestive heart failure decreased faster for patients aged 65 years and older than for younger adults (aged 18–44 years), who exhibited overall lower death rates from these conditions in both 2000 and 2007. Rates of decrease between 2000 and 2007 were slower among women with congestive heart failure and stroke compared to men. While women experienced a 46 percent decrease in congestive heart failure mortality from 2000 to 2007, there was a 52 percent decrease for men. Similarly, while stroke mortality for women declined 24 percent, men experienced a 29 percent decrease. Changes in inpatient risk-adjusted mortality for select diagnoses by urban-rural location and region, 2000–2007 In general, inpatient mortality rates declined more rapidly for patients residing in suburban (large fringe metropolitan) locations than for those residing in other areas. Between 2000 and 2007, inpatient mortality for AMI stays decreased more quickly among those living in suburban areas (37 percent) than among those living in rural areas (32 percent decrease for large town rural (micropolitan) areas, 34 percent decrease in the most rural areas). Patients living in suburban areas also experienced the greatest decrease (51 percent) in inpatient mortality for pneumonia compared to patients living in all other areas. Inpatient mortality for congestive heart failure and stroke decreased more quickly among patients residing in suburban areas than it did for patients living elsewhere. Decreases in mortality varied across regions between 2000 and 2007 for AMI, congestive heart failure, pneumonia, and stroke. The Midwest, in particular, exhibited the greatest mortality decreases for all four conditions. Notably, this region had the highest rate of decline for AMI mortality (44 percent) relative to other regions, and consequently went from the highest regional rate in 2000 (112 deaths per 1,000 admissions) to the lowest in 2007 (63 deaths per 1,000 admissions). Mortality also improved significantly among AMI (from 104 to 67 deaths per 1,000 admissions) and CHF (from 55 to 28 deaths per 1,000 admissions) inpatients in the South. Stroke patients residing in the western region of the United States demonstrated a slower rate of decrease in mortality (21 percent) from 2000 to 2007 compared to those in the Northeast (26 percent). Changes in inpatient risk-adjusted mortality rates for selected diagnoses by community income, 2000–2007 Figure 2 shows that risk-adjusted inpatient mortality for the selected conditions decreased across all income quartiles from 2000 to 2007. Decreases in inpatient mortality rates were similar across income quartiles for acute myocardial infarction and stroke. In the case of both congestive heart failure and pneumonia, individuals in the poorest communities had slightly lower risk-adjusted inpatient mortality rates than their wealthier counterparts in 2000, but by 2007 they had slightly higher risk-adjusted mortality. Between 2000 and 2007, congestive heart failure inpatient mortality rates for individuals living in the wealthiest communities decreased more rapidly (a 52 percent decrease) than for individuals living in the poorest communities (a 44 percent decrease). Similarly, rates of pneumonia mortality decreased more rapidly among the wealthiest (a 50 percent decrease), while rates of individuals in the poorest quartiles—the first and second—decreased by 40 and 44 percent, respectively. Changes in inpatient risk-adjusted mortality rates for selected diagnoses by payer, 2000–2007 Figure 3 shows the percentage change in selected inpatient risk-adjusted mortality rates by payer. Mortality decreased among all payers for all conditions; however, for some payers and conditions it decreased by a greater magnitude than others. Mortality among Medicare hospitalizations for AMI decreased by 38 percent—from 106 deaths per 1,000 admissions in 2000 to 66 deaths per 1,000 admissions in 2007—while mortality rates among Medicaid hospitalizations for AMI decreased by 27 percent—from 103 deaths per 1,000 admissions in 2000 to 75 deaths per 1,000 admissions in 2007. Mortality among privately-insured hospitalizations decreased by 32 percent—from 98 deaths per 1,000 admissions in 2000 to 67 deaths per 1,000 admissions in 2007. While risk-adjusted mortality for AMI decreased among uninsured hospitalizations (from 133 to 93 deaths per 1,000 admissions) from 2000 to 2007, this pace of decline was similar to that of privately-insured patients. Congestive heart failure mortality rates were much higher for privately-insured hospitalizations than for Medicare and Medicaid hospitalizations in 2000 (60 deaths per 1,000 privately-insured admissions, 55 deaths per 1,000 Medicare admissions, 45 deaths per 1,000 Medicaid admissions). Although the CHF mortality rates for those with Medicaid decreased more slowly (a 34 percent decrease) compared to the privately-insured (a 41 percent decrease) between 2000 and 2007, the mortality rates remained lower for this population relative to the privately-insured in the year 2007 (30 deaths per 1,000 for Medicaid-covered patients versus 36 deaths per 1,000 for the privately insured). Mortality among Medicare CHF admissions decreased by 51 percent (from 55 to 27 deaths per 1,000 admissions) from 2000 to 2007, demonstrating the lowest death rate for this condition in the latter year. CHF mortality also declined for the uninsured (from 64 to 34 deaths per 1,000 admissions); however, this decline reflected a rate of change similar to privately-insured inpatients. Mortality rates for stroke declined more slowly for privately-insured hospitalizations than they did for Medicare, Medicaid, and uninsured hospitalizations (respective decreases of 21 percent, 28 percent, 27 percent, and 30 percent). In 2007, stroke mortality rates remained high, particularly for uninsured (111 deaths per 1,000 admissions) and privately-insured inpatients (99 deaths per 1,000 admissions). Data Source The estimates in this Statistical Brief are based upon data from the HCUP 2007 Nationwide Inpatient Sample (NIS). Historical data were drawn from the 1994, 1997, 2000, 2001, 2002, 2003, 2004, 2005, 2006, and 2007 NIS. Definitions Types of hospitals included in HCUP HCUP is based on data from community hospitals, defined as short-term, non-Federal, general and other hospitals, excluding hospital units of other institutions (e.g., prisons). HCUP data include OB-GYN, ENT, orthopedic, cancer, pediatric, public, and academic medical hospitals. They exclude long-term care, rehabilitation, psychiatric, and alcoholism and chemical dependency hospitals, but these types of discharges are included if they are from community hospitals. Unit of analysis The unit of analysis is the hospital discharge (i.e., the hospital stay), not a person or patient. This means that a person who is admitted to the hospital multiple times in one year will be counted each time as a separate "discharge" from the hospital. Median community-level income Median community-level income is the median household income of the patient’s ZIP Code of residence. The cut-offs for the quartile designation are determined using ZIP Code demographic data obtained from Claritas. The income quartile is missing for homeless and foreign patients. Payer Payer is the expected primary payer for the hospital stay. To make coding uniform across all HCUP data sources, payer combines detailed categories into more general groups:
Region Region is one of the four regions defined by the U.S. Census Bureau:
Urban-rural location is one of six categories as defined by the National Center for Health Statistics (http://www.cdc.gov/nchs/data_access/urban_rural.htm):
The AHRQ Inpatient Quality Indicators (IQI) (Version 3.1) were used for this analysis to identify the admissions of interest and for risk-adjustment. The IQIs, a component of the AHRQ QIs, are a set of measures that can be used with hospital inpatient discharge and administrative data to provide a perspective on quality. Mortality indicators for inpatient care include conditions and procedures for which mortality has been shown to vary across institutions and for which there is evidence that high mortality may be associated with poorer quality of care. The IQI approach identified the admissions for the four diagnoses (based on ICD-9-CM principal diagnosis codes) examined in this Statistical Brief. The admissions included those age 18 years of age or older and excluded those that were transferred to another hospital and, with the exception of acute myocardial infarction (AMI), those that were obstetrical. As part of the IQI risk-adjustment approach, All Patient Refined Diagnosis-Related Groups (APR-DRG) software was applied to the data. The APR-DRG classification expands the DRG classification (used for Medicare reimbursement) to be applicable to non-Medicare populations and for uses beyond those related to resource consumption (i.e., for risk of mortality and severity of illness). Each admission is assigned an APR-DRG and a Risk of Mortality subclass (minor, moderate, major, or extreme) within the APR-DRG. The IQI risk adjustment variables were age, sex, age-sex interaction, and APR-DRG Risk of Mortality subclass. Regression-based standardization (designed by the developers of the IQI software) was used for risk adjustment. The calculations take into account the clustering of patients within hospitals and the hospital stratification aspects of the sampling design6. The in-hospital mortality rates were weighted for national estimates. Pairwise t-tests were used to test for statistical significance of differences in hospital mortality. (Additional detail on the risk adjustment methodology and statistical approach is available in Coffey et al., 2009). Further information on the AHRQ QIs, including documentation and free software downloads, is available at http://www.qualityindicators.ahrq.gov/. About HCUP HCUP is a family of powerful healthcare databases, software tools, and products for advancing research. Sponsored by the Agency for Healthcare Research and Quality (AHRQ), HCUP includes the largest all-payer encounter-level collection of longitudinal healthcare data (inpatient, ambulatory surgery, and emergency department) in the United States, beginning in 1988. HCUP is a Federal-State-Industry Partnership that brings together the data collection efforts of many organizations—such as State data organizations, hospital associations, private data organizations, and the Federal government—to create a national information resource. HCUP would not be possible without the contributions of the following data collection Partners from across the United States: Arizona Department of Health Services Arkansas Department of Health California Office of Statewide Health Planning and Development Colorado Hospital Association Connecticut Hospital Association Florida Agency for Health Care Administration Georgia Hospital Association Hawaii Health Information Corporation Illinois Department of Public Health Indiana Hospital Association Iowa Hospital Association Kansas Hospital Association Kentucky Cabinet for Health and Family Services Louisiana Department of Health and Hospitals Maine Health Data Organization Maryland Health Services Cost Review Commission Massachusetts Division of Health Care Finance and Policy Michigan Health & Hospital Association Minnesota Hospital Association Missouri Hospital Industry Data Institute Nebraska Hospital Association Nevada Department of Health and Human Services New Hampshire Department of Health & Human Services New Jersey Department of Health and Senior Services New Mexico Health Policy Commission New York State Department of Health North Carolina Department of Health and Human Services Ohio Hospital Association Oklahoma State Department of Health Oregon Association of Hospitals and Health Systems Pennsylvania Health Care Cost Containment Council Rhode Island Department of Health South Carolina State Budget & Control Board South Dakota Association of Healthcare Organizations Tennessee Hospital Association Texas Department of State Health Services Utah Department of Health Vermont Association of Hospitals and Health Systems Virginia Health Information Washington State Department of Health West Virginia Health Care Authority Wisconsin Department of Health Services Wyoming Hospital Association About the NIS The HCUP Nationwide Inpatient Sample (NIS) is a nationwide database of hospital inpatient stays. The NIS is nationally representative of all community hospitals (i.e., short-term, non-Federal, non-rehabilitation hospitals). The NIS is a sample of hospitals and includes all patients from each hospital, regardless of payer. It is drawn from a sampling frame that contains hospitals comprising about 95 percent of all discharges in the United States. The vast size of the NIS allows the study of topics at both the national and regional levels for specific subgroups of patients. In addition, NIS data are standardized across years to facilitate ease of use. For More Information For more information about HCUP, visit http://www.hcup-us.ahrq.gov. For additional HCUP statistics, visit HCUPnet, our interactive query system, at www.hcup.ahrq.gov. For information on other hospitalizations in the U.S., download HCUP Facts and Figures: Statistics on Hospital-based Care in the United States in 2008, located at http://www.hcup-us.ahrq.gov/reports.jsp. For a detailed description of HCUP, more information on the design of the NIS, and methods to calculate estimates, please refer to the following publications: Coffey R., Barrett M., Houchens R., Moy E., Ho K., Andrews R., Moles E. Methods Applying AHRQ Quality Indicators to Healthcare Cost and Utilization Project (HCUP) Data for the Seventh (2009) National Healthcare Quality Report. HCUP Methods Series Report # 2009-01. Online August 17, 2009. U.S. Agency for Healthcare Research and Quality. Steiner, C., Elixhauser, A., Schnaier, J.The Healthcare Cost and Utilization Project: An Overview. Effective Clinical Practice 5(3):143–51, 2002. Introduction to the HCUP Nationwide Inpatient Sample, 2008. Online. May 2010. U.S. Agency for Healthcare Research and Quality. http://www.hcup-us.ahrq.gov/db/nation/nis/NIS_2008_INTRODUCTION.pdf. Houchens, R., Elixhauser, A. Final Report on Calculating Nationwide Inpatient Sample (NIS) Variances, 2001. HCUP Methods Series Report #2003-2. Online. June 2005 (revised June 6, 2005). U.S. Agency for Healthcare Research and Quality. http://www.hcup-us.ahrq.gov/reports/methods/2003_02.pdf. Houchens R.L., Elixhauser A. Using the HCUP Nationwide Inpatient Sample to Estimate Trends. (Updated for 1988–2004). HCUP Methods Series Report #2006-05 Online. August 18, 2006. U.S. Agency for Healthcare Research and Quality. http://www.hcup-us.ahrq.gov/reports/methods/2006_05_NISTrendsReport_1988–2004.pdf Suggested Citation Hines, A. (Thomson Reuters), Stranges, E. (Thomson Reuters), and Andrews, R.M. (AHRQ). Trends in Hospital Risk-Adjusted Mortality for Select Diagnoses by Patient Subgroups, 2000–2007. HCUP Statistical Brief #98. October 2010. Agency for Healthcare Research and Quality, Rockville, MD. http://www.hcup-us.ahrq.gov/reports/statbriefs/sb98.pdf. AHRQ welcomes questions and comments from readers of this publication who are interested in obtaining more information about access, cost, use, financing, and quality of healthcare in the United States. We also invite you to tell us how you are using this Statistical Brief and other HCUP data and tools, and to share suggestions on how HCUP products might be enhanced to further meet your needs. Please e-mail us at hcup@ahrq.gov or send a letter to the address below: Irene Fraser, Ph.D., Director Center for Delivery, Organization, and Markets Agency for Healthcare Research and Quality 540 Gaither Road Rockville, MD 20850 1Institute of Medicine. Future Directions for the National Healthcare Quality and Disparities Reports. April 2010. Washington, D.C.: The National Academies Press. 2Agency for Healthcare Research and Quality. National Healthcare Quality Report. Rockville, MD: U.S. Department of Health and Human Services, Agency for Healthcare Research and Quality: March 2010. AHRQ Pub. No. 10-0003. 3Agency for Healthcare Research and Quality. National Healthcare Disparities Report. Rockville, MD: U.S. Department of Health and Human Services, Agency for Healthcare Research and Quality: March 2010. AHRQ Pub. No. 10-0004. 4Andrews, R. (AHRQ), Russo, C.A. (Thomson Healthcare), and Pancholi, M. Trends in Hospital Risk-Adjusted Mortality for Select Diagnoses and Procedures, 1994–2004. HCUP Statistical Brief #38. October 2007. Agency for Healthcare Research and Quality, Rockville, MD. http://www.hcup-us.ahrq.gov/reports/statbriefs/sb38.pdf 5Rates are adjusted by age, sex, age-sex interactions, and All Patient Refined Diagnosis-related Groups (APR-DRG) risk of mortality score. 6Houchens R.L., Elixhauser A. Using the HCUP Nationwide Inpatient Sample to Estimate Trends. (Updated for 1988–2004). HCUP Methods Series Report #2006-05 Online. August 18, 2006. U.S. Agency for Healthcare Research and Quality. http://www.hcup-us.ahrq.gov/reports/methods/2006_05_NISTrendsReport_1988-2004.pdf |
| Table 1. Inpatient risk-adjusted mortality rates per 1,000 admissions for selected diagnoses by patient characteristics, 2000 and 2007 | ||||||||
| Acute Myocardial Infarction | Congestive Heart Failure | Pneumonia | Stroke | |||||
|---|---|---|---|---|---|---|---|---|
| 2000 | 2007 | 2000 | 2007 | 2000 | 2007 | 2000 | 2007 | |
| 105.8 | 67.3 | 55.3 | 28.2 | 74.0 | 40.8 | 125.0 | 92.1 | |
| Age | ||||||||
| 18–44 years | 21.1 | 16.6 | 19.4 | 12.2 | 20.0 | 10.4 | 117.6 | 88.1 |
| 45–64 years | 45.5 | 31.8 | 27.9 | 15.1 | 42.3 | 23.6 | 105.8 | 76.6 |
| 65+ years | 144.9 | 92.3 | 64.3 | 33.6 | 93.1 | 51.2 | 131.7 | 98.7 |
| Sex | ||||||||
| Male | 92.1 | 57.9 | 57.4 | 27.7 | 79.3 | 43.2 | 123.1 | 87.2 |
| Female | 127.0 | 77.4 | 53.6 | 29.1 | 70.2 | 37.1 | 127.4 | 96.3 |
| Urban-Rural Location | ||||||||
| Large central metropolitan | 101.4 | 64.0 | 50.2 | 25.5 | 69.4 | 37.5 | 114.4 | 86.0 |
| Large fringe metropolitan | 101.3 | 63.3 | 54.7 | 26.1 | 76.2 | 37.2 | 121.3 | 86.3 |
| Medium metropolitan | 102.6 | 63.9 | 56.9 | 25.2 | 74.7 | 39.7 | 131.1 | 92.0 |
| Small metropolitan | 117.1 | 74.2 | 61.7 | 32.7 | 80.8 | 42.4 | 130.9 | 100.2 |
| Micropolitan | 113.9 | 77.1 | 59.5 | 35.9 | 77.1 | 46.6 | 137.6 | 107.4 |
| Not metropolitan or micropolitan | 118.0 | 77.5 | 60.3 | 38.1 | 72.1 | 51.3 | 144.7 | 107.7 |
| Region | ||||||||
| Northeast | 103.5 | 69.5 | 57.7 | 32.1 | 77.3 | 44.8 | 134.1 | 98.6 |
| Midwest | 111.9 | 63.2 | 56.2 | 25.2 | 71.3 | 35.4 | 126.0 | 88.7 |
| South | 104.1 | 67.3 | 54.6 | 27.9 | 75.3 | 42.6 | 124.0 | 90.8 |
| West | 104.5 | 71.1 | 52.2 | 28.9 | 70.2 | 39.8 | 116.7 | 92.6 |
| 110.9 | 69.7 | 54.3 | 30.2 | 71.7 | 43.2 | 129.1 | 94.2 | |
| Second quartile | 106.3 | 68.5 | 56.8 | 27.8 | 73.3 | 40.9 | 126.7 | 94.2 |
| Third quartile | 105.2 | 67.3 | 53.4 | 27.1 | 74.6 | 38.8 | 120.7 | 90.2 |
| Fourth quartile (highest income) | 99.0 | 62.9 | 56.5 | 27.2 | 77.6 | 39.1 | 121.7 | 89.3 |
| Primary Payer | ||||||||
| Private insurance | 98.1 | 66.9 | 60.1 | 35.6 | 75.8 | 43.5 | 126.0 | 99.4 |
| Medicare | 106.5 | 66.1 | 54.9 | 26.9 | 73.6 | 39.9 | 122.8 | 88.1 |
| Medicaid | 103.2 | 75.3 | 45.0 | 29.8 | 72.2 | 41.4 | 121.4 | 89.2 |
| Uninsured/self-pay/no charge | 133.2 | 92.9 | 63.9 | 34.4 | 83.5 | 45.3 | 158.1 | 110.7 |
| Source: AHRQ, Center for Delivery, Organization, and Markets, Healthcare Cost and Utilization Project, Nationwide Inpatient Sample, 2000 and 2007 | ||||||||
| Table 2. Change in inpatient risk-adjusted mortality rates for selected diagnoses by patient characteristics, 2000–2007 | ||||
| Acute Myocardial Infarction | Congestive Heart Failure | Pneumonia | Stroke | |
|---|---|---|---|---|
| National Total | -36% | -49% | -45% | -26% |
| Age | ||||
| 18–44 years | -22% | -37% | -48% | -25% |
| 45–64 years | -30% | -46% | -44% | -28% |
| 65+ years | -36% | -48% | -45% | -25% |
| Sex | ||||
| Male | -37% | -52% | -46% | -29% |
| Female | -39% | -46% | -47% | -24% |
| Urban/Rural Location | ||||
| Large central metropolitan | -37% | -49% | -46% | -25% |
| Large fringe metropolitan | -37% | -52% | -51% | -29% |
| Medium metropolitan | -38% | -56% | -47% | -30% |
| Small metropolitan | -37% | -47% | -48% | -23% |
| Micropolitan | -32% | -40% | -40% | -22% |
| Not metropolitan or micropolitan | -34% | -37% | -29% | -26% |
| Region | ||||
| Northeast | -33% | -44% | -42% | -26% |
| Midwest | -44% | -55% | -50% | -30% |
| South | -35% | -49% | -44% | -27% |
| West | -32% | -45% | -43% | -21% |
| Source: AHRQ, Center for Delivery, Organization, and Markets, Healthcare Cost and Utilization Project, Nationwide Inpatient Sample, 2000 and 2007 | ||||
|
HCUP Statistical Brief #98. Figure 1. Trends in inpatient risk-adjusted mortality rates for selected conditions, 1994-2007. Trend line chart; deaths per 1,000 admissions; 1994, Congestive heart failure, 70.5; pneumonia, 90.8, acute myocardial infarction, 127.7; stroke, 142.5; 1997, Congestive heart failure, 70.5; pneumonia, 90.8, acute myocardial infarction, 127.7; stroke, 142.5; 2000, Congestive heart failure, 59.8; pneumonia, 76.5, acute myocardial infarction, 114.5; stroke, 125.2; 2001, Congestive heart failure, 55.3; pneumonia, 74.0, acute myocardial infarction, 105.8; stroke, 125.0; 2002, Congestive heart failure, 55.0; pneumonia, 70.8, acute myocardial infarction, 99.7; stroke, 124.5; 2003, Congestive heart failure, 50.5; pneumonia, 62.8, acute myocardial infarction, 96.7; stroke, 119.5; 2004, Congestive heart failure, 45.5; pneumonia, 60.8, acute myocardial infarction, 94.7; stroke, 117.5; 2005, Congestive heart failure, 35.5; pneumonia, 52.8, acute myocardial infarction, 82.7; stroke, 116.5; 2006, Congestive heart failure, 30.5; pneumonia, 45.8, acute myocardial infarction, 77.7; stroke, 110.5; 2007, Congestive heart failure, 28.2; pneumonia, 40.8, acute myocardial infarction, 67.3; stroke, 92.1. Source: AHRQ, Center for Delivery, Organization, and Markets, Healthcare Cost and Utilization Project, Nationwide Inpatient Sample, 1994, 1997, 2000, 2001, 2002, 2003, 2004, 2005, 2006, and 2007.
HCUP Statistical Brief #98. Figure 2. Percentage change in selected inpatient risk-adjusted mortality rates by community income, 2000-2007. Bar chart; percentage change; acute myocardial infarction in the first quartile (poorest), -37%; second quartile, -36%; third quartile, -36%; fourth quartile (wealthiest), -37%; percentage change; congestive heart failure in the first quartile (poorest), -44%; second quartile, -51%; third quartile, -49%; fourth quartile (wealthiest), -52%; percentage change; pneumonia in the first quartile (poorest), -40%; second quartile, -44%; third quartile, -48%; fourth quartile (wealthiest), -50%; percentage change; stroke in the first quartile (poorest), -27%; second quartile, -26%; third quartile, -25%; fourth quartile (wealthiest), -27%. Source: AHRQ, Center for Delivery, Organization, and Markets, Healthcare Cost and Utilization Project, Nationwide Inpatient Sample, 2000 and 2007.
HCUP Statistical Brief #98. Figure 3. Percentage change in selected inpatient risk-adjusted mortality rates by payer, 2000-2007. Bar chart; percentage change; acute myocardial infarction with private insurance, -32%; Medicare, -38%; Medicaid, -27%; Uninsured/self-pay/no charge, -30%; percentage change; congestive heart failure with private insurance, -41%; Medicare, -51%; Medicaid, -34%; Uninsured/self-pay/no charge, -46%; percentage change; pneumonia with private insurance, -43%; Medicare, -46%; Medicaid, -43%; Uninsured/self-pay/no charge, -46%; percentage change; stroke with private insurance, -21%; Medicare, -28%; Medicaid, -27%; Uninsured/self-pay/no charge, -30%. Source: AHRQ, Center for Delivery, Organization, and Markets, Healthcare Cost and Utilization Project, Nationwide Inpatient Sample, 2000 and 2007.
|
| Internet Citation: Statistical Brief #98. Healthcare Cost and Utilization Project (HCUP). October 2010. Agency for Healthcare Research and Quality, Rockville, MD. hcup-us.ahrq.gov/reports/statbriefs/sb98.jsp. |
| Are you having problems viewing or printing pages on this website? |
| If you have comments, suggestions, and/or questions, please contact hcup@ahrq.gov. |
| If you are experiencing issues related to Section 508 accessibility of information on this website, please contact hcup@ahrq.gov. |
| Privacy Notice, Viewers & Players |
| Last modified 10/20/10 |