STATISTICAL BRIEF #97
|
|
October 2010
Bernard Friedman, Ph.D., Rachel M. Henke, Ph.D., and Lauren M. Wier, M.P.H.
Introduction Anecdotal reports of extremely high cost hospitalizations are common in the media, often featuring patients whose circumstances make it difficult for them to pay the bill. A more complete understanding of the characteristics of extremely high cost hospitalizations can inform healthcare consumers and policy makers seeking to understand what circumstances lead to astronomical totals. Identifying characteristics of extremely high charge stays can also provide valuable insight for researchers considering excluding stays with extreme charges from their study sample. Research examining inpatient expenditures can be distorted by a small number of extremely high charges that have undue influence on the results. This is not desirable because these high charges could reflect measurement errors that distort the goodness of fit of statistical models.1 This Statistical Brief presents data from the Healthcare Cost and Utilization Project (HCUP) Nationwide Inpatient Sample (NIS) and focuses on differences between discharges in the top 5 percent and bottom 95 percent of total charges as received by the data source in 2008. This Brief also compares discharges in the top 0.5 percent and the next 0.5 percent of total charges to explore whether there are any anomalies in the top percent that suggest measurement error. Differences examined include hospital and patient characteristics, clinical severity, length of stay, number of comorbidities, principal diagnosis, and all-listed procedures. The percentage of suspiciously high charge discharges in the top 1 percent of total charges as submitted by source is also reviewed. All differences between estimates noted in the text are statistically significant at the 0.05 level or better. Findings Characteristics of top 5 percent and bottom 95 percent hospital discharges based on total charge Table 1 presents the utilization, patient, and hospital characteristics of the top 5 percent and bottom 95 percent of hospital discharges based on total charges. The top 5 percent of stays accounted for approximately 1.96 million discharges and the bottom 95 percent accounted for 37.9 million discharges. |
|
There were differences between the two groups across all characteristics examined. The top 5 percent of hospital discharges had a mean charge of $191,984, a mean charge per day of $18,065, and an average of 19.0 days per stay. This was significantly higher than the bottom 95 percent of hospital discharges which had a mean charge of $20,804, a mean charge per day of $6,979, and an average of 3.9 days per stay.
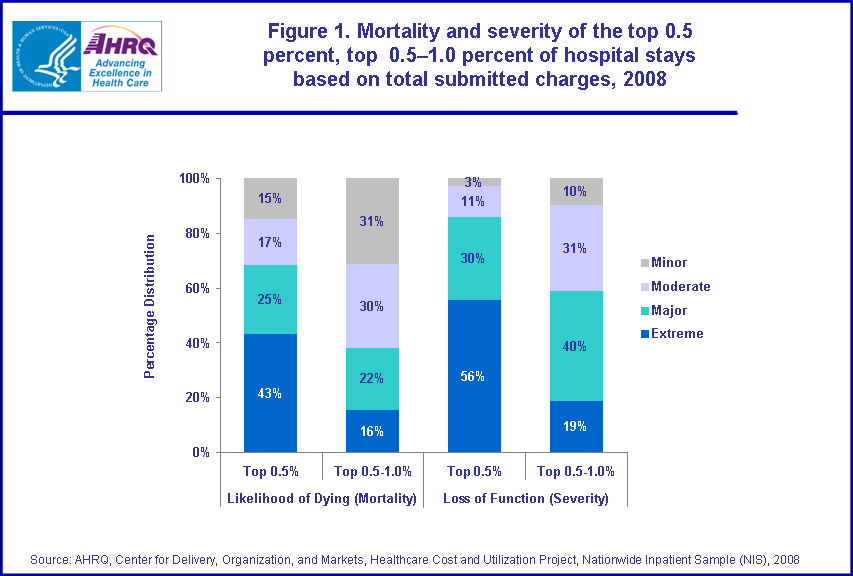
Compared to the bottom 95 percent of stays, the top 5 percent were older (mean age 58.6 versus 48.0 years), more likely to be male (54.0 versus 40.7 percent), and more likely to reside in the Western region of the U.S. Relative to the bottom 95 percent, the top 5 percent had more comorbid conditions (2.5 versus 1.7 on average), greater severity (39.2 versus 4.0 percent extreme loss of function), and greater risk of mortality (28.1 versus 3.1 percent extreme likelihood of dying). Compared to the bottom 95 percent, the top 5 percent were more likely to receive care in teaching hospitals (57 versus 46 percent). Table 2 provides the top five principal diagnoses for the top 5 percent and bottom 95 percent of hospital discharges based on total charges. Septicemia (severe bloodstream infection) was the most common principal diagnosis associated with discharges in the high charges group, accounting for 6.5 percent of high charge stays. Discharges with a principal diagnosis of septicemia in this group had an average length of stay of 22.0 days and an average of 3.1 comorbid conditions. Coronary atherosclerosis and acute myocardial infarction were the second and third most frequent principal diagnoses in this group. Complications of medical care (complications of devices, implants, or grafts) and respiratory failure were also high frequency conditions. These top 5 conditions accounted for one quarter of all high charge stays. In contrast, liveborn infant was the most frequent principal diagnosis (11.0 percent) for stays in the bottom 95 percent, with an average length of stay of 2.6 days and an average of 0.0 comorbid conditions. Pneumonia, congestive heart failure, osteoarthritis, and trauma to perineum and vulva due to childbirth were also frequent primary diagnoses in the bottom 95 percent group. Table 3 provides the top five all-listed procedures for the top 5 percent and bottom 95 percent of hospital discharges based on total charges. Blood transfusion was the most frequent procedure in both groups, performed in 27.8 percent of high charge stays and 5.8 percent of stays in the bottom 95 percent group. Diagnostic cardiac catheterization was also frequent in both groups, performed in 13.2 percent of high charge stays and 3.3 percent of stays in the bottom 95 percent. Characteristics of the top 0.5 percent and top 0.5 percent–1.0 percent hospital discharges based on total charge Table 1 also presents the utilization, patient, and hospital characteristics of the top 0.5 percent and the next 0.5 percent of hospital discharges based on total charges. The top 0.5 percent of hospital discharges had a mean charge of $568,040, a mean charge per day of $17,224, and an average of 48.4 days per stay. The top 0.5 percent–1.0 percent of hospital discharges had a mean charge of $264,172, a mean charge per day of $17,991, and an average of 26.1 days per stay. The majority of patient and hospital characteristics were similar across the two groups. One striking difference was the nearly double percentage of discharges under age 1 in the top 0.5 percent group compared to the next 0.5 percent (13.3 versus 7.1 percent). There were also notable differences across groups in mortality risk and severity, also displayed in figure 1. Compared to the top 0.5 percent-1.0 percent group, the top 0.5 percent group was comprised of discharges in which the patient had a greater extreme likelihood of dying (53.2 versus 40.4 percent), and a greater extreme loss of function (75.2 versus 56.3 percent). Table 4 provides the top 5 principal diagnoses for the top 0.5 percent and the next 0.5 percent of hospital discharges based on total charges. Across both groups, the most frequent principal diagnosis was septicemia. However, the mean length of stay for this diagnosis in the top 0.5 percent group was 44.1 days compared to 26.3 days in the 0.5 percent–1.0 percent group. The mean number of comorbidities associated with septicemia was similar for both groups. Liveborn infants and stays principally for respiratory failure were also among the top 5 most common diagnoses for both groups. The average length of stay for these two principal diagnoses was notably longer for stays in the top 0.5 percent group compared to the next 0.5 percent group (liveborn infants: 81.8 versus 49.0 days; respiratory failure: 56.7 versus 31.8 days). Table 5 provides the top five all-listed procedures for the top 0.5 percent and next 0.5 percent of hospital discharges based on total charges. Four of the five frequent procedures were common across these two groups: respiratory intubation and mechanical ventilation, blood transfusion, enteral and parenteral nutrition (tube feeding), and bronchoscopy. Tracheostomy was also one of the most frequent procedures in the top 0.5 percent group, performed in 23.8 percent of stays. Diagnostic cardiac catheterization was one of the most frequent procedures in the top 0.5–1.0 percent group, performed in 12.8 percent of stays. Identification and description of suspiciously high charges Suspiciously high charges2 were identified in the top 0.5 percent and the next 0.5 percent group based on average charges per day (table 6). Approximately 12 percent of the discharges in the top 0.5 percent group were identified as suspiciously high compared to about 14 percent of discharges in the top 0.5 percent-1.0 percent group. There were striking differences between the discharges identified as suspiciously high in the top 0.5 percent group described in table 6 (first column) and all discharges in the top 0.5 percent group (table 1, first column). The cases with suspiciously high charges were more severe and had a much lower mean length of stay then all discharges in the top 0.5 percent group. Data Source The estimates in this Statistical Brief are based upon data from the HCUP 2008 Nationwide Inpatient Sample (NIS). Definitions Diagnoses, ICD-9-CM, and Clinical Classifications Software (CCS) The principal diagnosis is that condition established after study to be chiefly responsible for the patient’s admission to the hospital. Secondary diagnoses are concomitant conditions that coexist at the time of admission or that develop during the stay. All-listed procedures include all procedures performed during the hospital stay. ICD-9-CM is the International Classification of Diseases, Ninth Revision, Clinical Modification, which assigns numeric codes to diagnoses. There are about 13,600 ICD-9-CM diagnosis codes. Procedures on inpatient hospitalization records are coded using ICD-9-CM, while procedures on ambulatory surgery records can be coded using ICD-9-CM or the Common Procedural Terminology (CPT). CCS categorizes ICD-9-CM diagnoses and procedures into a manageable number of clinically meaningful categories.3 This "clinical grouper" makes it easier to quickly understand patterns of diagnoses. Case definition This Statistical Brief presents charge information based on TOTCHG_X, which represents total charges as received from data source with no editing. The top 5 percent of discharges based on charges were defined as discharges whose TOTCHG_X value was in the top 5th percentile of the distribution of TOTCHG_X. The bottom 95 percent of discharges based on charges were defined as discharges whose TOTCHG_X value was in the bottom 95th percentile of the distribution of TOTCHG_X. The top 0.5 percent of discharges based on charges were defined as discharges whose TOTCHG_X value was in the top 0.0–0.5th percentile of the distribution of TOTCHG_X. The top 0.5–1.0 percent of discharges based on charges were defined as discharges whose TOTCHG_X value was in the top 0.5–1st percentile of the distribution of TOTCHG_X. Types of hospitals included in HCUP HCUP is based on data from community hospitals, defined as short-term, non-Federal, general and other hospitals, excluding hospital units of other institutions (e.g., prisons). HCUP data include OB-GYN, ENT, orthopedic, cancer, pediatric, public, and academic medical hospitals. They exclude long-term care, rehabilitation, psychiatric, and alcoholism and chemical dependency hospitals, but these types of discharges are included if they are from community hospitals. Unit of analysis The unit of analysis is the hospital discharge (i.e., the hospital stay), not a person or patient. This means that a person who is admitted to the hospital multiple times in one year will be counted each time as a separate "discharge" from the hospital. Charges Charges represent what the hospital billed for the case. Hospital charges reflect the amount the hospital charged for the entire hospital stay and do not include professional (physician) fees. For the purposes of this Statistical Brief, charges are rounded to the nearest hundred dollars. There are two data elements related to charge available in the Nationwide Inpatient Sample (NIS). This Statistical Brief presents charge information based on TOTCHG_X, which represents total charges as received from data source with no editing. The other element related to charge is TOTCHG, which represents an edited version of the total charges received from data source. All charges over $1.5 million and under $100 are set to missing in TOTCHG. Suspiciously high charges Suspicious charges are potential data entry errors and represent discharges that are outliers in terms of the average charge per day of stay. In order to identify suspicious charges, the average charge per day of stay was calculated for each discharge in the top 1 percent of total charges. The difference between the 75th percentile and median average charge per day was multiplied by 4. This product added to the median was used as the cutoff value for suspiciously high charges. This cutoff level was $26,993 per day. This criterion allows for substantial skewness of the distribution of charges per day. With a normal distribution, such a large cutoff would be about 3 standard deviations above the average, leaving an upper tail less than 0.1 percent of the distribution of positive values. Identifying values above this cutoff as potential measurement error is a reasonably conservative criterion. Region Region is one of the four regions defined by the U.S. Census Bureau:
All Patient Refined Diagnosis-Related Groups (APR-DRG) software was applied to the data. The APR-DRG classification expands the DRG classification (used for Medicare reimbursement) to be applicable to non-Medicare populations and for uses beyond those related to resource consumption (i.e., for risk of mortality and severity of illness). Each admission is assigned an APR-DRG and a Risk of Mortality subclass (minor, moderate, major, or extreme likelihood of dying) and Severity of Illness subclass (minor, moderate, major, or extreme loss of function) within the APR-DRG. About HCUP HCUP is a family of powerful healthcare databases, software tools, and products for advancing research. Sponsored by the Agency for Healthcare Research and Quality (AHRQ), HCUP includes the largest all-payer encounter-level collection of longitudinal healthcare data (inpatient, ambulatory surgery, and emergency department) in the United States, beginning in 1988. HCUP is a Federal-State-Industry Partnership that brings together the data collection efforts of many organizations—such as State data organizations, hospital associations, private data organizations, and the Federal government—to create a national information resource. HCUP would not be possible without the contributions of the following data collection Partners from across the United States: Arizona Department of Health Services Arkansas Department of Health California Office of Statewide Health Planning and Development Colorado Hospital Association Connecticut Hospital Association Florida Agency for Health Care Administration Georgia Hospital Association Hawaii Health Information Corporation Illinois Department of Public Health Indiana Hospital Association Iowa Hospital Association Kansas Hospital Association Kentucky Cabinet for Health and Family Services Louisiana Department of Health and Hospitals Maine Health Data Organization Maryland Health Services Cost Review Commission Massachusetts Division of Health Care Finance and Policy Michigan Health & Hospital Association Minnesota Hospital Association Missouri Hospital Industry Data Institute Nebraska Hospital Association Nevada Department of Health and Human Services New Hampshire Department of Health & Human Services New Jersey Department of Health and Senior Services New Mexico Health Policy Commission New York State Department of Health North Carolina Department of Health and Human Services Ohio Hospital Association Oklahoma State Department of Health Oregon Association of Hospitals and Health Systems Pennsylvania Health Care Cost Containment Council Rhode Island Department of Health South Carolina State Budget & Control Board South Dakota Association of Healthcare Organizations Tennessee Hospital Association Texas Department of State Health Services Utah Department of Health Vermont Association of Hospitals and Health Systems Virginia Health Information Washington State Department of Health West Virginia Health Care Authority Wisconsin Department of Health Services Wyoming Hospital Association About the NIS The HCUP Nationwide Inpatient Sample (NIS) is a nationwide database of hospital inpatient stays. The NIS is nationally representative of all community hospitals (i.e., short-term, non-Federal, non-rehabilitation hospitals). The NIS is a sample of hospitals and includes all patients from each hospital, regardless of payer. It is drawn from a sampling frame that contains hospitals comprising about 95 percent of all discharges in the United States. The vast size of the NIS allows the study of topics at both the national and regional levels for specific subgroups of patients. In addition, NIS data are standardized across years to facilitate ease of use. For More Information For more information about HCUP, visit http://www.hcup-us.ahrq.gov. For additional HCUP statistics, visit HCUPnet, our interactive query system, at www.hcup.ahrq.gov. For information on other hospitalizations in the U.S., download HCUP Facts and Figures: Statistics on Hospital-based Care in the United States in 2008, located at http://www.hcup-us.ahrq.gov/reports.jsp. For a detailed description of HCUP, more information on the design of the NIS, and methods to calculate estimates, please refer to the following publications: Steiner, C., Elixhauser, A., Schnaier, J. The Healthcare Cost and Utilization Project: An Overview. Effective Clinical Practice 5(3):143–51, 2002. Introduction to the HCUP Nationwide Inpatient Sample, 2008. Online. July 2010. U.S. Agency for Healthcare Research and Quality. http://www.hcup-us.ahrq.gov/db/nation/nis/NIS_2008_INTRODUCTION.pdf. Houchens, R., Elixhauser, A. Final Report on Calculating Nationwide Inpatient Sample (NIS) Variances, 2001. HCUP Methods Series Report #2003-2. Online. June 2005 (revised June 6, 2005). U.S. Agency for Healthcare Research and Quality. http://www.hcup-us.ahrq.gov/reports/methods/2003_02.pdf. Suggested Citation Friedman, B. (AHRQ), Henke, R.M. (Thomson Reuters), and Wier, L.M. (Thomson Reuters). Most Expensive Hospitalizations, 2008. HCUP Statistical Brief #97. October 2010. Agency for Healthcare Research and Quality, Rockville, MD. http://www.hcup-us.ahrq.gov/reports/statbriefs/sb97.pdf. Acknowledgments The authors would like to acknowledge the contribution of Mika Nagamine (Thomson Reuters) for programming assistance. *** AHRQ welcomes questions and comments from readers of this publication who are interested in obtaining more information about access, cost, use, financing, and quality of healthcare in the United States. We also invite you to tell us how you are using this Statistical Brief and other HCUP data and tools, and to share suggestions on how HCUP products might be enhanced to further meet your needs. Please e-mail us at hcup@ahrq.gov or send a letter to the address below: Irene Fraser, Ph.D., Director Center for Delivery, Organization, and Markets Agency for Healthcare Research and Quality 540 Gaither Road Rockville, MD 20850 1 Laurikkala, J., Juhola, M., and Kentala, E.: 2000, "Informal Identification of Outliers in Medical Data". In: Fifth International Workshop on Intelligent Data Analysis in Medicine and Pharmacology IDAMAP-2000 Berlin, 22 August. Organized as a workshop of the 14th European Conference on Artificial Intelligence ECAI-2000. 2 Suspicious charges are potential data entry errors identified by an abnormally high average charge per day of stay. See the definitions section for information about how these chargers were identified. 3 HCUP CCS. Healthcare Cost and Utilization Project (HCUP). June 2009. U.S. Agency for Healthcare Research and Quality, Rockville, MD. www.hcup-us.ahrq.gov/toolssoftware/ccs/ccs.jsp. |
| Table 1. Characteristics of the top 0.5 percent, top 0.5–1.0 percent, top 5 percent, and bottom 95 percent of hospital stays based on total submitted charges, 2008 | ||||
| Top 0.5 percent | Top 0.5–1.0 percent | Top 5 percent | Bottom 95 percent | |
|---|---|---|---|---|
| Total number of discharges | 195,637 | 195,657 | 1,955,770 | 37,938,200 |
| Utilization characteristics | ||||
| Mean charges | $568,040 | $264,172 | $191,984 | $20,804 |
| Mean length of stay, days | 48.4 | 26.1 | 19.0 | 3.9 |
| Mean charge per day | $17,224 | $17,991 | $18,065 | $6,979 |
| Patient and hospital characteristics | ||||
| Sex (percentage) | ||||
| Male | 56.7 | 55.3 | 54.0 | 40.7 |
| Female | 43.2 | 44.6 | 45.8 | 59.0 |
| Age (percentage) | ||||
| ‹ 1 year | 13.3 | 7.1 | 5.1 | 12.3 |
| 2–4 years | 0.7 | 0.6 | 0.5 | 0.8 |
| 5–17 years | 3.0 | 2.4 | 2.2 | 3.4 |
| 18–44 years | 14.2 | 12.7 | 12.3 | 25.2 |
| 45–64 years | 32.2 | 33.0 | 32.8 | 23.4 |
| 65–74 years | 17.6 | 20.2 | 20.7 | 12.8 |
| 75–84 years | 14.5 | 17.7 | 19.0 | 13.5 |
| 85+ years | 4.1 | 6.0 | 7.2 | 8.1 |
| Mean age, years | 50.3 | 56.3 | 58.6 | 48.0 |
| Mean number of comborbidities | 2.2 | 2.5 | 2.5 | 1.7 |
| Mortality risk (percentage) | ||||
| No class specified | 0.2 | 0.1 | 0.1 | 0.1 |
| Minor likelihood of dying | 6.4 | 12.2 | 21.4 | 63.5 |
| Moderate likelihood of dying | 11.9 | 18.2 | 23.0 | 22.7 |
| Major likelihood of dying | 28.3 | 29.2 | 27.4 | 10.7 |
| Extreme likelihood of dying | 53.2 | 40.4 | 28.1 | 3.1 |
| Severity (percentage) | ||||
| No class specified | 0.2 | 0.1 | 0.1 | 0.1 |
| Minor loss of function | 1.1 | 2.9 | 7.6 | 38.8 |
| Moderate loss of function | 4.4 | 10.6 | 19.3 | 37.2 |
| Major loss of function | 19.0 | 30.1 | 33.8 | 19.9 |
| Extreme loss of function | 75.2 | 56.3 | 39.2 | 4.0 |
| Region (rate per 10,000 population*) | ||||
| Northeast | 9.5 | 8.8 | 81.6 | 1325.2 |
| Midwest | 3.4 | 4.0 | 45.1 | 1337.6 |
| South | 4.5 | 5.0 | 55.4 | 1299.8 |
| West | 9.9 | 8.9 | 81.3 | 1014.6 |
| Hospital teaching status (percentage) | ||||
| Non-teaching | 32.8 | 39.4 | 42.8 | 53.6 |
| Teaching | 67.2 | 60.6 | 57.2 | 46.2 |
| * Denominator data for rates were based on Claritas Population Estimates, 2008. Source: AHRQ, Center for Delivery, Organization, and Markets, Healthcare Cost and Utilization Project, Nationwide Inpatient Sample (NIS), 2008 | ||||
| Table 2. Most common principal diagnoses among the top 5 percent and bottom 95 percent of hospital stays based on total submitted charges, 2008 | ||||||||
| Top 5 percent | Bottom 95 percent | |||||||
|---|---|---|---|---|---|---|---|---|
| Rank | Top 5 principal diagnoses, CCS category | Number of discharges (percentage) | Mean LOS | Mean number comorbidities | Top 5 principal diagnoses, CCS category | Number of discharges (percentage) | Mean LOS | Mean number comorbidities |
| 1 | Septicemia | 127,301 (6.5%) | 22.0 | 3.1 | Liveborn infant | 4,191,448 (11.0%) | 2.6 | 0.0 |
| 2 | Coronary atherosclerosis | 111,534 (5.7%) | 9.3 | 2.5 | Pneumonia | 1,110,606 (2.9%) | 4.8 | 2.8 |
| 3 | Acute myocardial infarction | 98,149 (5.0%) | 11.6 | 2.4 | Congestive heart failure | 952,274 (2.5%) | 4.7 | 3.0 |
| 4 | Complication of device, implant, or graft | 87,287 (4.5%) | 16.2 | 2.6 | Osteoarthritis | 879,729 (2.3%) | 3.3 | 1.9 |
| 5 | Respiratory failure | 79,976 (4.1%) | 26.0 | 3.6 | Trauma to perineum and vulva due to childbirth | 819,409(2.2%) | 2.1 | 0.2 |
| Source: AHRQ, Center for Delivery, Organization, and Markets, Healthcare Cost and Utilization Project, Nationwide Inpatient Sample (NIS), 2008 | ||||||||
| Table 3. Most common all-listed procedures among the top 5 percent and bottom 95 percent of hospital stays based on total submitted charges, 2008 | ||||||||
| Top 5 percent | Bottom 95 percent | |||||||
|---|---|---|---|---|---|---|---|---|
| Rank | Top 5 all-listed procedures, CCS category | Number of discharges (percentage) | Mean LOS | Mean number comorbidities | Top 5 all-listed procedures, CCS category | Number of discharges (percentage) | Mean LOS | Mean number comorbidities |
| 1 | Blood transfusion | 542,808 (27.8%) | 21.2 | 2.9 | Blood transfusion | 2,182,139 (5.8%) | 6.1 | 2.9 |
| 2 | Respiratory intubation and mechanical ventilation | 532,402 (27.2%) | 26.8 | 2.6 | Prophylactic vaccinations and inoculations | 1,591,344 (4.2%) | 2.9 | 0.2 |
| 3 | Diagnostic cardiac catheterization, coronary arteriography | 257,340 (13.2%) | 12.2 | 2.5 | Cesarean section | 1,372,480 (3.6%) | 3.5 | 0.5 |
| 4 | Enteral and parenteral nutrition | 217,831 (11.1%) | 31.3 | 2.4 | Repair of current obstetric laceration | 1,370,480 (3.6%) | 0.3 | 2.2 |
| 5 | Use of heart-lung machine during surgery | 163,232 (8.3%) | 13.9 | 2.4 | Diagnostic cardiac catheterization, coronary arteriography | 1,263,198 (3.3%) | 3.2 | 2.1 |
| Source: AHRQ, Center for Delivery, Organization, and Markets, Healthcare Cost and Utilization Project, Nationwide Inpatient Sample (NIS), 2008 | ||||||||
| Table 4. Most common principal diagnoses among the top 0.5 percent and top 0.5–1.0 percent of hospital stays based on total submitted charges, 2008 | ||||||||
| Top 0.5 percent | Top 0.5–1.0 percent | |||||||
|---|---|---|---|---|---|---|---|---|
| Rank | Top 5 principal diagnoses, CCS category | Number of discharges (percentage) | Mean LOS | Mean number comorbidities | Top 5 principal diagnoses, CCS category | Number of discharges (percentage) | Mean LOS | Mean number comorbidities |
| 1 | Septicemia | 17,125 (8.8%) | 44.1 | 2.7 | Septicemia | 15,989 (8.2%) | 26.3 | 3.0 |
| 2 | Liveborn infant | 15,913 (8.1%) | 81.8 | 0.5 | Respiratory failure | 10,665 (5.5%) | 31.8 | 3.4 |
| 3 | Respiratory failure | 11,453 (5.9%) | 56.7 | 3.0 | Acute myocardial infarction | 9,018 (4.6%) | 17.3 | 2.5 |
| 4 | Complication of device, implant, or graft | 7,987 (4.1%) | 46.2 | 2.4 | Liveborn infant | 8,674 (4.4%) | 49.0 | 0.3 |
| 5 | Acute cerebrovascular disease | 7,005 (3.6%) | 38.8 | 2.8 | Coronary atherosclerosis | 8,432 (4.3%) | 14.4 | 2.6 |
| Source: AHRQ, Center for Delivery, Organization, and Markets, Healthcare Cost and Utilization Project, Nationwide Inpatient Sample (NIS), 2008 | ||||||||
| Table 5. Most common all-listed procedures among the top 0.5 percent and top 0.5–1.0 percent of hospital stays based on total submitted charges, 2008 | ||||||||
| Top 0-0.5 percent | Top 0.5–1.0 percent | |||||||
|---|---|---|---|---|---|---|---|---|
| Rank | Top 5 all-listed procedures, CCS category | Number of discharges (percentage) | Mean LOS | Mean number comorbidities | Top 5 all-listed procedures, CCS category | Number of discharges (percentage) | Mean LOS | Mean number comorbidities |
| 1 | Respiratory intubation and mechanical ventilation | 111,553 (57.0%) | 52.1 | 2.2 | Respiratory intubation and mechanical ventilation | 82,597 (42.2%) | 28.7 | 2.6 |
| 2 | Blood transfusion | 72,542 (37.1%) | 47.3 | 2.5 | Blood transfusion | 67,922 (34.7%) | 26.0 | 2.8 |
| 3 | Tracheostomy | 46,510 (23.8%) | 55.2 | 2.4 | Enteral and parenteral nutrition | 32,012 (16.4%) | 34.3 | 2.3 |
| 4 | Enteral and parenteral nutrition | 41,034 (21.0%) | 59.2 | 2.0 | Diagnostic cardiac catheterization, coronary arteriography | 25,117 (12.8%) | 17.0 | 2.6 |
| 5 | Bronchoscopy | 32,201 (16.5%) | 47.7 | 2.5 | Bronchoscopy | 21,198 (10.8%) | 27.1 | 2.9 |
| Source: AHRQ, Center for Delivery, Organization, and Markets, Healthcare Cost and Utilization Project, Nationwide Inpatient Sample (NIS), 2008 | ||||||||
| Table 6. Suspiciously high charges in the top 0.5 percent and top 0.5 percent–1.0 percent of hospital stays based on total submitted charges, 2008 | ||
| Suspiciously high charges in Top 0.5 percent | Suspiciously high charges in Top 0.5–1.0 percent | |
|---|---|---|
| Total number of discharges (percent of category discharges) | 23,018 (11.8%) | 26,964 (13.8%) |
| Utilization characteristics | ||
| Mean charges | $638,878 | $262,044 |
| Mean length of stay, days | 16.7 | 6.3 |
| Mean charge per day of stay | $50,059 | $56,879 |
| Patient and hospital characteristics | ||
| Sex (percentage) | ||
| Male | 61.4 | 60.8 |
| Female | 38.6 | 39.1 |
| Age (percentage) | ||
| ‹ 1 year | 2.9 | 0.9 |
| 2–4 years | 0.5 | 0.3 |
| 5–17 years | 3.6 | 3.6 |
| 18–44 years | 17.5 | 13.9 |
| 45–64 years | 39.1 | 39.1 |
| 65–74 years | 20.0 | 23.4 |
| 75–84 years | 13.7 | 16.2 |
| 85+ years | 2.5 | 2.9 |
| Mean age, years | 54.6 | 58.4 |
| Mean number of comborbidities | 2.1 | 2.1 |
| Mortality risk (percentage) | ||
| Minor likelihood of dying | 14.8 | 31.4 |
| Moderate likelihood of dying | 16.8 | 30.4 |
| Major likelihood of dying | 25.0 | 22.4 |
| Extreme likelihood of dying | 43.4 | 15.7 |
| Severity (percentage) | ||
| Minor loss of function | 2.9 | 9.8 |
| Moderate loss of function | 11.1 | 31.4 |
| Major loss of function | 30.4 | 40.0 |
| Extreme loss of function | 55.5 | 18.8 |
| Region (rate per 10,000 population*) | ||
| Northeast | 1.4 | 1.3 |
| Midwest | 0.2 | 0.3 |
| South | 0.3 | 0.4 |
| West | 1.6 | 1.8 |
| Hospital teaching status (percentage) | ||
| Non-teaching | 31.2 | 42.4 |
| Teaching | 68.8 | 57.6 |
| * Denominator data for rates were based on Claritas Population Estimates, 2008. Source: AHRQ, Center for Delivery, Organization, and Markets, Healthcare Cost and Utilization Project, Nationwide Inpatient Sample (NIS), 2008 | ||
|
HCUP Statistical Brief #97; Figure 1. Mortality and severity of the top 0.5 percent, top 0.5 through 1.0 percent of hospital stays based on total submitted charges, 2008. Bar chart; percentage distribution; likelihood of dying (mortality); top 0.5%; minor 15%; moderate, 17%; major, 25%; extreme, 43%. likelihood of dying (mortality); top 0.5 through 1.0%; minor, 31%; moderate, 30%; major, 22%; extreme, 16%.
Loss of function (severity); top 0.5%; minor 3%; moderate, 11%; major, 30%; extreme, 56%. Loss of function (severity); top 0.5 through 1.0%; minor, 10%; moderate, 31%; major, 40%; extreme, 19%. Source: AHRQ, Center for Delivery, Organization, and Markets, Healthcare Cost and Utilization Project, Nationwide Inpatient Sample (NIS), 2008.
|
| Internet Citation: Statistical Brief #97. Healthcare Cost and Utilization Project (HCUP). October 2010. Agency for Healthcare Research and Quality, Rockville, MD. hcup-us.ahrq.gov/reports/statbriefs/sb97.jsp. |
| Are you having problems viewing or printing pages on this website? |
| If you have comments, suggestions, and/or questions, please contact hcup@ahrq.gov. |
| If you are experiencing issues related to Section 508 accessibility of information on this website, please contact hcup@ahrq.gov. |
| Privacy Notice, Viewers & Players |
| Last modified 10/13/10 |