STATISTICAL BRIEF #95
|
|
September 2010
Taressa Fraze, Ph.D., Anne Elixhauser, Ph.D., Laurel Holmquist, M.A., and Jayne Johann, M.B.A.
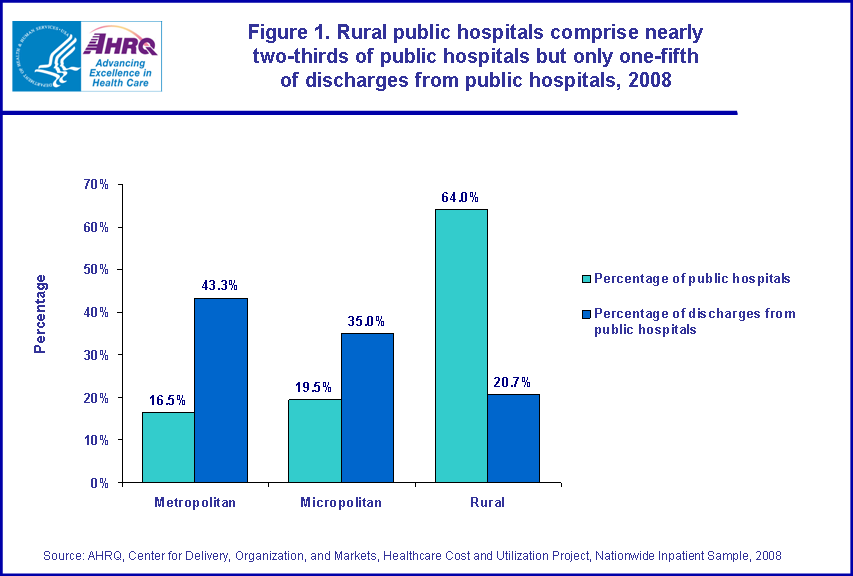
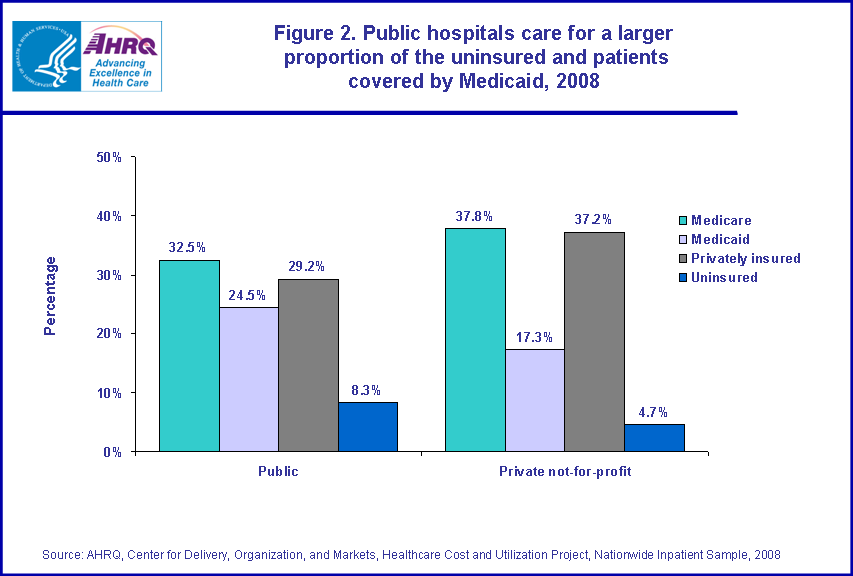
Introduction Public hospitals are owned by governments and play an important role in the healthcare safety net, providing care for patients who may have limited access to care elsewhere. Public hospitals provide care for individuals across the United States: in urban and suburban areas, in small towns, and in rural areas. However, these institutions face unique challenges. Surveys of metropolitan public safety net hospitals suggest that these institutions provide care for a large proportion of patients who have low income, are uninsured, or are covered by Medicaid. They serve a critical role as teaching institutions, and are often the first choice for trauma care. Furthermore, public hospitals provide a large amount of unreimbursed care.1 This Statistical Brief presents data from the Healthcare Cost and Utilization Project (HCUP) regarding short-term, non-federal, acute care public hospitals in 2008.2 Public hospitals are compared with private not-for-profit (NFP) hospitals on facility characteristics, utilization, characteristics of patient stays, and hospital resources. Variations between public hospitals in metropolitan (urban or suburban fringe), micropolitan (small to medium-sized towns), and rural areas are also described. Hospitals are compared on various measures such as characteristics (size, occupancy, affiliation with a system, teaching status, staffing, and services provided). In addition, hospitals are compared on patient characteristics including age, patient complexity, median household income associated with patients’ ZIP Code, expected payer, length of stay, and discharge status. Findings There were 1,131 public hospitals in the U.S., which comprised 21.9 percent of all community hospitals (table 1). Of these public hospitals, 16.5 percent were in metropolitan (urban or suburban) areas, 19.5 percent were in micropolitan areas (small to medium-sized towns), and 64.0 percent were in rural areas (table 2). Public hospitals accounted for 14.1 percent of all stays in 2008 (table 3). Metropolitan public hospitals accounted for 43.3 percent of all public hospital stays, micropolitan public hospitals for 36.0 percent, and rural public hospitals for 20.7 percent (table 4). Figure 1 shows differences between public hospitals by location. Although rural public hospitals account for nearly two-thirds of all public hospitals, they care for only one in five discharges from public hospitals. Characteristics of public hospitals Table 1 compares public hospitals to private not-for-profit (NFP) hospitals and to all community hospitals in 2008. Public hospitals tended to be smaller (approximately 126 beds, compared to 190 beds for private NFP hospitals). Total occupancy rate for public hospitals was slightly less (51.9 percent) than for private NFP hospitals (58.9 percent). The average number of beds in public hospitals varied by location, as shown in table 2. Metropolitan and micropolitan public hospitals (285.0 beds and 211.5 beds, respectively) were larger than rural public hospitals (58.9 beds). Occupancy rates in metropolitan (60.7 percent) and micropolitan public hospitals (59.7 percent) were higher than in rural public hospitals (47.2 percent). Public hospitals were less often parts of multi-hospital systems than private NFP hospitals (26.1 percent versus 61.1 percent, respectively). Rural public hospitals (21.5 percent) were less likely than micropolitan public hospitals (39.3 percent) to be part of multi-hospital systems. Public hospitals were less likely than private NFP hospitals to have an approved residency program (10.7 percent compared to 22.9 percent), an indicator of teaching status. Metropolitan public hospitals were more likely to have an approved residency program (38.6 percent) than those in micropolitan areas (22.3 percent). Overall, only 28.5 percent of public hospitals had hospitalists on staff compared with 50.3 percent in private NFP hospitals. However, this difference was primarily driven by rural hospitals: public hospitals in metropolitan areas and micropolitan areas were more likely to have hospitalists on staff (48.4 and 45.9 percent, respectively) than rural public hospitals (18.1 percent). |
|
Nurse staffing
Public hospitals, in general, had 3.5 nurses (RN and LPN) per 1,000 inpatient days compared with 3.8 nurses per 1,000 inpatient days in private NFP hospitals. However, metropolitan and micropolitan public hospitals (4.2 and 3.8 nurses per 1,000 inpatient days) had more nurses than did rural hospitals (3.2 nurses). This same pattern is reflected in another measure of nurse staffing. While public hospitals as a whole had more patients per nurse (1.4) than private NFP hospitals (1.0), metropolitan public hospitals had the lowest patient-to-nurse ratio (0.8 patients per nurse), micropolitan public hospitals were in the midrange (1.2 patients per nurse), and rural public hospitals had the highest ratio (1.7 patients per nurse). Overall, public hospitals had a lower percentage of RNs among nurses than private NFP hospitals (79.8 percent versus 88.8 percent). Metropolitan and micropolitan public hospitals higher proportions of RNs among licensed nurses (85.6 percent and 84.6 percent) compared to rural public hospitals (76.9 percent). Number of stays in public hospitals Table 3 compares hospital stays in public hospitals to those occurring in private NFP hospitals and all community hospitals. In 2008, there were approximately 39.9 million hospital stays in U.S. community hospitals. Of those, more than 5.6 million (14.1 percent) occurred in public hospitals—substantially fewer than in private NFP hospitals (approximately 29 million, or 72.8 percent of all stays). Table 4 shows hospital stays in public hospitals by location. Metropolitan public hospitals accounted for 2.4 million stays (43.3 percent of all public hospital stays), followed by micropolitan public hospitals (2.0 million stays, 36.0 percent), and rural public hospitals (1.2 million stays, 20.7 percent). Public hospitals had an average of approximately 5,300 stays per year—substantially fewer than in private NFP hospitals (approximately 9,700 stays per year). However, metropolitan and micropolitan public hospitals had the greatest average number of hospitalizations (13,454 and 9,774 stays annually) compared to only 1,765 stays per year on average for rural public hospitals. Characteristics of hospital stays in public hospitals Table 3 shows that stays in public hospitals were slightly longer (4.8 days) than those in private NFP hospitals (4.6 days). Metropolitan public hospitals were on average half a day longer than in micropolitan public hospitals and 1.4 days longer than in rural public hospitals (table 4). Similarly, stays in micropolitan public hospitals were nearly a day longer than rural public hospitals. The proportion of discharges for elderly patients (ages 65 and older) was lower in public hospitals (29.3 percent) than in private NFP hospitals (35.4 percent). However, rural public hospitals had a significantly higher proportion of elderly patients (41.6 percent) compared to public hospitals in metropolitan (22.5 percent) and micropolitan areas (30.4 percent). Public hospitals overall tended to treat patients with lower complexity: slightly fewer patients scored at the highest level of the all-patient refined diagnosis-related group (APR-DRG) severity of illness classification, patients had fewer chronic conditions, and slightly fewer patients underwent at least one therapeutic procedure (table 3). Among public hospitals, those in micropolitan areas tended to treat the most severely ill patients, while rural hospitals treated the least severely ill patients (table 4). Stays in public hospitals were more likely to be for patients residing in low-income areas (34.5 percent) than hospitalizations occurring in private NFP hospitals (25.7 percent), as shown in table 3. Table 4 shows that over half of all patients in rural public hospitals (51.7 percent) were from the lowest income communities. In contrast, 25.9 percent of patients in metropolitan and 35.1 percent of patients in micropolitan public hospitals were from the lowest income communities. Patients in public hospitals were less likely to be discharged to another institution (such as a nursing home or rehabilitation center) than patients in private NFP hospitals (10.2 percent versus 12.8 percent, table 3). However, this varied by location: 13.4 percent of rural public hospital patients were discharged to another institution, compared with 10.7 percent of patients in micropolitan hospitals and only 8.3 percent of patients in metropolitan public hospitals (table 4). Conversely, slightly more stays in public hospitals (2.5 percent) resulted in transfer to another hospital than those in private NFP hospitals (2.1 percent). Again, this varied by location. Patients in rural public hospitals were more than twice as likely (5.1 percent) to be discharged to another short-term hospital than patients in metropolitan and micropolitan public hospitals (1.8 percent and 1.9 percent, respectively). There was no difference between the rate of in-hospital deaths in public and private NFP hospitals, although the death rate in metropolitan public hospitals was lower (1.9 percent) than in rural public hospitals (2.3 percent). Expected payer for public hospital stays As shown in figure 2, nearly one-quarter of patients in public hospitals (24.5 percent) were covered by Medicaid, compared with 17.3 percent in private NFP hospitals. In addition, public hospitals cared for over 75 percent more uninsured patients than did private NFP hospitals (8.3 percent versus 4.7 percent). This pattern was evident especially for public hospitals in metropolitan areas, where 27.7 percent of patients were covered by Medicaid and 10.7 percent were uninsured (table 4). Patients covered by Medicare predominated rural public hospitals (43.8 percent) but accounted for only about a quarter (25.3 percent) of patients in metropolitan public hospitals. Hospital services Table 5 compares public and private NFP hospitals on the types of services provided. There were no differences between public and private NFP hospitals on presence of an emergency department (about 85 percent of both types of hospitals had an ED) or in the provision of hospice care. However, public hospitals were less likely to offer ambulatory surgery, bariatric programs, chemotherapy, rehabilitation, and linguistic/translation services than were private NFP hospitals. Few significant differences were found by public hospital location for these services (table 6), with the exception of bariatric services (which were essentially not provided in rural public hospitals) and chemotherapy which was more commonly provided in metropolitan compared with rural public hospitals. The high technology index is a measure of the adoption of high technology services, such as trauma centers, intensive care units (ICU), magnetic resonance imaging (MRI), and cardiac surgery. As shown in table 5, the high technology index was 2.9 for all public hospitals compared to 3.7 for private NFP hospitals. However, the high technology index differed markedly for public hospitals by location (table 6). Metropolitan and micropolitan public hospitals scored highest at 4.0 and 3.8 respectively—significantly higher than rural public hospitals at 2.4. Among the specific types of high technology services, public hospitals overall were less likely to provide ICU care (both neonatal and medical/surgical), MRI, intensity-modulated radiation therapy (IMRT), and cardiac surgery. Again, these differences were driven by hospital location. Rural public hospitals were less likely than metropolitan and micropolitan hospitals to provide medical/surgical ICU care, MRI, and IMRT. Data Source The estimates in this Statistical Brief are based upon data from the HCUP 2008 Nationwide Inpatient Sample (NIS). The statistics were generated from HCUPnet, a free, online query system that provides users with immediate access to largest set of publicly available, all-payer national, regional, and state-level hospital care databases from HCUP. Hospital characteristics and services are derived from the American Hospital Association’s (AHA) Annual Survey of Hospitals. Additional information regarding AHA data is located online at www.ahadata.com/aha-annual-survey-database. Definitions Types of hospitals included in HCUP HCUP is based on data from community hospitals, defined as short-term, non-federal, general, and other hospitals, excluding hospital units of other institutions (e.g., prisons). HCUP data include OB-GYN, ENT, orthopedic, cancer, pediatric, public, and academic medical hospitals. They exclude long-term care, rehabilitation, psychiatric, and alcoholism and chemical dependency hospitals, but these types of discharges are included if they are from community hospitals. Unit of analysis The unit of analysis for this Statistical Brief is sometimes the hospital and sometimes the hospital discharge (i.e., the hospital stay). Hospital discharges do not reflect individual persons: a person who is admitted to the hospital multiple times in one year will be counted each time as a separate "discharge" from the hospital. Hospital location The classification of whether a hospital is in a large central metropolitan area ("urban"), a fringe county of a large metropolitan area ("suburban"), a small- to medium-sized metropolitan area ("micropolitan"), or non-metropolitan area ("rural"), is as defined using algorithms provided by the National Center for Health Statistics (NCHS). Median community-level income Median community-level income is the median household income of the patient’s ZIP Code of residence. The cut-offs for the quartile designation is determined using ZIP Code demographic data obtained from Claritas. The income quartile is missing for homeless and foreign patients. Payer Payer is the expected primary payer for the hospital stay. To make coding uniform across all HCUP data sources, payer combines detailed categories into more general groups:
Discharge status Discharge status indicates the disposition of the patient at discharge from the hospital, and includes the following six categories: routine (to home), transfer to another short-term hospital, other transfers (including skilled nursing facility, intermediate care, and another type of facility such as a nursing home), home healthcare, against medical advice (AMA), or died in the hospital. Patient complexity Cases with the highest severity of illness are discharges with a score of 3 or 4 on the APR-DRG severity of illness scale. The four severity of illness subclasses are numbered sequentially from 1 to 4 indicating minor, moderate, major, or extreme severity of illness. The determination of severity of illness is disease-specific. Thus, the significance attributed to complicating or comorbid conditions is dependent on the underlying problem. For example, certain types of infections are considered a more significant problem in a patient who is immunosuppressed than in a patient with a fractured arm. In APR-DRGs, high severity of illness is primarily determined by the interaction of multiple diseases. Patients with multiple comorbid conditions involving multiple organ systems represent difficult-to-treat patients who tend to have poor outcomes. The assignment of a patient to a severity of illness subclass takes into consideration not only the level of the secondary diagnoses but also the interaction among secondary diagnoses, age, principal diagnosis, and the presence of certain OR procedures and non-OR procedures. Percentage with at least one major therapeutic procedure: All procedures were determined to be major (i.e., requiring an operating room) or minor and therapeutic or diagnostic based on the Procedure Classes which can be found at: http://www.hcup-us.ahrq.gov/toolssoftware/procedure/procedure.jsp. Percentage on mechanical ventilation was calculated as the percentage of patients in the hospital who have ICD-9-CM procedure codes 96.70–96.72. Mean number of chronic conditions per patient: All diagnoses on all records were determined to be either chronic or non-chronic. The definition of chronic conditions was based on the Chronic Condition Indicator which can be found at: http://www.hcup-us.ahrq.gov/toolssoftware/chronic/chronic.jsp. About HCUP HCUP is a family of powerful healthcare databases, software tools, and products for advancing research. Sponsored by the Agency for Healthcare Research and Quality (AHRQ), HCUP includes the largest all-payer encounter-level collection of longitudinal healthcare data (inpatient, ambulatory surgery, and emergency department) in the United States, beginning in 1988. HCUP is a Federal-State-Industry Partnership that brings together the data collection efforts of many organizations—such as state data organizations, hospital associations, private data organizations, and the Federal government—to create a national information resource. HCUP would not be possible without the contributions of the following data collection Partners from across the United States: Arizona Department of Health Services Arkansas Department of Health California Office of Statewide Health Planning and Development Colorado Hospital Association Connecticut Hospital Association Florida Agency for Health Care Administration Georgia Hospital Association Hawaii Health Information Corporation Illinois Department of Public Health Indiana Hospital Association Iowa Hospital Association Kansas Hospital Association Kentucky Cabinet for Health and Family Services Louisiana Department of Health and Hospitals Maine Health Data Organization Maryland Health Services Cost Review Commission Massachusetts Division of Health Care Finance and Policy Michigan Health & Hospital Association Minnesota Hospital Association Missouri Hospital Industry Data Institute Nebraska Hospital Association Nevada Department of Health and Human Services New Hampshire Department of Health & Human Services New Jersey Department of Health and Senior Services New Mexico Health Policy Commission New York State Department of Health North Carolina Department of Health and Human Services Ohio Hospital Association Oklahoma State Department of Health Oregon Association of Hospitals and Health Systems Pennsylvania Health Care Cost Containment Council Rhode Island Department of Health South Carolina State Budget & Control Board South Dakota Association of Healthcare Organizations Tennessee Hospital Association Texas Department of State Health Services Utah Department of Health Vermont Association of Hospitals and Health Systems Virginia Health Information Washington State Department of Health West Virginia Health Care Authority Wisconsin Department of Health Services Wyoming Hospital Association About the NIS The HCUP Nationwide Inpatient Sample (NIS) is a nationwide database of hospital inpatient stays. The NIS is nationally representative of all community hospitals (i.e., short-term, non-federal, non-rehabilitation hospitals). The NIS is a sample of hospitals and includes all patients from each hospital, regardless of payer. It is drawn from a sampling frame that contains hospitals comprising about 95 percent of all discharges in the United States. The vast size of the NIS allows the study of topics at both the national and regional levels for specific subgroups of patients. In addition, NIS data are standardized across years to facilitate ease of use. About HCUPnet HCUPnet is an online query system that offers instant access to the largest set of all-payer healthcare databases that are publicly available. HCUPnet has an easy step-by-step query system, allowing for tables and graphs to be generated on national and regional statistics, as well as trends for community hospitals in the U.S. HCUPnet generates statistics using data from HCUP's Nationwide Inpatient Sample (NIS), the Kids' Inpatient Database (KID), the Nationwide Emergency Department Sample (NEDS), the State Inpatient Databases (SID) and the State Emergency Department Databases (SEDD). For More Information For more information about HCUP, visit http://www.hcup-us.ahrq.gov. For additional HCUP statistics, visit HCUPnet, our interactive query system, at www.hcup.ahrq.gov. For information on other hospitalizations in the U.S., download HCUP Facts and Figures: Statistics on Hospital-based Care in the United States in 2007, located at http://www.hcup-us.ahrq.gov/reports.jsp. For a detailed description of HCUP, more information on the design of the NIS, and methods to calculate estimates, please refer to the following publications: Steiner, C., Elixhauser, A., Schnaier, J. The Healthcare Cost and Utilization Project: An Overview. Effective Clinical Practice 5(3):143–51, 2002. Introduction to the HCUP Nationwide Inpatient Sample, 2008. Online. May 2010. U.S. Agency for Healthcare Research and Quality. http://hcup-us.ahrq.gov/db/nation/nis/NIS_2008_INTRODUCTION.pdf. Houchens, R., Elixhauser, A. Final Report on Calculating Nationwide Inpatient Sample (NIS) Variances, 2001. HCUP Methods Series Report #2003-2. Online. June 2005 (revised June 6, 2005). U.S. Agency for Healthcare Research and Quality. http://www.hcup-us.ahrq.gov/reports/methods/2003_02.pdf. Suggested Citation Fraze, T. (Thomson Reuters), Elixhauser, A. (Agency for Healthcare Research and Quality), Holmquist, L. (Thomson Reuters), and Johann, J. (Thomson Reuters). Public Hospitals in the United States, 2008. HCUP Statistical Brief #95. September 2010. Agency for Healthcare Research and Quality, Rockville, MD. http://www.hcup-us.ahrq.gov/reports/statbriefs/sb95.pdf. Acknowledgments The authors would like to acknowledge Emily Wilson, Lauren Wier, and Erin Bagalman for their assistance on this Brief. *** AHRQ welcomes questions and comments from readers of this publication who are interested in obtaining more information about access, cost, use, financing, and quality of healthcare in the United States. We also invite you to tell us how you are using this Statistical Brief and other HCUP data and tools, and to share suggestions on how HCUP products might be enhanced to further meet your needs Please e-mail us at hcup@ahrq.gov or send a letter to the address below: Irene Fraser, Ph.D., Director Center for Delivery, Organization, and Markets Agency for Healthcare Research and Quality 540 Gaither Road Rockville, MD 20850 1 Zaman O.S., Cummings L.C., Spieler S.S. America’s Public Hospitals and Health Systems, 2008: Results of the Annual NAPH Hospital Characteristics Survey. National Association of Public Hospitals and Health Systems, February 2010. http://essentialhospitals.org/wp-content/uploads/2013/12/NPH214.pdf 2 Veterans Administration, Department of Defense, and Indian Health Service hospitals are not included in these analyses. |
| Table 1. Characteristics of public hospitals compared to private not-for-profit hospitals and all hospitals, U.S. community hospitals, 2008 | |||
| Public hospitals† | Private not-for-profit hospitals | All community hospitals | |
|---|---|---|---|
| Number of hospitals | 1,131 | 2,944 | 5,162 |
| Percentage of all community hospitals | 21.9 | 57.0 | 100.0 |
| Number of beds (mean) | 125.9 | 190.4 | 159.4 |
| Total occupancy rate (percentage) | 51.9 | 58.9 | 55.8 |
| Hospital is part of multi-hospital system (percentage) | 26.1 | 61.1 | 57.2 |
| Residency program approved by the American College of Graduate Medical Education (percentage) | 10.7 | 22.9 | 16.7 |
| Hospitalists provide care (percentage) | 28.5 | 50.3 | 41.2 |
| Number of nurses (RN and LPN) per 1,000 inpatient days | 3.5 | 3.8 | 4.0 |
| Number of patients per nurse | 1.4 | 1.0 | 1.0 |
| Proportion of RNs among licensed nurses (percentage) | 79.8 | 88.8 | 85.9 |
| Source: AHRQ, Center for Delivery, Organization, and Markets, Healthcare Cost and Utilization Project, Nationwide Inpatient Sample, 2008 and the American Hospital Association Annual Survey of Hospitals, 2008 † Using a Z-test, all differences from private, not-for-profit hospitals are significant at p‹ 0.05. | |||
| Table 2. Characteristics of public hospitals, by location, 2008 | |||
| Public hospitals in metropolitan areas | Public hospitals in micropolitan areas | Public hospitals in rural areas | |
|---|---|---|---|
| Number of hospitals | 187 | 220 | 724 |
| Percentage of all public hospitals | 16.5 | 19.5 | 64.0 |
| Percentage of all community hospitals | 3.6 | 4.3 | 14.0 |
| Number of beds (mean) | 285.0c | 211.5b | 58.9b,c |
| Total occupancy rate (percentage) | 60.7c | 59.7b | 47.2b,c |
| Hospital is part of multi-hospital system (percentage) | 28.0 | 39.3b | 21.5b |
| Residency program approved by the American College of Graduate Medical Education (percentage) | 38.6a | 22.3a | — |
| Hospitalists provide care (percentage) | 48.4c | 45.9b | 18.1b,c |
| Number of nurses (RN and LPN) per 1,000 inpatient days | 4.2c | 3.8b | 3.2b,c |
| Number of patients per nurse | 0.8a,c | 1.2a | 1.7c |
| Proportion of RNs among licensed nurses (percentage) | 85.6c | 84.6b | 76.9b,c |
| Source: AHRQ, Center for Delivery, Organization, and Markets, Healthcare Cost and Utilization Project, Nationwide Inpatient Sample, 2008 and the American Hospital Association Annual Survey of Hospitals, 2008 a Using a Z-test, metropolitan hospitals are significantly different from micropolitan hospitals at p‹0.05. b Using a Z-test, micropolitan hospitals are significantly different from rural hospitals at p‹ 0.05. c Using a Z-test, metropolitan hospitals are significantly different from rural hospitals at p‹ 0.05. –Estimates are too small to be reported with reliability. | |||
| Table 3. Characteristics of hospital stays in public hospitals, compared to private not-for-profit hospitals and all U.S. community hospitals 2008 | |||
| Public hospitals | Private not-for-profit hospitals | All community hospitals | |
|---|---|---|---|
| Total number of stays | 5,618,500 | 29,028,300 | 39,885,100 |
| Percentage of all stays | 14.1 | 72.8 | 100.0 |
| Mean annual number of stays | 5,300† | 9,700 | 7,700 |
| Mean length of stay, days | 4.8† | 4.6 | 4.6 |
| Age group (percentage) | |||
| Under 18, excl. newborn | 6.7 | 5.3 | 5.3 |
| 18–44 | 28.0† | 24.9 | 25.1 |
| 45–64 | 24.3 | 23.8 | 23.8 |
| 65–74 | 11.8† | 13.2 | 13.2 |
| 75–84 | 11.1† | 14.0 | 13.8 |
| 85+ | 6.4† | 8.2 | 8.0 |
| Highest severity of illness (percentage) | 24.9† | 26.6 | 26.3 |
| Mean number of chronic conditions | 3.3† | 3.8 | 3.7 |
| Mechanical ventilation (percentage) | 2.9 | 2.6 | 2.7 |
| One or more therapeutic procedures (percentage) | 42.8† | 44.9 | 44.7 |
| Patients from the lowest income ZIP Codes (percentage) | 34.5† | 25.7 | 27.6 |
| Discharged to another institution (nursing home, rehab) (percentage) | 10.2† | 12.8 | 12.6 |
| Discharged to another short-term hospital (percentage) | 2.5† | 2.1 | 2.2 |
| In-hospital deaths | 2.1 | 2.0 | 2.0 |
| Primary expected payer (percentage) | |||
| Medicare | 32.5† | 37.8 | 37.4 |
| Medicaid | 24.5† | 17.3 | 18.4 |
| Private | 29.2† | 37.2 | 35.4 |
| Uninsured | 8.3† | 4.7 | 5.3 |
| Source: AHRQ, Center for Delivery, Organization, and Markets, Healthcare Cost and Utilization Project, Nationwide Inpatient Sample, 2008 † Using a Z-test, difference from private, not-for-profit hospitals is significant at p‹ 0.05. | |||
| Table 4. Characteristics of hospital stays in public hospitals, by location, 2008 | |||
| Public hospitals in metropolitan areas | Public hospitals in micropolitan areas | Public hospitals in rural areas | |
|---|---|---|---|
| Total number of stays | 2,433,100/td> | 2,020,600 | 1,164,800 |
| Percentage of all stays | 6.1 | 5.1 | 2.9 |
| Percentage of all public hospital stays | 43.3 | 36.0 | 20.7 |
| Mean annual number of stays | 13,454c | 9,774b | 1,765b,c |
| Mean length of stay, days | 5.3a,c | 4.8a,b | 3.9b,c |
| Age group (percentage) | |||
| Under 18, excl. newborn | 6.7 | 7.5b | 5.1b |
| 18–44 | 31.8a,c | 26.7a,b | 22.2b,c |
| 45–64 | 26.2c | 24.0b | 20.8b,c |
| 65–74 | 9.8a,c | 12.9a | 14.1c |
| 75–84 | 8.1a,c | 11.6a,b | 16.3b,c |
| 85+ | 4.6c | 5.9b | 11.2b,c |
| Highest severity of illness (percentage) | 25.1c | 27.0b | 20.7b,c |
| Mean number of chronic conditions | 3.1 | 3.5 | 3.3 |
| Mechanical ventilation (percentage) | 3.2c | 3.5b | 1.2b,c |
| One or more therapeutic procedures (percentage) | 40.5a,c | 44.8a | 44.0c |
| Patients from the lowest income ZIP Codes (percentage) | 25.9 | 35.1b | 51.7b |
| Discharged to another institution (nursing home, rehab) (percentage) | 8.3a,c | 10.7a,b | 13.4b,c |
| Discharged to another short-term hospital | 1.8c | 1.9b | 5.1b,c |
| In-hospital deaths | 1.9c | 2.2 | 2.3c |
| Primary expected payer (percentage) | |||
| Medicare | 25.3a,c | 34.6a,b | 43.8b,c |
| Medicaid | 27.7c | 23.3 | 20.1c |
| Private | 30.1 | 29.8 | 26.4 |
| Uninsured | 10.7 | 6.9 | 5.8 |
| Source: AHRQ, Center for Delivery, Organization, and Markets, Healthcare Cost and Utilization Project, Nationwide Inpatient Sample, 2008 a Using a Z-test, metropolitan hospitals are significantly different from micropolitan hospitals at p‹ 0.05. b Using a Z-test, micropolitan hospitals are significantly different from rural hospitals at p‹ 0.05. c Using a Z-test, metropolitan hospitals are significantly different from rural hospitals at p‹ 0.05. | |||
| Table 5. Hospital services offered in public hospitals, compared to private not-for-profit hospitals and all U.S. community hospitals, 2008 | |||
| Public hospitals | Private not-for-profit hospitals | All community hospitals | |
|---|---|---|---|
| Emergency department, % | 84.7 | 84.3 | 78.6 |
| Ambulatory surgery services, % | 78.6† | 84.5 | 77.5 |
| Bariatric/weight control program, % | 13.9† | 27.5 | 22.4 |
| Chemotherapy services, % | 41.0† | 57.2 | 47.6 |
| Rehabilitation unit, % | 21.7† | 28.4 | 24.5 |
| Hospice care, % | 22.7 | 26.1 | 21.1 |
| Linguistic/translation services, % | 41.8† | 57.7 | 48.7 |
| High technology index* | 2.9 | 3.7 | 3.3 |
| Trauma center, % | 28.5 | 33.0 | 28.0 |
| Medical-surgical ICU, % | 52.3† | 66.9 | 59.3 |
| Neonatal ICU, % | 12.9† | 20.0 | 17.8 |
| Computerized tomography (CT) scanner, % | 82.1 | 84.4 | 78.3 |
| Magnetic resonance imaging (MRI) , % | 54.9† | 66.0 | 59.1 |
| Intensity-modulated radiation therapy (IMRT) , % | 14.8† | 26.7 | 20.2 |
| Cardiac catheterization services, % | 84.3 | 86.9 | 82.5 |
| Cardiac surgery services, % | 13.9† | 27.5 | 22.4 |
| Transplant services, % | 6.8 | 7.6 | 7.0 |
| Source: AHRQ, Center for Delivery, Organization, and Markets, Healthcare Cost and Utilization Project, Nationwide Inpatient Sample, 2008 and the American Hospital Association Annual Survey of Hospitals, 2008 †Using a Z-test, difference from private, not-for-profit hospitals is significant at p‹ 0.05. * The high technology index is defined as a sum of the following services (maximum score=9): Neonatal ICU, computerized tomography (CT) scanner, magnetic resonance imaging (MRI), positron emission tomography (PET), cardiac catheterization services (adult or pediatric, diagnostic or interventional), cardiac surgery services (adult or pediatric), transplant services (bone marrow, heart, kidney, liver, lung, or other), intensity-modulated radiation therapy (IMRT), and extracorporeal shock-wave lithotripsy (ESWL). | |||
| Table 6. Hospital services offered in public hospitals, by location, 2008 | |||
| Public hospitals in metropolitan areas | Public hospitals in micropolitan areas | Public hospitals in rural areas | |
|---|---|---|---|
| Emergency department, % | 79.4 | 89.2 | 84.6 |
| Ambulatory surgery services, % | 79.4 | 87.1 | 75.9 |
| Bariatric/weight control program, % | 40.7 | 26.1 | — |
| Chemotherapy services, % | 54.1c | 45.8 | 36.1c |
| Rehabilitation unit, % | 25.8 | 26.2 | 19.4 |
| Hospice care, % | — | 22.2 | 24.0 |
| Linguistic/translation services, % | 48.6 | 50.3 | 37.5 |
| High technology index* | 4.0c | 3.8b | 2.4b,c |
| Trauma center, % | 33.2 | 34.7 | 25.3 |
| Medical-surgical ICU, % | 74.2c | 67.4b | 42.0b,c |
| Neonatal ICU, % | 32.5 | 28.0 | — |
| Computerized tomography (CT) scanner, % | 79.4 | 87.1 | 81.3 |
| Magnetic resonance imaging (MRI) , % | 74.3c | 69.6b | 45.5b,c |
| Intensity-modulated radiation therapy (IMRT) , % | 30.5c | 26.0b | 7.3b,c |
| Cardiac catheterization services, % | 79.4 | 89.4 | 84.0 |
| Cardiac surgery services, % | 40.3 | 25.9 | — |
| Transplant services, % | 20.4 | — | — |
| Source: AHRQ, Center for Delivery, Organization, and Markets, Healthcare Cost and Utilization Project, Nationwide Inpatient Sample, 2008 and the American Hospital Association Annual Survey of Hospitals, 2008 a Using a Z-test, metropolitan hospitals are significantly different from micropolitan hospitals at p‹ 0.05. b Using a Z-test, micropolitan hospitals are significantly different from rural hospitals at p‹ 0.05. c Using a Z-test, metropolitan hospitals are significantly different from rural hospitals at p‹ 0.05. –Estimates are too small to be reported with reliability. | |||
|
Figure 1. Rural public hospitals comprise nearly two-thirds of public hospitals but only one-fifth of discharges from public hospitals, 2008. Bar chart; In metropolitan areas, 16.5 percent of hospitals are public; 43.3 percent of discharges are from public hospitals. In micropolitan areas, 19.5 percent of hospitals are public; 35.0 percent of discharges are from public hospitals. In rural areas, 64.0 percent of hospitals are public; 20.7 percent of discharges are from public hospitals. Source: AHRQ, Center for Delivery, Organization, and Markets, Healthcare Cost and Utilization Project, Nationwide Inpatient Sample, 2008.
Figure 2. Public hospitals care for a larger proportion of the uninsured and patients covered by Medicaid, 2008. Bar chart; In public hospitals: 32.5% of coverage was Medicare, 24.5% of coverage was Medicaid, 29.2% of coverage was Privately insured, 8.3% of coverage was Uninsured. In private not-for-profit hospitals: 37.8% of coverage was Medicare, 17.3% of coverage was Medicaid, 37.2% of coverage was Privately insured, 4.7% of coverage was Uninsured. Source: AHRQ, Center for Delivery, Organization, and Markets, Healthcare Cost and Utilization Project, Nationwide Inpatient Sample, 2008.
|