
|
STATISTICAL BRIEF #307
April 2024
H. Joanna Jiang, Ph.D., and Marguerite L. Barrett, M.S. IntroductionOverall hospital utilization decreased substantially during the COVID-19 pandemic because of both patient and system factors. These included delays in seeking care, stay-at-home orders, and a pause in elective admissions.1 2 Nevertheless, the 30-day all-cause hospital readmission rate remained stable in 2020 compared with the prepandemic period.3 Therefore, it is important to identify the clinical conditions associated with frequent, costly hospital readmissions during the pandemic year 2020. This would help us determine whether the disruptions of the early pandemic affected the conditions linked to most readmissions before the pandemic.4 This Healthcare Cost and Utilization Project (HCUP) Statistical Brief presents national estimates on clinical conditions with the highest hospital readmission counts, rates, and costs among adults (aged 18 years and older) using the 2020 Nationwide Readmissions Database (NRD). A readmission was defined as a hospital admission for any cause within 30 days of an initial stay (index admission) between January and November 2020. Three readmission metrics are presented by expected payer: (1) conditions with the highest number of readmissions, (2) conditions with the highest readmission rate, and (3) conditions with the highest average readmission cost. Expected payer and condition (principal diagnosis) are based on the index admission. Index admissions for cancer and cancer-related therapies are included in overall readmission statistics but are not reported in condition-specific statistics. Readmissions for cancer and cancer-related treatments are more likely to be planned and expected than are other conditions. Because of the large sample size of the NRD data, small differences can be statistically significant. Thus, only differences greater than or equal to 10 percent are discussed in this Statistical Brief. |
Highlights
|
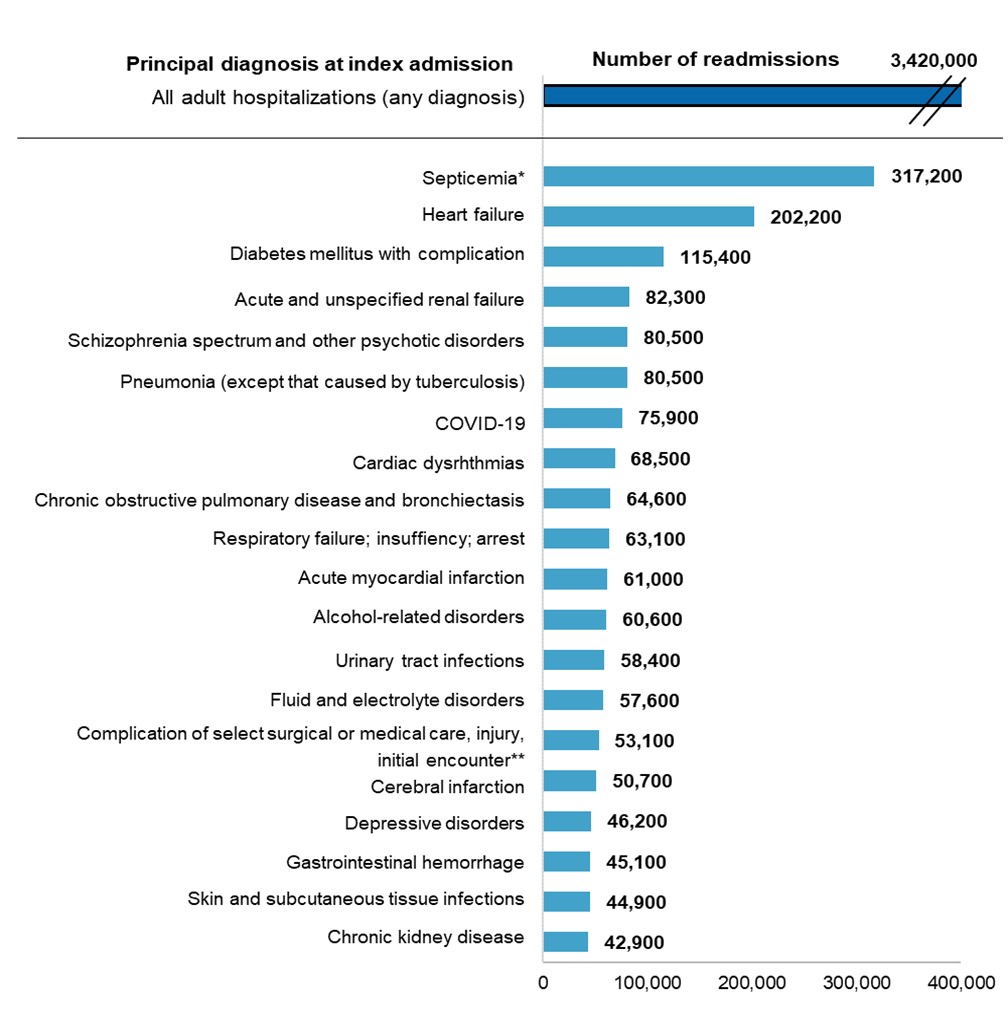
Figure 1. Top 20 principal diagnoses with the highest number of 30-day all-cause adult hospital readmissions, 2020
Notes: Diagnoses are grouped using the Clinical Classifications Software Refined (CCSR) for
ICD-10-CM Diagnoses. CCSR categories classified as "neoplasms" (cancer) or "factors influencing health status
and contact with health services" (e.g., encounter for antineoplastic therapies) are excluded from reporting. //
indicates a break in the axis. Number of readmissions is rounded to the nearest hundred.
* The CCSR for septicemia includes all sepsis infection codes and does not include the criteria of
organ dysfunction.
** This includes complications, such as infection, for surgical or medical care other than those from
cardiovascular, genitourinary, or internal orthopedic devices or from organ/tissue transplants.
Source: Agency for Healthcare Research and Quality (AHRQ), Healthcare Cost and Utilization Project (HCUP),
Nationwide Readmissions Database (NRD), 2020.
Hospital stays for septicemia had the highest number of 30-day all-cause readmissions (317,200) in 2020, accounting for 11.4 percent of all adult readmissions. Stays for heart failure and diabetes with complications had the second and the third highest number of readmissions (202,200 and 115,400, respectively).
Adult hospitalizations for COVID-19 in 2020 had 75,900 30-day all-cause readmissions, making it the seventh highest among the top 10 conditions at index admission with the highest number of readmissions.
Among the top 20 principal diagnoses at index admission associated with the highest number of readmissions,
four circulatory system diseases—heart failure, cardiac dysrhythmias, acute myocardial infarction, and
cerebral infarction—constituted 13.7 percent of all adult readmissions. Three respiratory conditions
at index admission—pneumonia, chronic obstructive pulmonary disease (COPD), and respiratory
failure—accounted for another
7.5 percent of readmissions. Three genitourinary conditions at index admission—acute and unspecified
renal failure, urinary tract infections, and chronic kidney disease—accounted for 6.6 percent of
readmissions. Three mental and substance use disorders—schizophrenia, depressive disorders, and
alcohol-related disorders—accounted for 6.7 percent of readmissions.
Notably, hospital stays for five conditions—heart failure, diabetes with complications, pneumonia, COPD, and urinary tract infection—can be considered potentially preventable according to the Agency for Healthcare Research and Quality (AHRQ) Prevention Quality Indicators.5 These five conditions at index admission accounted for nearly one in five readmissions (18.7%).
Table 1 presents the five conditions at index admission with the highest number of 30-day all-cause hospital readmissions among adults by expected payer in 2020.
Table 1. Top five principal diagnoses with the highest number of 30-day all-cause adult hospital readmissions, by expected payer, 2020
| Principal diagnosis (at index admission) | Number of index admissions | 30-day readmissions | Percentage of total payer-specific readmissions | ||
| Rank | Number | Rate† | |||
| Medicare | 11,784,200 | – | 2,002,700 | 17.0 | 100.0 |
| Septicemia* | 1,120,500 | 1 | 207,300 | 18.5 | 10.4 |
| Heart failure | 661,300 | 2 | 147,800 | 22.4 | 7.4 |
| Acute and unspecified renal failure | 297,300 | 3 | 60,000 | 20.2 | 3.0 |
| Pneumonia (except that caused by tuberculosis) | 335,900 | 4 | 58,900 | 17.5 | 2.9 |
| Diabetes mellitus with complication | 264,400 | 5 | 58,700 | 22.2 | 2.9 |
| Medicaid | 4,948,400 | – | 693,300 | 14.0 | 100.0 |
| Septicemia* | 294,800 | 1 | 54,200 | 18.4 | 7.8 |
| Schizophrenia spectrum and other psychotic disorders | 163,500 | 2 | 37,800 | 23.1 | 5.5 |
| Diabetes mellitus with complication | 143,000 | 3 | 33,000 | 23.1 | 4.8 |
| Heart failure | 113,800 | 4 | 31,400 | 27.6 | 4.5 |
| Alcohol-related disorders | 129,700 | 5 | 29,500 | 22.8 | 4.3 |
| Private insurance | 5,962,500 | – | 521,200 | 8.7 | 100.0 |
| Septicemia* | 314,300 | 1 | 39,600 | 12.6 | 7.6 |
| Heart failure | 85,500 | 2 | 14,600 | 17.1 | 2.8 |
| Diabetes mellitus with complication | 108,800 | 3 | 14,000 | 12.9 | 2.7 |
| Hypertension and hypertensive-related conditions complicating pregnancy, childbirth, and the puerperium | 194,100 | 4 | 12,100 | 6.2 | 2.3 |
| COVID-19 | 180,900 | 5 | 10,600 | 5.9 | 2.0 |
| Self-pay/No charge‡ | 1,013,200 | – | 122,400 | 12.1 | 100.0 |
| Septicemia* | 74,500 | 1 | 9,600 | 12.9 | 7.8 |
| Alcohol-related disorders | 40,600 | 2 | 7,600 | 18.7 | 6.2 |
| Diabetes mellitus with complication | 43,500 | 3 | 7,200 | 16.4 | 5.9 |
| Depressive disorders | 36,900 | 4 | 5,200 | 14.0 | 4.2 |
| Schizophrenia spectrum and other psychotic disorders | 26,700 | 5 | 4,800 | 18.0 | 3.9 |
Among adult hospitalizations with an expected payer of Medicare, septicemia had the highest number of readmissions (207,300) in 2020, accounting for 10.4 percent of adult Medicare readmissions. Septicemia was also the top condition with the highest number of readmissions for stays with an expected payer of Medicaid (54,200), private insurance (39,600), or self-pay/no charge (9,600), constituting nearly 8 percent of all adult readmissions for each of these expected payers.
Heart failure was among the five conditions with the highest number of 30-day all-cause readmissions for stays with an expected payer of Medicare (accounting for 7.4% of all adult Medicare readmissions), Medicaid (4.5%), or private insurance (2.8%). It was also a condition with the highest readmission rates—Medicare: 22.4 per 100 index admissions; Medicaid: 27.6; and private insurance: 17.1. Diabetes with complications was another condition with the highest number and rate of readmissions for each of these expected payers and for self-pay/no charge.
Among adult hospitalizations with an expected payer of Medicaid, schizophrenia at index admission ranked the second highest and alcohol-related disorders ranked the fifth highest in 30-day all-cause readmissions. Likewise, for adult hospitalizations with an expected payer of self-pay/no charge, alcohol-related disorders at index admission ranked the second highest and schizophrenia ranked the fifth highest in number of readmissions. Both conditions also had one of the highest readmission rates—schizophrenia: 23.1 and 18.0 per 100 index admissions, respectively, for stays with an expected payer of Medicaid or self-pay/no charge; and alcohol-related disorders: 22.8 and 18.7 per 100 index admissions, respectively, for stays with an expected payer of Medicaid or self-pay/no charge.
Notably, behavioral health conditions were three of the top five conditions with the highest number of readmissions with an expected payer of self-pay/no charge: alcohol-related disorders, depressive disorders, and schizophrenia.
Conditions with the highest rate of adult hospital readmissions, 2020
Figure 2 presents the 20 conditions at index admission with the highest rate of 30-day all-cause hospital readmissions
among adults in 2020.
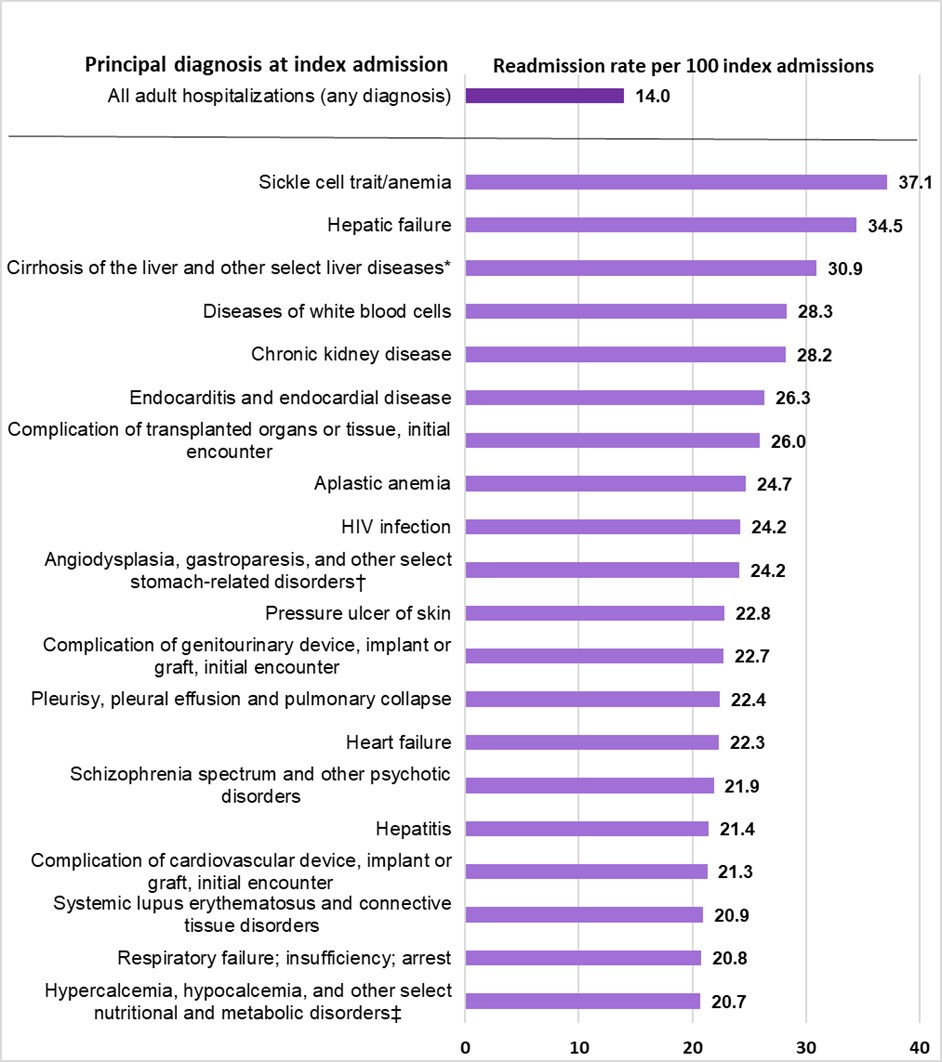
Figure 2. Top 20 principal diagnoses with the highest rate of 30-day all-cause adult readmissions, 2020
Notes: Diagnoses are grouped using the Clinical Classifications Software Refined (CCSR) for
ICD-10-CM Diagnoses. Principal diagnosis is assigned to a single default CCSR category. CCSR categories
classified as "neoplasms" (cancer) or "factors influencing health status and contact with health services"
(e.g., encounter for antineoplastic therapies) are excluded from reporting. A minimum volume threshold of 10,000
index admissions was required for a CCSR category to be reported.
* This primarily includes cirrhosis of the liver as well as other liver diseases, excluding hepatic
failure.
† This primarily includes angiodysplasia of the stomach and duodenum, gastroparesis, and adult
hypertrophic pyloric stenosis, as well as other select disorders of the stomach and duodenum.
‡ This primarily includes hypercalcemia, hypocalcemia, hypomagnesemia, and organ-limited amyloidosis as
well as other select nutritional and metabolic disorders.
Source: Agency for Healthcare Research and Quality (AHRQ), Healthcare Cost and Utilization Project (HCUP),
Nationwide Readmissions Database (NRD), 2020.
Hospital stays for sickle cell trait/anemia had the highest 30-day all-cause readmission rate (37.1 per 100 index admissions), which was nearly three times as high as the average readmission rate for all adult stays (14.0 per 100 index admissions). Another two conditions related to blood and immune system disorders also had the highest readmission rates—diseases of white blood cells (28.3 per 100 index admissions) and aplastic anemia (24.7 per 100 index admissions).
Hepatic failure at index admission had the second highest readmission rate (34.5 per 100 index admissions) among adult hospitalizations, followed by stays for cirrhosis of the liver (30.9 per 100 index admissions). Stays for hepatitis also had one of the highest readmission rates (21.4 per 100 index admissions), albeit lower than those for the other two conditions.
More than one in four adult hospitalizations for chronic kidney disease (28.2 per 100 index admissions), endocarditis and endocardial disease (26.3 per 100 index admissions), and complications of transplanted organs or tissues (26.0 per 100 index admissions) had subsequent readmissions within 30 days of discharge. About one in five hospital stays for heart failure (22.3 per 100 index admissions); pleurisy and pulmonary collapse (22.4 per 100 index admissions); respiratory failure (20.8 per 100 index admissions); and complications of genitourinary or of cardiovascular device, implant, or graft had 30-day all-cause readmissions (22.7 and 21.3 per 100 index admissions, respectively).
Table 2 presents the five conditions at index admission with the highest rate of 30-day all-cause hospital readmissions among adults by expected payer in 2020.
Table 2. Top five principal diagnoses with the highest rate of 30-day all-cause adult readmissions, by expected payer, 2020
| Principal diagnosis (at index admission) | Number of index admissions | 30-day readmissions | ||
| Rank | Rate* | Number | ||
| Medicare | 11,784,200 | – | 17.0 | 2,002,700 |
| Sickle cell trait/anemia | 21,800 | 1 | 37.7 | 8,200 |
| Hepatic failure | 34,800 | 2 | 34.3 | 11,900 |
| Cirrhosis of the liver and other select liver diseases† | 43,600 | 3 | 30.5 | 13,300 |
| Chronic kidney disease | 110,000 | 4 | 28.5 | 31,400 |
| Complication of transplanted organs or tissue, initial encounter | 29,600 | 5 | 26.4 | 7,800 |
| Medicaid | 4,948,400 | – | 14.0 | 693,300 |
| Sickle cell trait/anemia | 30,400 | 1 | 41.0 | 12,500 |
| Hepatic failure | 17,000 | 2 | 37.5 | 6,400 |
| Cirrhosis of the liver and other select liver diseases† | 35,300 | 3 | 35.0 | 12,300 |
| Chronic kidney disease | 21,500 | 4 | 33.1 | 7,100 |
| Complication of transplanted organs or tissue, initial encounter | 16,800 | 5 | 27.9 | 4,700 |
| Private insurance | 5,962,500 | – | 8.7 | 521,200 |
| Hepatic failure | 12,100 | 1 | 32.9 | 4,000 |
| Cirrhosis of the liver and other select liver diseases† | 25,000 | 2 | 27.2 | 6,800 |
| Complication of transplanted organs or tissue, initial encounter | 11,800 | 3 | 24.6 | 2,900 |
| Complication of genitourinary device, implant or graft, initial encounter | 10,800 | 4 | 20.6 | 2,200 |
| Chronic kidney disease | 15,400 | 5 | 19.7 | 3,000 |
| Self-pay/No charge‡ | 1,013,200 | – | 12.1 | 122,400 |
| Cirrhosis of the liver and other select liver diseases† | 8,800 | 1 | 27.9 | 2,400 |
| Alcohol-related disorders | 40,600 | 2 | 18.7 | 7,600 |
| Schizophrenia spectrum and other psychotic disorders | 26,700 | 3 | 18.0 | 4,800 |
| Heart failure | 26,800 | 4 | 17.0 | 4,500 |
| Hepatitis | 5,600 | 5 | 16.9 | 900 |
Hospital stays for sickle cell trait/anemia had the highest readmission rate among patients with Medicare or Medicaid coverage. The rate was higher for stays with an expected payer of Medicaid than for stays with an expected payer of Medicare (41.0 vs. 37.7 per 100 index admissions).
The 30-day all-cause readmission rate for cirrhosis of the liver ranked the third highest among patients with an expected payer of Medicare or Medicaid, the second highest among patients with an expected payer of private insurance, and the highest among patients with an expected payer of self-pay/no charge. Across payers, the readmission rate was highest for stays with an expected payer of Medicaid (35.0 per 100 index admissions), followed by stays with an expected payer of Medicare (30.5 per 100 index admissions). Both rates were higher than those for stays with an expected payer of private insurance (27.2 per 100 index admissions) or self-pay/no charge (27.9 per 100 index admissions).
Hospital stays for hepatic failure had the second highest readmission rate among patients with an expected payer of Medicare or Medicaid but the highest among patients with an expected payer of private insurance. The readmission rate was higher for stays with an expected payer of Medicaid (37.5 per 100 index admissions) than for those with an expected payer of Medicare (34.3) or private insurance (32.9). Likewise, the readmission rate for chronic kidney disease was higher for stays with an expected payer of Medicaid (33.1 per 100 index admissions) than for those with an expected payer of Medicare (28.5) or private insurance (19.7). Complications of transplanted organs or tissue had higher readmission rates for stays with an expected payer of Medicaid (27.9 per 100 index admissions) or Medicare (26.4) than for stays with an expected payer of private insurance (24.6).
Among hospital stays with an expected payer of self-pay/no charge, nearly one in five stays for alcohol-related disorders (18.7 per 100 index admissions), schizophrenia (18.0), and heart failure (17.0) had 30-day all-cause readmissions after discharge of the index stay.
Conditions with the highest average cost of adult hospital readmissions, 2020
Figure 3 presents the 20 conditions at index admission with the highest average cost of 30-day all-cause hospital
readmissions among adults in 2020.
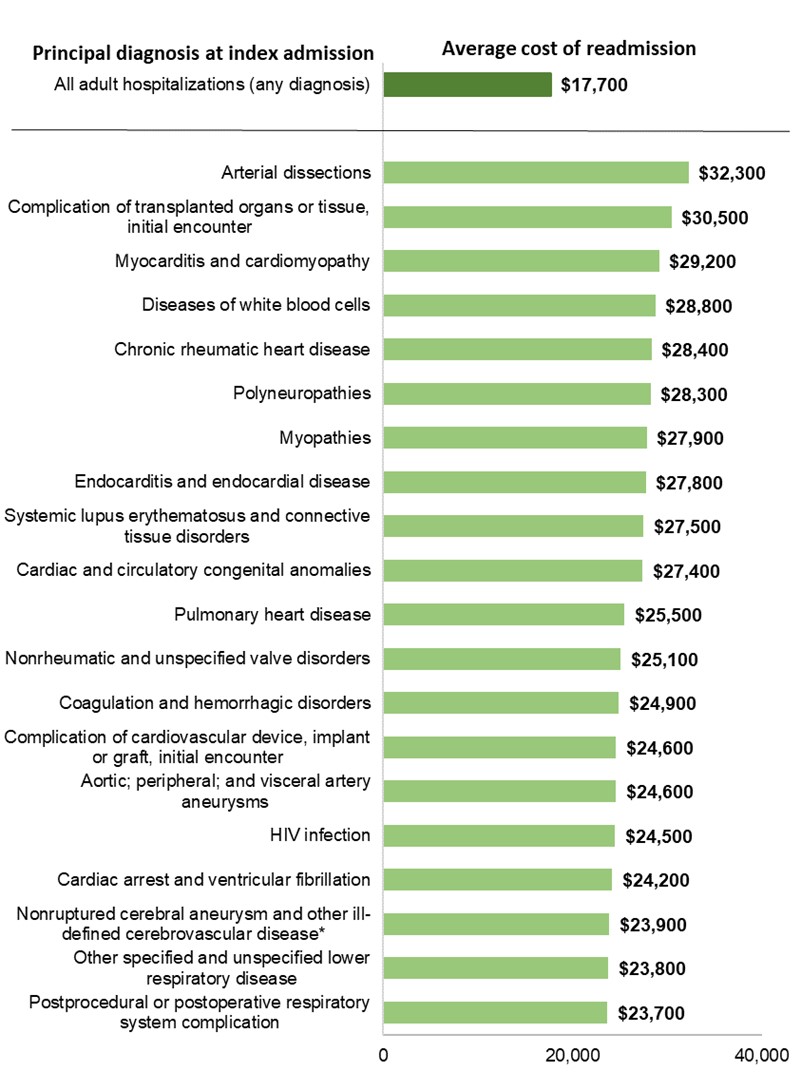
Figure 3. Top 20 principal diagnoses with the highest average cost of 30-day all-cause adult readmissions, 2020
Notes: Diagnoses are grouped using the Clinical Classifications Software Refined (CCSR) for
ICD-10-CM Diagnoses. CCSR categories classified as "neoplasms" (cancer) or "factors influencing health status
and contact with health services" (e.g., encounter for antineoplastic therapies) are excluded from reporting. A
minimum volume threshold of 10,000 index admissions was required for a CCSR category to be reported. Average
cost of readmission is rounded to the nearest $100. Costs reflect the actual expenses incurred in the production
of hospital services.
* This primarily includes nonruptured cerebral aneurysm and posterior reversible encephalopathy, as
well as other select and ill-defined cerebrovascular diseases.
Source: Agency for Healthcare Research and Quality (AHRQ), Healthcare Cost and Utilization Project (HCUP),
Nationwide Readmissions Database (NRD), 2020.
The average cost of 30-day all-cause readmissions after an index stay for arterial dissections was $32,300, the highest among adult readmissions. It was nearly 1.8 times higher than the average cost of all adult readmissions ($17,700). Complications of transplanted organs or tissue ranked the second highest in average cost of readmissions ($30,500).
Of the top 20 conditions at index admission with the highest average readmission cost, 11 involved circulatory system diseases: arterial dissections ($32,300); myocarditis and cardiomyopathy ($29,200); chronic rheumatic heart disease ($28,400); endocarditis and endocardial disease ($27,800); cardiac and circulatory congenital anomalies ($27,400); pulmonary heart disease ($25,500); nonrheumatic and unspecified valve disorders ($25,100); complications of cardiovascular device, implant, or graft ($24,600); artery aneurysms ($24,600); cardiac arrest and ventricular fibrillation ($24,200); and nonruptured cerebral aneurysm ($23,900).
Table 3 presents the five conditions at index admission with the highest average cost of 30-day all-cause hospital readmissions among adults by expected payer in 2020.
Table 3. Top five principal diagnoses with the highest average cost of 30-day all-cause adult readmissions, by expected payer, 2020
| Principal diagnosis (at index admission) | Number of index admissions | 30-day readmissions | ||
| Rank | Average Cost, $ | Aggregate cost, $ (millions) | ||
| Medicare | 11,784,200 | – | $18,100 | $36,200 |
| Complications of transplanted organs or tissue, initial encounter | 29,600 | 1 | $27,400 | $214 |
| Chronic rheumatic heart disease | 15,600 | 2 | $26,800 | $79 |
| Nonrheumatic and unspecified valve disorders | 94,500 | 3 | $24,800 | $329 |
| Diseases of white blood cells | 10,100 | 4 | $24,400 | $64 |
| Complications of cardiovascular device, implant or graft, initial encounter | 98,400 | 5 | $24,000 | $518 |
| Medicaid | 4,948,400 | – | $16,500 | $11,400 |
| Acute hemorrhagic cerebrovascular disease | 11,800 | 1 | $26,400 | $44 |
| Complications of cardiovascular device, implant or graft, initial encounter | 17,700 | 2 | $24,800 | $111 |
| Complications of internal orthopedic device, implant or graft, initial encounter | 13,400 | 3 | $24,100 | $44 |
| Septicemia* | 294,800 | 4 | $22,700 | $1,233 |
| Cirrhosis of the liver and other select liver diseases† | 35,300 | 5 | $22,700 | $280 |
| Private insurance | 5,962,500 | – | $19,500 | $10,200 |
| Complications of transplanted organs or tissue, initial encounter | 11,800 | 1 | $33,200 | $96 |
| Cirrhosis of the liver and other select liver diseases† | 25,000 | 2 | $29,600 | $201 |
| Heart failure | 85,500 | 3 | $28,900 | $422 |
| Complications of cardiovascular device, implant or graft, initial encounter | 19,100 | 4 | $28,900 | $85 |
| Acute hemorrhagic cerebrovascular disease | 18,400 | 5 | $27,700 | $57 |
| Self-pay/No charge‡ | 1,013,200 | – | $12,700 | $1,600 |
| Obesity | 5,900 | 1 | $35,600 | $5 |
| Fracture of the lower limb (except hip), initial encounter | 13,600 | 2 | $17,800 | $19 |
| Acute myocardial infarction | 23,800 | 3 | $17,600 | $38 |
| Pneumonia (except that caused by tuberculosis) | 15,900 | 4 | $17,500 | $29 |
| COVID-19 | 23,400 | 5 | $17,300 | $24 |
Complications of transplanted organs or tissue at index admission was associated with not only high readmission rates (table 2) but also the highest readmission costs (table 3). The average cost of 30-day all-cause readmissions was the highest among adult readmissions with an expected payer of Medicare ($27,400; 51% higher than the Medicare average cost of readmission) or private insurance ($33,200; 70% higher than the private average cost of readmission).
Cirrhosis of the liver at index admission was associated with high readmission rates (table 2) and costs (table 3). The average cost of readmissions ranked the second highest of adult readmissions with an expected payer of private insurance ($29,600) and the fifth highest of adult readmissions with an expected payer of Medicaid ($22,700).
For adult hospitalizations with an expected payer of Medicaid, septicemia at index admission had the fourth highest average readmission cost at $22,700 (or 34% higher than the Medicaid average readmission cost) and an aggregate cost of $1.2 billion, which accounted for 10.8 percent of total adult Medicaid readmission costs.
In 2020, among adult stays with an expected payer of self-pay/no charge, pneumonia at index admission ranked the fourth highest and COVID-19 ranked the fifth highest in average cost of 30-day all-cause readmissions at $17,500 and $17,300, respectively.
1 Birkmeyer JD, Barnato A, Birkmeyer N, Bessler R, Skinner J. The impact of the COVID-19 pandemic on hospital admissions in the United States. Health Aff (Millwood). 2020;39(11):2010-7. https://doi.org/10.1377/hlthaff.2020.00980.
2 Ghoshal S, Rigney G, Cheng D, Brumit R, Gee MS, Hodin RA et al. Institutional surgical response and associated volume trends throughout the COVID-19 pandemic and postvaccination recovery period. JAMA Netw Open. 2022;5(8):e2227443. PMID 35980636.
3 Jiang HJ, Hensche M. Characteristics of 30-Day All-Cause Hospital Readmissions, 2016-2020. HCUP Statistical Brief #304. Rockville, MD: U.S. Agency for Healthcare Research and Quality; September 2023. www.hcup-us.ahrq.gov/reports/statbriefs/sb304-readmissions-2016-2020.pdf.
4 Weiss AJ, Jiang HJ. Overview of Clinical Conditions With Frequent and Costly Hospital Readmissions by Payer, 2018. HCUP Statistical Brief #278. Rockville, MD: U.S. Agency for Healthcare Research and Quality; July 2021. www.hcup-us.ahrq.gov/reports/statbriefs/sb278-Conditions-Frequent-Readmissions-By-Payer-2018.pdf.
5 AHRQ PQI Technical Documentation, Version v2023. Rockville, MD: Agency for Healthcare Research and Quality; August 2023. https://qualityindicators.ahrq.gov/measures/pqi_resources.
The estimates in this Statistical Brief are based on data from the Healthcare Cost and Utilization Project (HCUP) 2020 Nationwide Readmissions Database (NRD). For additional information about the HCUP NRD, please visit https://hcup-us.ahrq.gov/db/nation/nrd/nrddbdocumentation.jsp.
All inpatient stays for adults aged 18 years and older were included in the analysis. A hospital admission that occurred within 30 days after discharge of the index admission was considered a readmission. That is, when patients are discharged from the hospital, they are followed for 30 days in the data. If any readmission to the same hospital or a different hospital occurs during this period, the admission is counted as a readmission. No more than one readmission is counted within the 30-day period because the outcome measure assessed is the "percentage of admissions that are readmitted." If a patient was transferred to a different hospital on the same day or within the same hospital, the two events were combined as a single stay and the second event was not counted as a readmission; that is, transfers were not considered readmissions. In the case of admissions for which there was more than one readmission in the 30-day period, the data presented in this Statistical Brief reflect the characteristics and costs of the first readmission.
Every qualifying hospital stay is counted as a separate initial (starting point) admission. Thus, a single patient can be counted multiple times during the course of the January through November observation period. In addition, initial admissions do not require a prior "clean period" with no hospitalizations; that is, the initial admission may be a readmission for a prior stay. Admissions were disqualified from the analysis as initial admissions if they could not be followed for 30 days for one of the following reasons: (1) the patient died in the hospital, (2) information on length of stay was missing, or (3) the patient was discharged in December. In addition, inpatient stays with a principal diagnosis of neoplasms (i.e., cancer) or factors influencing health status and contact with health services (e.g., encounter for antineoplastic therapies) were excluded from the reporting of readmission statistics.
The unit of analysis is the hospital discharge (i.e., the hospital stay), not a person or patient. This means that a person who is admitted to the hospital multiple times in 1 year will be counted each time as a separate discharge from the hospital.
Diagnoses
The principal diagnosis is that condition established after study to be chiefly responsible for the patient's
admission to the hospital. The principal diagnosis in this Statistical Brief is based on the index
admission.
ICD-10-CM
ICD-10-CM is the International Classification of Diseases, Tenth Revision, Clinical Modification. There are over
70,000 ICD-10-CM diagnosis codes.
Clinical Classifications Software Refined (CCSR) for ICD-10-CM diagnoses
The CCSR aggregates more than 70,000 ICD-10-CM diagnosis codes into 540 clinically meaningful categories. The CCSR
capitalizes on the specificity of the ICD-10-CM coding scheme and allows ICD-10-CM codes to be classified in more
than one category. For this Statistical Brief, the principal diagnosis code is assigned to a single default CCSR
based on clinical coding guidelines, etiology and pathology of diseases, and standards set by other Federal
agencies. For this Statistical Brief, v2022.1 of the CCSR was used. For more information on the CCSR, see
https://hcup-us.ahrq.gov/toolssoftware/ccsr/ccs_refined.jsp.
Notably, the CCSR category for septicemia includes all sepsis infection codes. However, it does not include
additional criteria regarding organ failure that are part of many recent publications. Therefore, the number of
index admissions identified as septicemia includes not only those with septic shock and severe sepsis, but also
those with less severe forms of sepsis.
Expected payer
To make coding uniform across all HCUP data sources, the primary expected payer for the hospital stay combines
detailed categories into general groups:
Total hospital costs and charges
Total hospital charges were converted to costs using HCUP Cost-to-Charge Ratios based on hospital accounting reports
from the Centers for Medicare & Medicaid Services. Costs reflect the actual expenses incurred in the production of
hospital services, such as wages, supplies, and utility costs; charges represent the amount a hospital billed for
the case. For each hospital, a hospitalwide cost-to-charge ratio is used. Hospital charges reflect the amount the
hospital billed for the entire hospital stay and do not include professional (physician) fees. For the purposes of
this Statistical Brief, costs are reported to the nearest hundred dollars. Further information on the Cost-to-Charge
Ratio can be found at https://hcup-us.ahrq.gov/db/ccr/costtocharge.jsp.
Costs are reported as the average cost of readmissions and the aggregate cost summed over all the readmissions.
The Healthcare Cost and Utilization Project (HCUP, pronounced "H-Cup") is a family of healthcare databases and related software tools and products developed through a Federal-State-industry partnership and sponsored by AHRQ. HCUP databases bring together the data collection efforts of State data organizations, hospital associations, private data organizations (HCUP Partners), and the Federal government to create a national information resource of encounter-level healthcare data. HCUP includes the largest collection of longitudinal hospital care data in the United States, with all-payer, encounter-level information beginning in 1988. These databases enable research on a broad range of health policy issues, including the cost and quality of health services, medical practice patterns, access to healthcare programs, and outcomes of treatments at the national, State, and local market levels. For more information about HCUP, see https://hcup-us.ahrq.gov/.
HCUP would not be possible without the contributions of the following data collection HCUP Partners from across the United States:
|
Alaska Department of Health Alaska Hospital and Healthcare Association Arizona Department of Health Services Arkansas Department of Health California Department of Health Care Access and Information Colorado Hospital Association Connecticut Hospital Association Delaware Division of Public Health District of Columbia Hospital Association Florida Agency for Health Care Administration Georgia Hospital Association Hawaii Laulima Data Alliance Hawaii University of Hawai'i at Hilo Illinois Department of Public Health Indiana Hospital Association Iowa Hospital Association Kansas Hospital Association Kentucky Cabinet for Health and Family Services Louisiana Department of Health Maine Health Data Organization Maryland Health Services Cost Review Commission Massachusetts Center for Health Information and Analysis Michigan Health & Hospital Association Minnesota Hospital Association Mississippi State Department of Health Missouri Hospital Industry Data Institute |
Montana Hospital Association Nebraska Hospital Association Nevada Department of Health and Human Services New Hampshire Department of Health & Human Services New Jersey Department of Health New Mexico Department of Health New York State Department of Health North Carolina Department of Health and Human Services North Dakota (data provided by the Minnesota Hospital Association) Ohio Hospital Association Oklahoma State Department of Health Oregon Association of Hospitals and Health Systems Oregon Health Authority Pennsylvania Health Care Cost Containment Council Rhode Island Department of Health South Carolina Revenue and Fiscal Affairs Office South Dakota Association of Healthcare Organizations Tennessee Hospital Association Texas Department of State Health Services Utah Department of Health Vermont Association of Hospitals and Health Systems Virginia Health Information Washington State Department of Health West Virginia Department of Health and Human Resources Wisconsin Department of Health Services Wyoming Hospital Association |
Jiang HJ, Barrett ML. Clinical Conditions With Frequent, Costly Hospital Readmissions by Payer, 2020. HCUP Statistical Brief #307. Rockville, MD: Agency for Healthcare Research and Quality; April 2024. https://hcup-us.ahrq.gov/reports/statbriefs/SB307-508.pdf.
The authors would like to acknowledge the contributions of Minya Sheng of IBM.
For more information on readmissions and revisits, refer to the HCUP Statistical Briefs topic area located at https://www.hcup-us.ahrq.gov/reports/statbriefs/sbtopic.jsp.
For additional HCUP statistics, visit:
For more information about HCUP, visit https://hcup-us.ahrq.gov/.
***
AHRQ welcomes questions and comments from readers of this publication who are interested in obtaining more information about access, cost, use, financing, and quality of healthcare in the United States. We also invite you to tell us how you are using this Statistical Brief and other HCUP data and tools, and to share suggestions on how HCUP products might be enhanced to further meet your needs. Please email us at hcup@ahrq.gov or send a letter to the address below:
Joel W. Cohen, Ph.D., Director
Center for Financing, Access and Cost Trends
Agency for Healthcare Research and Quality
5600 Fishers Lane
Rockville, MD 20857
This Statistical Brief was posted online on April 19, 2024.
| Internet Citation: Statistical Brief #307. Healthcare Cost and Utilization Project (HCUP). May 2024. Agency for Healthcare Research and Quality, Rockville, MD. hcup-us.ahrq.gov/reports/statbriefs/sb307-readmissions-2020.jsp. |
| Are you having problems viewing or printing pages on this website? |
| If you have comments, suggestions, and/or questions, please contact hcup@ahrq.gov. |
| If you are experiencing issues related to Section 508 accessibility of information on this website, please contact hcup@ahrq.gov. |
| Privacy Notice, Viewers & Players |
| Last modified 05/08/24 |