
|
STATISTICAL BRIEF #305
March 2024
R. Henry Olaisen, Ph.D., M.P.H., P.M.P., and Marc Roemer, M.S. IntroductionPrior to the COVID-19 pandemic, 95 percent of all emergency department (ED) visits involving dental conditions resulted in a discharge from the ED.1 The pandemic affected both the utilization and cost of healthcare services.2,3 Empirical evidence from administrative data and self-reported surveys shows that the share of adults who visited a hospital ED in 2019 and 2020 was below pre-pandemic levels.2, 4-5 This Healthcare Cost and Utilization Project (HCUP) Statistical Brief presents statistics on treat-and-release ED utilization and costs for dental-related conditions. Results are stratified by age (comparing those aged 64 years and younger to those aged 65 years and older) using the weighted estimates from the 2019 and 2020 Nationwide Emergency Department Sample (NEDS). A treat-and-release ED visit (i.e., a visit that did not result in admission to the same hospital) for a dental condition was defined as a visit in which the services provided were primarily for dental conditions identified by one of 675 first-listed diagnosis codes from the International Classification of Diseases, 10th Revision, Clinical Modification (ICD-10-CM).6 Five ED utilization and cost metrics are presented: (1) annual number of visits, (2) annual visits per 100,000 people, (3) total annual costs, (4) individual visit costs, and (5) monthly number of visits. All differences between estimates noted in the text are statistically significant at the 0.05 level or better. It is important to note that because of the large sample size of the NEDS data, small differences can be statistically significant but not clinically important. |
Highlights
|
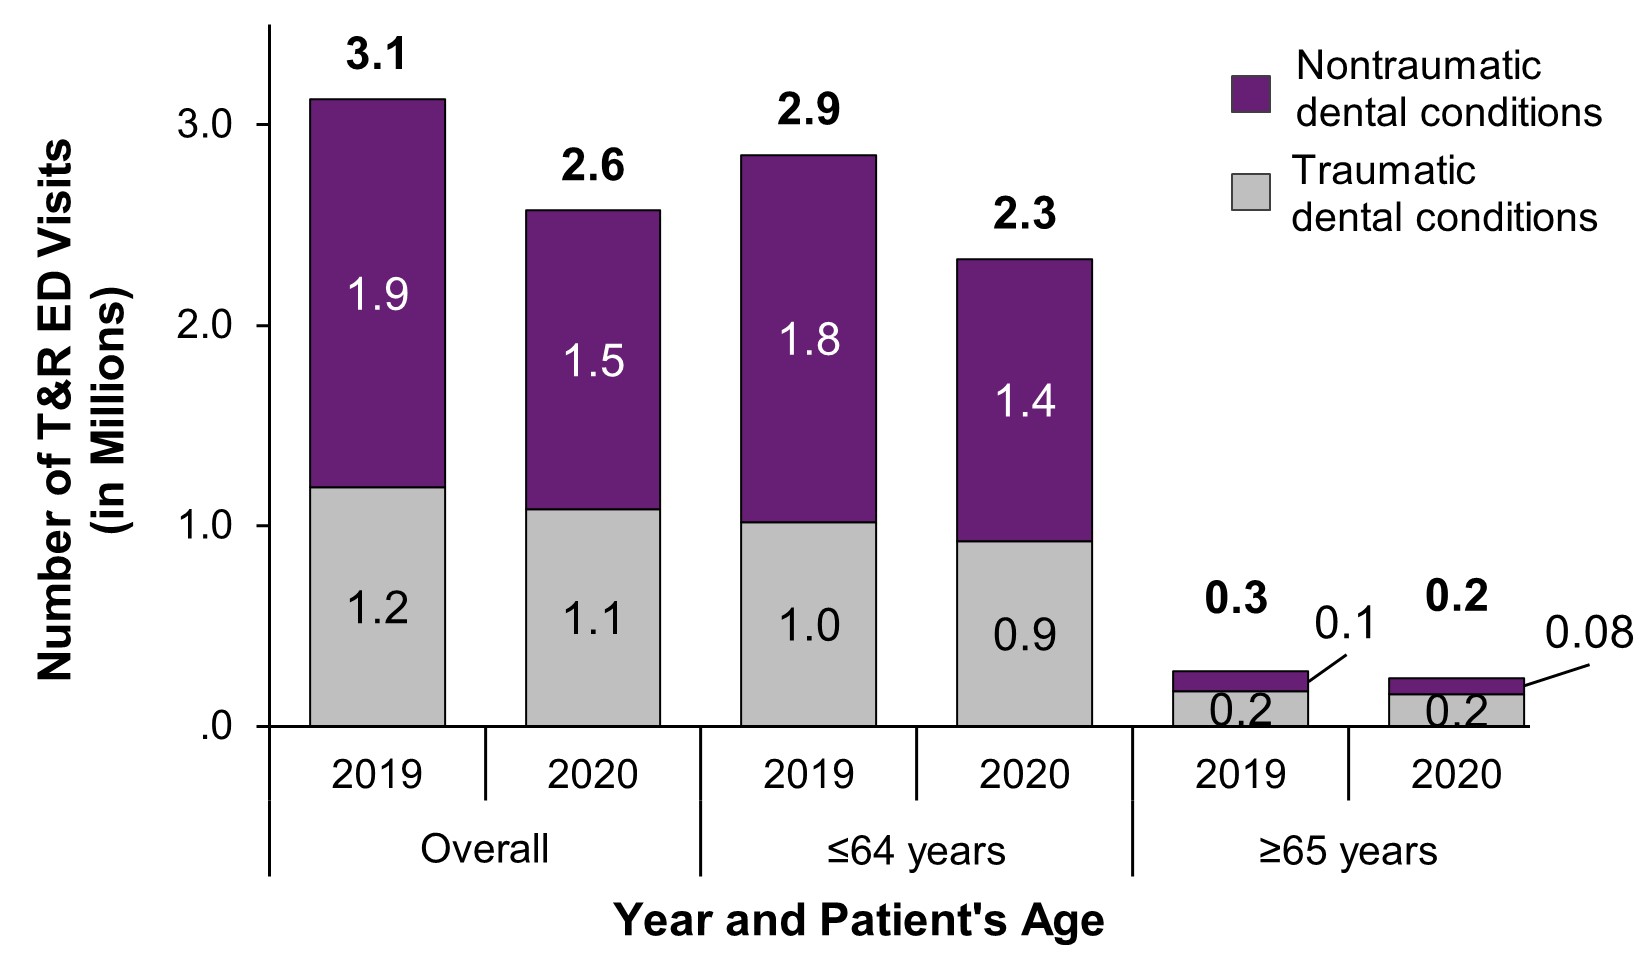
Figure 1. Number of treat-and-release ED visits for dental conditions in millions, overall and by age group and traumatic vs. nontraumatic conditions, 2019 and 2020
Abbreviations: ED = emergency department; T&R = treat-and-release.
Source: Agency for Healthcare Research and Quality (AHRQ), Healthcare Cost and
Utilization Project (HCUP), Nationwide Emergency Department Sample (NEDS),
2019-2020.
Table 1. Number of treat-and-release ED visits for dental conditions, overall and by age group and traumatic vs. nontraumatic conditions, 2019 and 2020
| Type of dental condition | Overall | Aged ≤64 years | Aged ≥65 years | |||
|---|---|---|---|---|---|---|
| 2019 | 2020 | 2019 | 2020 | 2019 | 2020 | |
| Overall | 3,126,000 | 2,572,000 | 2,850,000 | 2,331,000 | 276,000 | 241,000 |
| Traumatic | 1,193,000 | 1,085,000 | 1,019,000 | 924,000 | 173,000 | 160,000 |
| Nontraumatic | 1,933,000 | 1,487,000 | 1,831,000 | 1,406,000 | 103,000 | 81,000 |
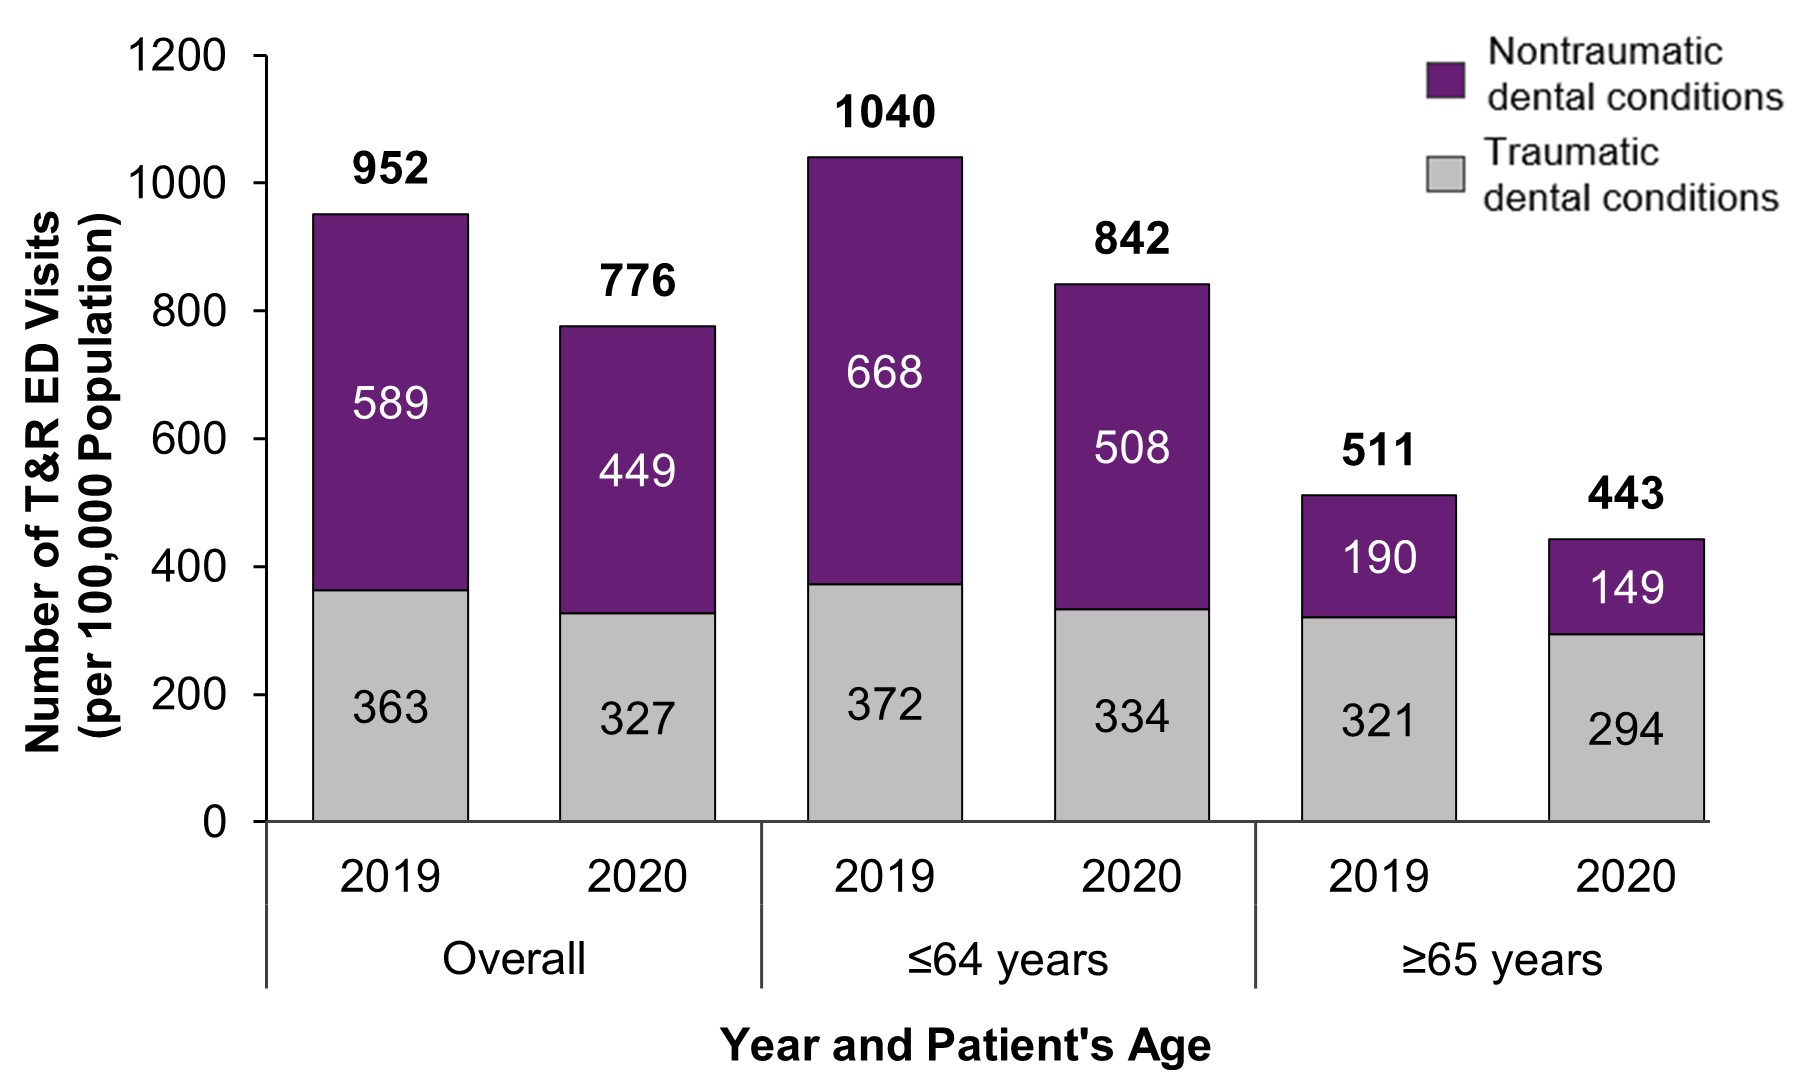
Figure 2. Number of treat-and-release ED visits for dental conditions per 100,000 population, overall and by age group and traumatic vs. nontraumatic conditions, 2019 and 2020
Abbreviations: ED = emergency department; T&R = treat-and-release.
Source: Agency for Healthcare Research and Quality (AHRQ), Healthcare Cost and
Utilization Project (HCUP), Nationwide Emergency Department Sample (NEDS),
2019-2020.
Table 2. Number of treat-and-release ED visits for dental conditions per 100,000 population, overall and by age group and traumatic vs. nontraumatic conditions, 2019 and 2020
| Type of dental condition | Overall | Aged ≤64 years | Aged ≥65 years | |||
|---|---|---|---|---|---|---|
| 2019 | 2020 | 2019 | 2020 | 2019 | 2020 | |
| Overall | 952 | 776 | 1,040 | 842 | 511 | 443 |
| Traumatic | 363 | 327 | 372 | 334 | 321 | 294 |
| Nontraumatic | 589 | 449 | 668 | 508 | 190 | 149 |
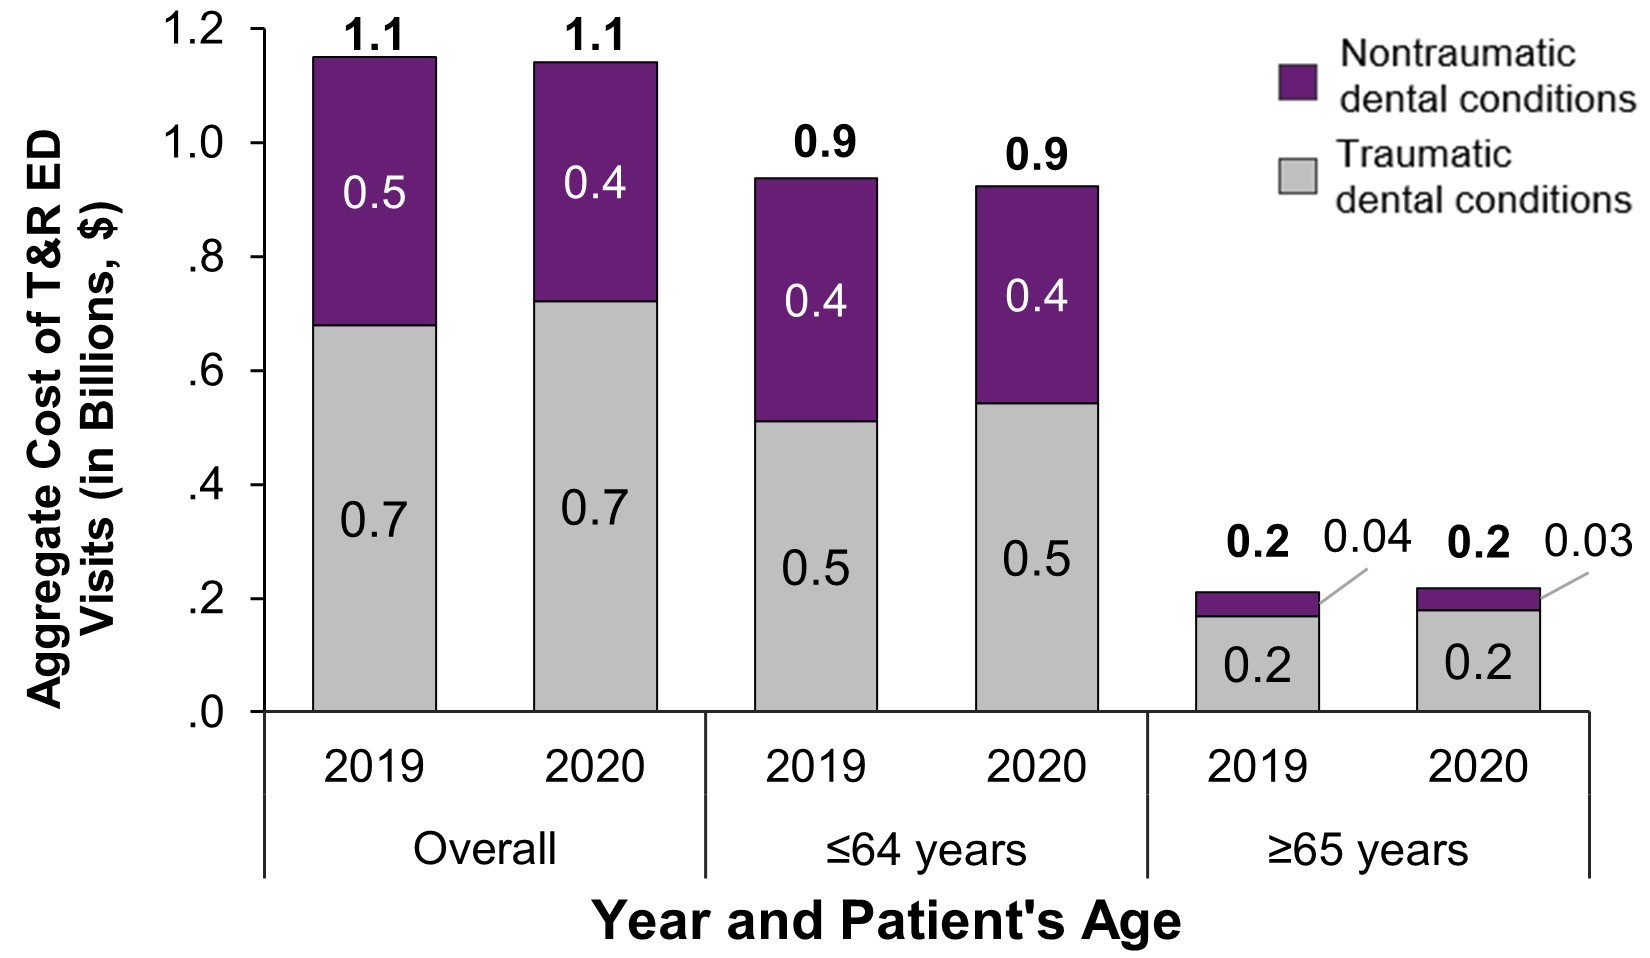
Figure 3. Aggregate cost in billions of treat-and-release ED visits for dental conditions, overall and by age group and traumatic vs. nontraumatic conditions, 2019 and 2020
Abbreviations: ED = emergency department; T&R = treat-and-release.
Note: No adjustment was made for inflation.
Source: Agency for Healthcare Research and Quality (AHRQ), Healthcare Cost and
Utilization Project (HCUP), Nationwide Emergency Department Sample (NEDS),
2019-2020.
Table 3. Aggregate hospital costs of treat-and-release ED visits for dental conditions, overall and by age group and traumatic vs. nontraumatic conditions, 2019 and 2020
| Type of dental condition | Overall | Aged ≤64 years | Aged ≥65 years | |||
|---|---|---|---|---|---|---|
| 2019 | 2020 | 2019 | 2020 | 2019 | 2020 | |
| Overall | $1,148,935,000 | $1,141,306,000 | $937,539,000 | $923,145,000 | $211,396,000 | $218,162,000 |
| Traumatic | $679,029,000 | $721,491,000 | $509,978,000 | $542,445,000 | $169,051,000 | $179,046,000 |
| Nontraumatic | $469,906,000 | $419,815,000 | $427,560,000 | $380,699,000 | $42,346,000 | $39,116,000 |
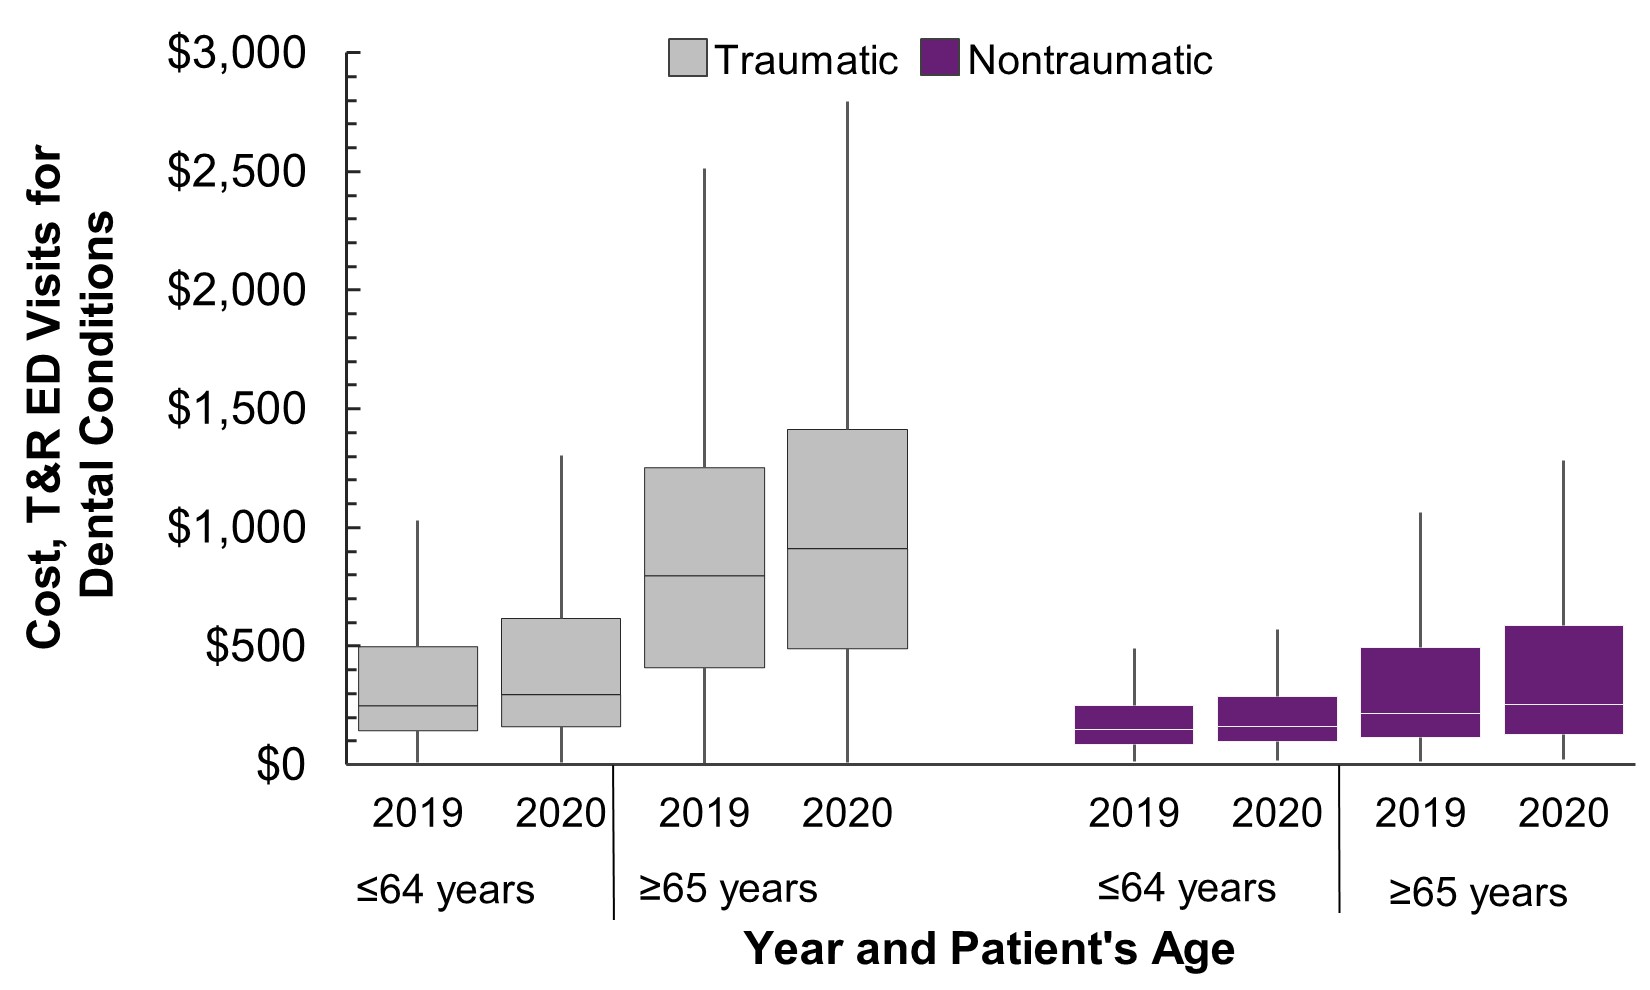
Figure 4. Cost for treat-and-release ED visits for dental conditions by age group and traumatic vs. nontraumatic conditions, 2019 and 2020
Abbreviations: ED = emergency department; IQR = interquartile range; T&R =
treat-and-release.
Notes: The vertical line length ("whiskers") is the largest observation that is
≤the third quartile +1.5 times the IQR. No adjustment was made for inflation.
Source: Agency for Healthcare Research and Quality (AHRQ), Healthcare Cost and
Utilization Project (HCUP), Nationwide Emergency Department Sample (NEDS),
2019-2020.
Table 4. Cost for treat-and-release ED visits for dental conditions by age group and traumatic vs. nontraumatic conditions, 2019 and 2020
| Individual dental visit cost | Traumatic | Nontraumatic | ||||||
|---|---|---|---|---|---|---|---|---|
| Aged ≤64 years | Aged ≥65 years | Aged ≤64 years | Aged ≥65 years | |||||
| 2019 | 2020 | 2019 | 2020 | 2019 | 2020 | 2019 | 2020 | |
| First quartile | $144 | $161 | $414 | $496 | $86 | $98 | $114 | $126 |
| Median | $248 | $292 | $798 | $916 | $145 | $158 | $214 | $250 |
| Third quartile | $502 | $620 | $1,252 | $1,414 | $244 | $281 | $495 | $591 |
| IQR | $358 | $459 | $838 | $918 | $158 | $183 | $381 | $465 |
Figure 5. Number of treat-and-release ED visits for dental conditions by month and traumatic vs. nontraumatic conditions, 2019 and 2020
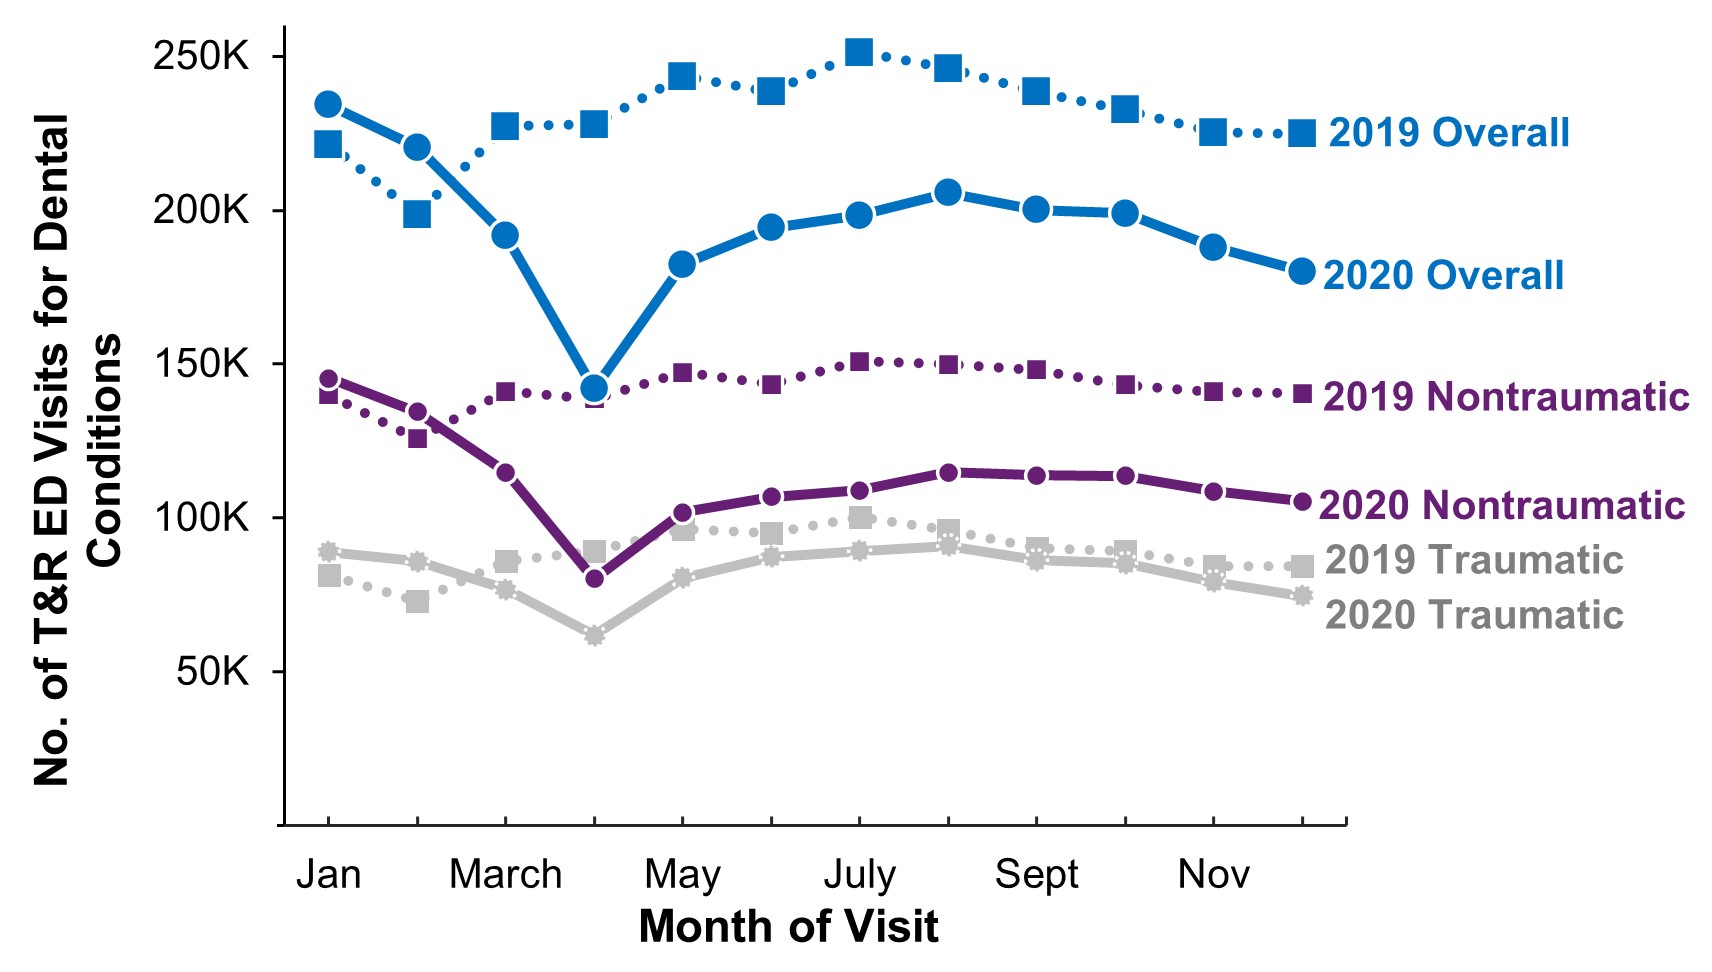
Abbreviations: ED = emergency department; T&R = treat-and-release.
Source: Agency for Healthcare Research and Quality (AHRQ), Healthcare Cost and
Utilization Project (HCUP), Nationwide Emergency Department Sample (NEDS),
2019-2020.
Table 5. Number of treat-and-release ED visits for dental conditions, by month and traumatic vs. nontraumatic conditions, 2019 and 2020
| Month of T&R ED Visit | 2019 | 2020 | ||||
|---|---|---|---|---|---|---|
| Traumatic | Nontraumatic | Total | Traumatic | Nontraumatic | Total | |
| Jan | 81,000 | 140,000 | 221,000 | 89,000 | 145,000 | 234,000 |
| Feb | 73,000 | 126,000 | 199,000 | 86,000 | 135,000 | 220,000 |
| March | 86,000 | 141,000 | 227,000 | 77,000 | 115,000 | 192,000 |
| April | 89,000 | 139,000 | 228,000 | 62,000 | 80,000 | 142,000 |
| May | 96,000 | 147,000 | 243,000 | 81,000 | 102,000 | 182,000 |
| June | 95,000 | 143,000 | 238,000 | 87,000 | 107,000 | 194,000 |
| July | 100,000 | 151,000 | 251,000 | 89,000 | 109,000 | 198,000 |
| Aug | 96,000 | 150,000 | 246,000 | 91,000 | 115,000 | 206,000 |
| Sept | 90,000 | 148,000 | 238,000 | 86,000 | 114,000 | 200,000 |
| Oct | 89,000 | 143,000 | 233,000 | 85,000 | 114,000 | 199,000 |
| Nov | 84,000 | 141,000 | 225,000 | 79,000 | 109,000 | 188,000 |
| Dec | 84,000 | 140,000 | 225,000 | 75,000 | 105,000 | 180,000 |
1 Owens PL, Manski RJ, Weiss AJ. Emergency Department Visits Involving Dental Conditions, 2018. HCUP Statistical Brief #280. Rockville, MD: Agency for Healthcare Research and Quality; August 2021. www.hcup-us.ahrq.gov/reports/statbriefs/sb280-Dental-ED-Visits-2018.pdf. Accessed February 15, 2024.
2 Barrett ML, Owens PL, Roemer, M. Changes in Emergency Department Visits in the Initial Period of the COVID-19 Pandemic (April-December 2020), 29 States. HCUP Statistical Brief #298. Rockville, MD: Agency for Healthcare Research and Quality; October 2022. www.hcup-us.ahrq.gov/reports/statbriefs/sb298-COVID-19-ED-visits.pdf. Accessed February 15, 2024.
3 Grace H. How did the COVID-19 pandemic affect healthcare spending? Beyond the Numbers: Prices & Spending. 2023 Nov;12(14). U.S. Bureau of Labor Statistics . https://www.bls.gov/opub/btn/volume-12/how-did-the-covid-19-pandemic-affect-healthcare-spending.htm. Accessed February 15, 2024.
4 Birkmeyer JD, Barnato A, Birkmeyer N, Bessler R, Skinner J. The impact of the COVID-19 pandemic on hospital admissions in the United States. Health Aff (Millwood). 2020 Nov;39(11):2010-2017. doi: 10.1377/hlthaff.2020.00980.
5 McGough M, Amin K, Cox C. How Has Healthcare Utilization Changed Since the Pandemic? Peterson-KFF Health System Tracker, January 2023. www.healthsystemtracker.org/chart-collection/how-has-healthcare-utilization-changed-since-the-pandemic/. Accessed February 15, 2024.
6 Healthcare Cost and Utilization Project. Treat-and-Release Emergency Department Visits for Dental Conditions and Related Costs: Variation Across the United States by Census Region and State, 2016 and 2019. Rockville, MD: Agency for Healthcare Research and Quality; July 2022. https://hcup-us.ahrq.gov/reports/ataglance/AHRQHCUPanalysisDentalEDvsts.pdf. Accessed February 15, 2024.
7 Clinical Classification Software Refined (CCSR) for ICD-10-CM Diagnoses. Healthcare Cost and Utilization Project (HCUP), Agency for Healthcare Research and Quality. December 2022. https://hcup-us.ahrq.gov/toolssoftware/ccsr/dxccsr.jsp. Accessed February 15, 2024.
8 Barrett M. Population Denominator Data Sources and Data for Use with the HCUP Databases (Updated with 2021 Population Data). HCUP Methods Series Report #2022-03. Rockville, MD: Agency for Healthcare Research and Quality; December 2022. https://hcup-us.ahrq.gov/reports/methods/MS2022-03-PopulationReport.pdf. Accessed February 15, 2024.
9 Healthcare Cost and Utilization Project. User Guide: Cost-to-Charge Ratio (CCR) for Emergency Department Files. Rockville, MD: Agency for Healthcare Research and Quality; October 2022. hcup-us.ahrq.gov/db/ccr/ed-ccr/ED-CCR-User-Guide_Public_FINAL.pdf. Accessed February 15, 2024.
10 Pickens GT, Liang L, Roemer M. HCUP Cost-to-Charge Ratio Methodologies. 2021. HCUP Methods Series Report # 2021-05. Rockville, MD: Agency for Healthcare Research and Quality; December 2021. hcup-us.ahrq.gov/reports/methods/MS2021-05-CCR-Methodologies.pdf. Accessed February 15, 2024.
This Statistical Brief uses data from the HCUP 2019 and 2020 Nationwide Emergency Department Sample (NEDS). The analysis included all data from the NEDS that originated from the HCUP State Emergency Department Databases (SEDD) to capture information on ED visits that do not result in an admission (i.e., patients who were treated in the ED and then released from the ED, or patients who were transferred to another hospital). For additional information about the HCUP NEDS, please visit: https://hcup-us.ahrq.gov/nedsoverview.jsp.
This Statistical Brief also relies on U.S. population estimates, for 2019 and 2020, using mid-year estimates (April 1-July 1), as reported by the U.S. Census Bureau's Population Estimates Program. The population estimate at any given time starts with a population base (e.g., the last decennial census or the previous point in the time series), adds births, subtracts deaths, and adds net migration (both international and domestic). For additional information, please visit: https://www.census.gov/programs-surveys/popest/tables/2010-2020/national/totals/-national.html.
This Statistical Brief examines treat-and-release ED visits with a first-listed diagnosis of a dental condition, using the Clinical Classification Software Refined (CCSR) for ICD-10-CM diagnoses of DEN001.8 The unit of analysis is a visit, not a person or patient. This means that a person who is admitted to the ED multiple times for a dental condition in 1 year will be counted each time as a separate admission to the ED. Our case definition excludes all ED admissions for dental conditions that led to an inpatient admission to the same hospital for 2019 and 2020 (1.8 percent and 1.9 percent respectively, of all ED visits).
The Healthcare Cost and Utilization Project (HCUP, pronounced "H-Cup") is a family of healthcare databases and related software tools and products developed through a Federal-State-Industry partnership and sponsored by the Agency for Healthcare Research and Quality (AHRQ). HCUP databases bring together the data collection efforts of State data organizations, hospital associations, and private data organizations (HCUP Partners) and the Federal government to create a national information resource of encounter-level healthcare data. HCUP includes the largest collection of longitudinal hospital care data in the United States, with all-payer, encounter-level information beginning in 1988. These databases enable research on a broad range of health policy issues, including cost and quality of health services, medical practice patterns, access to healthcare programs, and outcomes of treatments at the national, State, and local market levels.
HCUP would not be possible without the contributions of the following data collection Partners from across the United States:
|
Alaska Department of Health Alaska Hospital and Healthcare Association Arizona Department of Health Services Arkansas Department of Health California Department of Health Care Access and Information Colorado Hospital Association Connecticut Hospital Association Delaware Division of Public Health District of Columbia Hospital Association Florida Agency for Health Care Administration Georgia Hospital Association Hawaii Laulima Data Alliance Hawaii University of Hawai'i at Hilo Illinois Department of Public Health Indiana Hospital Association Iowa Hospital Association Kansas Hospital Association Kentucky Cabinet for Health and Family Services Louisiana Department of Health Maine Health Data Organization Maryland Health Services Cost Review Commission Massachusetts Center for Health Information and Analysis Michigan Health & Hospital Association Minnesota Hospital Association Mississippi State Department of Health Missouri Hospital Industry Data Institute |
Montana Hospital Association Nebraska Hospital Association Nevada Department of Health and Human Services New Hampshire Department of Health & Human Services New Jersey Department of Health New Mexico Department of Health New York State Department of Health North Carolina Department of Health and Human Services North Dakota (data provided by the Minnesota Hospital Association) Ohio Hospital Association Oklahoma State Department of Health Oregon Association of Hospitals and Health Systems Oregon Health Authority Pennsylvania Health Care Cost Containment Council Rhode Island Department of Health South Carolina Revenue and Fiscal Affairs Office South Dakota Association of Healthcare Organizations Tennessee Hospital Association Texas Department of State Health Services Utah Department of Health Vermont Association of Hospitals and Health Systems Virginia Health Information Washington State Department of Health West Virginia Department of Health and Human Resources Wisconsin Department of Health Services Wyoming Hospital Association |
The HCUP Nationwide Emergency Department Sample (NEDS) is a unique and powerful database that yields national estimates of ED visits. The NEDS was constructed using records from both the HCUP State Emergency Department Databases (SEDD) and the State Inpatient Databases (SID). The SEDD capture information on ED visits that do not result in an admission (i.e., patients who were treated in the ED and then released from the ED, or patients who were transferred to another hospital); the SID contain information on patients initially seen in the ED and then admitted to the same hospital. The NEDS was created to enable analyses of ED utilization patterns and support public health professionals, administrators, policymakers, and clinicians in their decision making regarding this critical source of care. The NEDS is produced annually; it began in 2006. Over time, the sampling frame for the NEDS has changed; thus, the number of States contributing to the NEDS varies from year to year. The NEDS is intended for national estimates only; no State-level estimates can be produced. The unweighted sample size for the 2019 NEDS is 33,147,251 (weighted, this represents 143,432,284 ED visits). The unweighted sample size for the 2020 NEDS is 28,037,034 (weighted, this represents 123,278,165 ED visits).
Olaisen RH, Roemer M. Treat-and-Release Emergency Department Utilization and Costs for Traumatic and Nontraumatic Dental Conditions, 2019 and 2020. HCUP Statistical Brief #305. Rockville, MD: Agency for Healthcare Research and Quality; March 2024. www.hcup-us.ahrq.gov/reports/statbriefs/sb305-dental-conditions-2019-2020.pdf.
***
For other information on characteristics of hospital stays, refer to the Hospital Overview HCUP Statistical Briefs topic area located at https://www.hcup-us.ahrq.gov/reports/statbriefs/sbtopic.jsp.
For additional HCUP statistics, visit:
AHRQ welcomes questions and comments from readers of this publication who are interested in obtaining more information about access, cost, use, financing, and quality of healthcare in the United States. We also invite you to tell us how you are using this Statistical Brief and other HCUP data and tools, and to share suggestions on how HCUP products might be enhanced to further meet your needs. Please email us at hcup@ahrq.gov or send a letter to the address below:
Joel W. Cohen, Ph.D., Director
Center for Financing, Access and Cost Trends
Agency for Healthcare Research and Quality
5600 Fishers Lane
Rockville, MD 20857
This Statistical Brief was posted online on March 8, 2024.
| Internet Citation: Statistical Brief #305. Healthcare Cost and Utilization Project (HCUP). March 2024. Agency for Healthcare Research and Quality, Rockville, MD. hcup-us.ahrq.gov/reports/statbriefs/sb305-dental-conditions-2019-2020.jsp. |
| Are you having problems viewing or printing pages on this website? |
| If you have comments, suggestions, and/or questions, please contact hcup@ahrq.gov. |
| If you are experiencing issues related to Section 508 accessibility of information on this website, please contact hcup@ahrq.gov. |
| Privacy Notice, Viewers & Players |
| Last modified 03/15/24 |