HEALTHCARE COST & UTILIZATION PROJECT

User Support

Do Your own analysis
Explore Expert Research & Limited Datasets

Characteristics Of 30-Day All-Cause Hospital Readmissions, 2016-2020

STATISTICAL BRIEF #304
September 2023

H. Joanna Jiang, Ph.D., and Molly Hensche, M.S.


Introduction

Hospital readmissions are one of the key measures used for evaluating the quality of inpatient care and post-discharge outpatient care. Although in most cases readmissions are necessary, a significant portion may be preventable. Strategies have been implemented at both the national and State levels to reduce preventable readmissions, particularly through improved discharge planning and care coordination. Hospitals and health systems are incentivized to implement these strategies by linking payment with certain key readmission measures.

When the COVID-19 pandemic began in early 2020, hospital utilization decreased while the number of all-cause in-hospital deaths increased considerably.1 These changes varied by expected payer.2 It is important to determine whether overall hospital readmissions would also change given the impact of the COVID-19 pandemic on hospital care.

This Healthcare Cost and Utilization Project (HCUP) Statistical Brief presents statistics on 30-day all-cause hospital readmissions among patients aged 1 year and older in the United States. Trends in readmissions by expected payer are provided from 2016 through 2020 using the HCUP Nationwide Readmissions Database (NRD). The brief presents changes in readmission rates from the pre-pandemic period of 2016-2019 to 2020 by select patient characteristics based on the index admission (i.e., the initial inpatient stay), including expected primary payer, patient location, and race and ethnicity. The brief also provides readmission rates and a comparison of costs for the index admission and the readmission for 2020 based on the principal diagnosis and grouped according to the Clinical Classifications Software Refined (CCSR) body system. Because of the large sample size of the NRD data, small differences can be statistically significant. Thus, only differences greater than or equal to 10 percent are discussed in the text.
Highlights

Findings

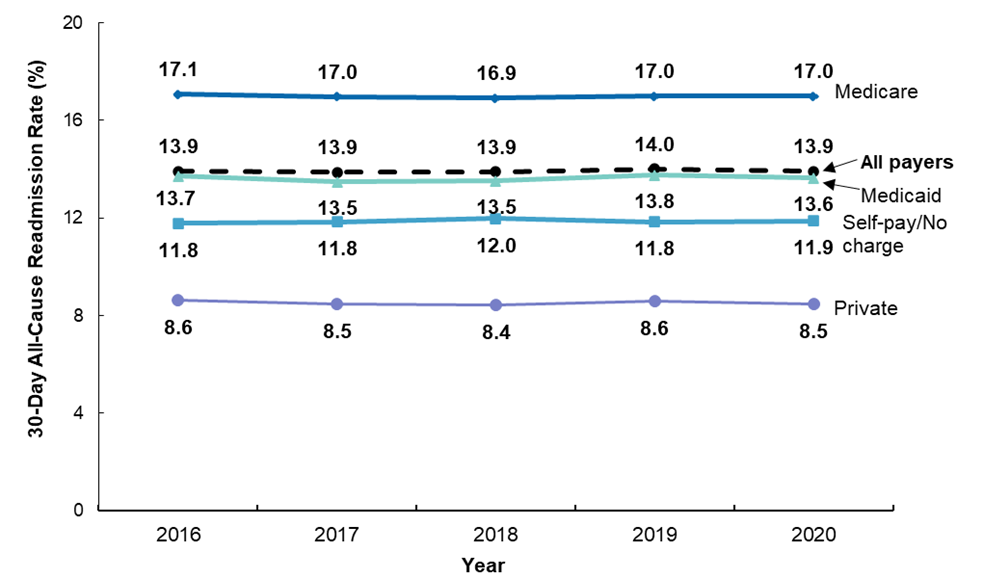
Rates of 30-day all-cause hospital readmissions by expected payer, 2016-2020
Figure 1 presents trends in the 30-day all-cause readmission rate by the expected primary payer from 2016 to 2020. The expected payer is determined by the index admission, not the readmission.

Figure 1. Rates of 30-day all-cause readmissions by expected primary payer, 2016-2020

Bar chart showing rates of 30-day all-cause readmissions by expected primary payer, 2016-2020. Data are provided in Supplemental Table 1
Source: Agency for Healthcare Research and Quality (AHRQ), Healthcare Cost and Utilization Project (HCUP), Nationwide Readmissions Database (NRD), 2016-2020.

  • The 30-day all-cause readmission rate for all hospital stays remained stable at 13.9 per 100 index admissions from 2016 to 2020. The readmission rate for each expected payer group (e.g., Medicare, Medicaid, private insurance, self-pay/no charge) also remained stable during this period.
  • In 2020, hospital stays with an expected payer of Medicare had the highest readmission rate (17.0 per 100 index admissions), followed by stays with an expected payer of Medicaid (13.6 per 100 index admissions).
  • The readmission rate for hospital stays with an expected payer of self-pay/no charge was consistently higher than for stays with an expected payer of private insurance (e.g., 11.9 vs. 8.5 per 100 index admissions in 2020).

Table 1 presents the readmission rate and the number of readmissions by the expected primary payer and patient age group in 2016-2019 and 2020.

Table 1. Rate and number of 30-day all-cause readmissions by expected payer and patient age group, 2016-2019 and 2020

Expected payer and age groupa Readmission rateb Number of readmissionsc (thousands)
2016-2019 (Mean) 2020 Percentage change, 2016-2019 (Mean)–2020 2016-2019 (Mean) 2020 Percentage change, 2016-2019 (Mean)–2020
All payers 13.9 13.9 -0.1 4,288 3,850 -10.2
Medicare
Totald 17.0 17.0 0.0 2,490 2,198 -11.7
Aged 21-64 years 21.2 21.4 0.9 616 522 -15.4
Aged 65 years and older 15.9 16.0 0.1 1,871 1,674 -10.6
Medicaid
Total 13.6 13.6 0.1 849 791 -6.9
Aged 1-20 years, nonmaternal 12.0 12.7 5.4 101 82 -18.7
Aged 21-44 years, nonmaternal 17.5 17.4 -0.8 274 268 -2.5
Aged 45-64 years, nonmaternal 20.0 19.7 -1.3 392 369 -6.0
Maternal, any age 4.3 4.2 -3.8 81 73 -10.2
Private
Total 8.5 8.5 -0.8 609 536 -12.0
Aged 1-20 years, nonmaternal 10.3 10.8 5.5 53 43 -19.0
Aged 21-44 years, nonmaternal 10.0 9.9 -0.3 143 127 -11.0
Aged 45-64 years, nonmaternal 10.9 11.0 1.0 358 314 -12.3
Maternal, any age 2.9 3.0 0.6 56 53 -4.8
Self-pay/No charge
Total 11.9 11.9 0.3 141 128 -9.1
Aged 1-20 years, nonmaternal 7.8 7.2 -7.5 4 3 -32.9
Aged 21-44 years, nonmaternal 11.9 11.9 0.5 65 59 -8.8
Aged 45-64 years, nonmaternal 13.2 13.2 0.0 70 65 -7.6
Maternal, any age 3.8 3.6 -6.7 3 2 -15.8

a The expected payer is determined by the index admission, not the readmission. See the Definition section for a description of what is meant by the term expected payer.
b The readmission rate is calculated using discharges from January through November to allow for a 30-day followup period.
c The number of readmissions is the 12-month count calculated by multiplying the readmission rate by the 12-month index admission count.
d Medicare patients under 21 years of age are included in the Medicare total for all ages but are not reported separately because of the small number of cases. There is no maternal breakout for Medicare because of the small number of maternal stays in this group.
Source: Agency for Healthcare Research and Quality (AHRQ), Healthcare Cost and Utilization Project (HCUP), Nationwide Readmissions Database (NRD), 2016-2020.

  • Regardless of the expected payer, compared with the pre-pandemic period of 2016-2019, in 2020, there was little change in the rate of 30-day all-cause readmissions. However, the number of readmissions decreased by 10.2 percent in 2020.
  • For hospital stays with an expected payer of Medicare, the readmission rate was higher among patients aged 21-64 years than among patients aged 65 years and older (21.4 vs. 16.0 per 100 index admissions in 2020).
  • In 2020, the highest readmission rates by expected payer and age were for hospital stays among patients aged 21-64 years with an expected payer of Medicare, and nonmaternal patients aged 45-64 years with an expected payer of Medicaid (21.4 and 19.7 per 100 index admissions, respectively).
  • Among the groups in Table 1, nonmaternal pediatric stays for patients aged 1-20 years had the largest decrease in the number of readmissions in 2020 compared with the pre-pandemic period of 2016-2019 (Medicaid: 18.7 percent decrease; private insurance: 19.0 percent decrease; and self-pay/no charge: 32.9 percent decrease).

Rates of 30-day all-cause readmissions by patient location and race/ethnicity, 2016-2020

Table 2 presents the 30-day all-cause readmission rate and the number of readmissions by the location of the patient's residence and by patient race and ethnicity in 2016-2019 and 2020.

Table 2. Rate and number of 30-day all-cause readmissions by patient location and race/ethnicity, 2016-2019 and 2020

Patient characteristic Readmission ratea Number of readmissionsb (thousands)
2016-2019 (Mean) 2020 Percentage change, 2016-2019 (Mean)–2020 2016-2019 (Mean) 2020 Percentage change, 2016-2019 (Mean)–2020
Patient location
Large central metropolitan 14.8 14.6 -1.3 1,157 989 -14.6
Large fringe metropolitan 13.9 13.8 -0.8 1,106 1,003 -9.3
Small and medium metropolitan 13.5 13.7 1.2 1,324 1,227 -7.3
Rural 13.0 13.0 -0.3 663 586 -11.7
Patient race and ethnicity
White, non-Hispanic 13.8 13.9 0.3 2,782 2,473 -11.1
Black, non-Hispanic 16.2 16.0 -1.1 800 734 -8.3
Hispanic 13.1 12.7 -2.9 361 337 -6.7
Asian/Pacific Islander, non-Hispanic 11.6 11.7 0.7 92 87 -5.2
Other, non-Hispanic 12.1 12.4 2.4 110 111 0.4

a The readmission rate is calculated using discharges from January through November to allow for a 30-day followup period.
b The number of readmissions is the 12-month count calculated by multiplying the readmission rate by the 12-month index admission count.
Source: Agency for Healthcare Research and Quality (AHRQ), Healthcare Cost and Utilization Project (HCUP), Nationwide Readmissions Database (NRD), 2016-2020.

  • During both the pre-pandemic period of 2016-2019 and the initial period of pandemic in 2020, the 30-day all-cause readmission rate by location was consistently highest for patients living in large central metropolitan areas but lowest for patients in rural areas (14.8 and 13.0 per 100 index admissions in 2016-2019, and 14.6 and 13.0 per 100 index admissions in 2020). However, from the pre-pandemic period of 2016-2019 to 2020, the number of readmissions decreased by 14.6 percent for patients in large central metropolitan areas and by 11.7 percent for patients in rural areas.
  • Among racial/ethnic groups, the readmission rate in 2020 was highest for non-Hispanic Black patients and lowest for non-Hispanic Asian/Pacific Islander patients (16.0 and 11.7 per 100 index admissions). The readmission rate for each group showed little change in 2020 compared with the pre-pandemic period of 2016-2019.

Rates of 30-day all-cause readmissions by principal diagnosis, 2020

Tables 3 presents the 30-day all-cause readmission rate and the number of readmissions by the principal diagnosis at index admission for 2020. Principal diagnoses are ranked by the rate of readmission and grouped using the CCSR for the International Classification of Diseases, Tenth Revision, Clinical Modification (ICD-10-CM) body system categories.

Table 3. Rate of readmission for all causes within 30 days by principal diagnosis category at index admission, 2020

Rank Principal diagnosis at index admissiona Readmission rateb Number of all-cause readmissionsc
1Blood diseases23.879,720
2Neoplasms19.0212,954
3Endocrine, nutritional, and metabolic diseases17.3223,149
4Genitourinary system diseases17.3238,130
5Respiratory system diseases17.0304,627
6Mental, behavioral, and neurodevelopmental disorders16.2303,313
7Digestive system diseases16.0447,677
8Infectious and parasitic diseases15.6478,007
9Circulatory system diseases15.3647,861
10Skin diseases13.461,403
11Injury, poisoning, and other external causes13.4331,496
12Nervous system diseases13.3101,948
13Eye and adnexa diseases8.82,234
14Congenital malformations, deformations, and abnormalities8.75,173
15Conditions of newborn originating in the perinatal period8.641
16Musculoskeletal system diseases7.4112,376
17Ear and mastoid process diseases6.51,886
18Pregnancy, childbirth, and the puerperium3.6134,260
N/AOverall (any diagnosis)13.93,850,413

a Principal diagnosis at index admission is grouped by body system according to the (CSR, which categorizes the ICD-10-CM into a manageable number of clinically meaningful categories.
b The readmission rate is calculated using discharges from January through November to allow for a 30-day followup period.
c The number of readmissions is the 12-month count calculated by multiplying the readmission rate by the 12-month index admission count.
Source: Agency for Healthcare Research and Quality (AHRQ), Healthcare Cost and Utilization Project (HCUP), Nationwide Readmissions Database (NRD), 2020.

  • Hospital stays for blood diseases at index admission had the highest 30-day all-cause readmission rate in 2020 (23.8 per 100 index admissions), which was more than 70 percent higher than the overall readmission rate (13.9 per 100 index admissions). This was followed by the readmission rate for stays for neoplasms at index admission (19.0 per 100 index admissions), which was more than 30 percent higher than the overall admission rate.
  • Three categories of diseases–endocrine and metabolic diseases, genitourinary diseases, and respiratory diseases–had similar readmission rates in 2020 of around 17.0 and 17.3 per 100 index admissions. These rates were more than 20 percent higher than the overall readmission rate.
  • Circulatory system diseases accounted for the largest share of all readmissions, at 16.8 percent (647,861 out of 3,850,413 readmissions), followed by infectious and parasitic diseases (12.4 percent) and digestive system diseases (11.6 percent).
  • Pregnancy/childbirth had the lowest readmission rate at 3.6 per 100 index admissions, which was more than 70 percent lower than the overall readmission rate.

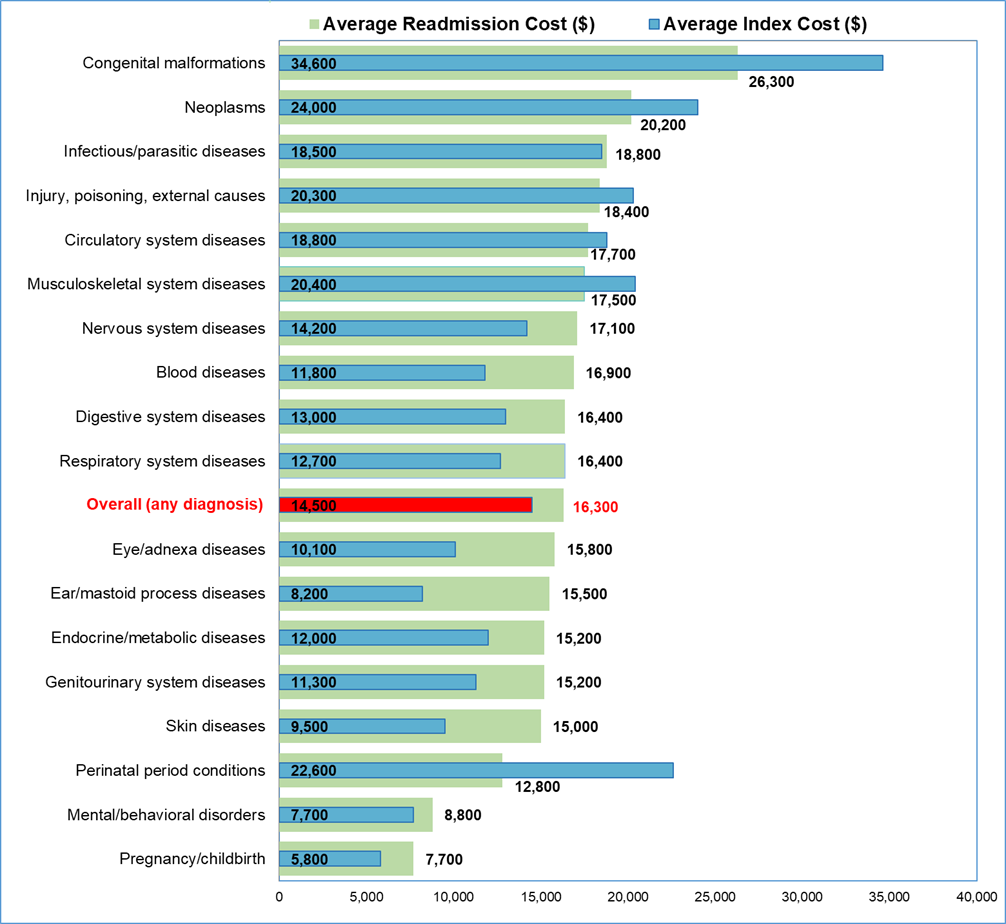
Average costs for the index admission and the readmission, 2020
Figure 2 presents the average cost of index admissions and the average cost of readmissions by principal diagnosis in 2020. Principal diagnoses are ranked based on the average cost of the readmission and grouped using the CCSR for the ICD-10-CM body system categories.

Figure 2. Average cost of index admissions and 30-day all-cause readmissions by principal diagnosis category at index admission, ranked by average readmission cost, 2020

Bar chart showing average cost of index admissions and 30-day all-cause readmissions by principal diagnosis category at index admission, ranked by average readmission cost, 2020
Source: Agency for Healthcare Research and Quality (AHRQ), Healthcare Cost and Utilization Project (HCUP), Nationwide Readmissions Database (NRD), 2020.

  • In 2020, the average readmission cost was highest for hospital stays with a principal diagnosis of congenital malformations at index admission ($26,300). The lowest readmission cost was for hospital stays with a principal diagnosis of pregnancy/childbirth at index admission ($7,700).
  • Overall, the average cost of readmissions was 12.4 percent higher than the average cost of index admissions ($16,300 vs. $14,500).
  • The average cost of readmissions was higher than the average cost of index admissions for 11 conditions, including nervous system diseases ($17,100 vs. $14,200 for the index admission), blood diseases ($16,900 vs. $11,800), digestive diseases ($16,400 vs. $13,000), respiratory diseases ($16,400 vs. $12,700), eye/adnexa diseases ($15,800 vs. $10,100), ear/mastoid process diseases ($15,500 vs. $8,200), endocrine/metabolic diseases ($15,200 vs. $12,000), genitourinary system diseases ($15,200 vs. $11,300), skin diseases ($15,000 vs. $9,500), mental/behavioral disorders ($8,800 vs. $7,700), and pregnancy/childbirth ($7,700 vs. $5,800).

References

About Statistical Briefs

Healthcare Cost and Utilization Project (HCUP) Statistical Briefs provide basic descriptive statistics on a variety of topics using HCUP administrative healthcare data. Topics include hospital inpatient, ambulatory surgery, and emergency department use and costs, quality of care, access to care, medical conditions, procedures, and patient populations, among other topics. The reports are intended to generate hypotheses that can be further explored in other research; the reports are not designed to answer in-depth research questions using multivariate methods.

Data Source

The estimates in this Statistical Brief are based upon data from the Healthcare Cost and Utilization Project (HCUP) 2016-2020 Nationwide Readmissions Database (NRD).

Types of hospitals included in the HCUP Nationwide Readmissions Database
The NRD is based on data from community hospitals, which are defined as short-term, non-Federal, general, and other hospitals, excluding hospital units of other institutions (e.g., prisons). The NRD includes obstetrics and gynecology, otolaryngology, orthopedic, cancer, pediatric, public, and academic medical center hospitals. Excluded are long-term care facilities such as rehabilitation, long-term acute care, psychiatric, and alcoholism and chemical dependency hospitals. However, if a patient received long-term care, rehabilitation, or treatment for a psychiatric or chemical dependency condition in a community hospital, the discharge record for that stay will be included in the NRD.

Definitions

Readmissions
The 30-day readmission rate is defined as the number of admissions for each condition for which there was at least one subsequent hospital admission within 30 days, divided by the total number of admissions from January through November of the same year. That is, when patients are discharged from the hospital, they are followed for 30 days in the data. If any readmission to the same hospital or a different hospital occurs during this time period, the admission is counted as having a readmission. No more than one readmission is counted within the 30-day period because the outcome measure assessed is the "percentage of admissions that are readmitted." If a patient was transferred to a different hospital on the same day or was transferred within the same hospital, the two events were combined as a single stay and the second event was not counted as a readmission; that is, transfers were not considered a readmission. In the case of admissions for which there was more than one readmission in the 30-day period, the data presented in this Statistical Brief reflect the characteristics and costs of the first readmission.

Every qualifying hospital stay is counted as a separate initial (starting point) admission. Thus, a single patient can be counted multiple times during the course of the January through November observation period. In addition, initial admissions do not require a prior "clean period" with no hospitalizations; that is, a hospital stay may be a readmission for a prior stay and the initial admission for a subsequent readmission. Admissions were disqualified from the analysis as initial admissions if they could not be followed for 30 days for one of the following reasons: (1) the patient died in the hospital, (2) information on length of stay was missing, or (3) the patient was discharged in December.

Unit of analysis
The unit of analysis is the hospital discharge (i.e., the hospital stay), not a person or patient. This means that a person who is admitted to the hospital multiple times in 1 year will be counted each time as a separate discharge from the hospital.

Costs and charges
Total hospital charges were converted to costs using HCUP Cost-to-Charge Ratios based on hospital accounting reports from the Centers for Medicare & Medicaid Services (CMS)a. Costs reflect the actual expenses incurred in the production of hospital services, such as wages, supplies, and utility costs; charges represent the amount a hospital billed for the case. For each hospital, a hospitalwide cost-to-charge ratio is used. Hospital charges reflect the amount the hospital billed for the entire hospital stay and do not include professional (physician) fees. For the purposes of this Statistical Brief, costs are reported to the nearest hundred dollars.

Percentage change
Percentage change between years equals the 2020 value minus the 2016-2019 average value divided by the 2016-2019 average value, multiplied by 100.

Expected payer
To make coding uniform across all HCUP data sources, the primary expected payer for the hospital stay combines detailed categories into general groups:

  • Medicare: includes fee-for-service and managed care Medicare
  • Medicaid: includes fee-for-service and managed care Medicaid
  • Private insurance: includes commercial nongovernmental payers, regardless of the type of plan (e.g., private health maintenance organizations [HMOs], preferred provider organizations [PPOs])
  • Self-pay/No charge: includes self-pay, no charge, charity, and no expected payment
  • Other payers: includes other Federal and local government programs (e.g., TRICARE, CHAMPVA, Indian Health Service, Black Lung, Title V) and Workers' Compensation

For this Statistical Brief, a hierarchy was used to assign the payer category based on the primary and secondary expected payer to give precedence to public payers (Medicare and then Medicaid) over commercial insurance.

  • If the primary or secondary expected payer indicates Medicare, then the payer category is assigned to Medicare. This categorization includes patients who are dually eligible for Medicare and Medicaid under Medicare.
  • If not Medicare and the primary or secondary expected payer indicates Medicaid, then the payer category is Medicaid.
  • If not Medicare or Medicaid and the primary or secondary expected payer indicates private insurance, then the payer category is private.
  • If not Medicare, Medicaid, or private and the primary expected payer indicates self-pay, no charge, or other categories such as charity, then the payer category is self-pay/no charge.
  • Stays for other types of payers are not reported in this Statistical Brief because this is a small group of mixed payers such as State and local programs.

Categorization of readmission counts by expected payer was based on the index stay. The concordance between the expected payer coded at the index stay and the expected payer coded at readmission varies by payer: 98 percent for Medicare, 95 percent for Medicaid, 93 percent for private, and 80 percent for self-pay/no charge (percentages based on the 2013 NRD).

Location of patients' residence
Place of residence is based on the urban-rural classification scheme for U.S. counties developed by the National Center for Health Statistics (NCHS) and based on the Office of Management and Budget (OMB) definition of a metropolitan service area as including a city and a population of at least 50,000 residents:

  • Large Central Metropolitan: Counties in a metropolitan area with 1 million or more residents that satisfy at least one of the following criteria: (1) containing the entire population of the largest principal city of the metropolitan statistical area (MSA), (2) having their entire population contained within the largest principal city of the MSA, or (3) containing at least 250,000 residents of any principal city in the MSA
  • Large Fringe Metropolitan: Counties in a metropolitan area with 1 million or more residents that do not qualify as large central metropolitan counties
  • Medium Metropolitan: Counties in a metropolitan area of 250,000-999,999 residents
  • Small Metropolitan: Counties in a metropolitan area of 50,000-249,999 residents
  • Micropolitan: Counties in a nonmetropolitan area of 10,000-49,999 residents
  • Noncore: Counties in a nonmetropolitan and nonmicropolitan area

Reporting of race and ethnicity
Data on Hispanic ethnicity are collected differently among the States and also can differ from the census methodology of collecting information on race (White, Black, Asian/Pacific Islander, American Indian/Alaska Native, Other [including mixed race]) separately from ethnicity (Hispanic, non-Hispanic). State data organizations often collect Hispanic ethnicity as one of several categories that include race. Therefore, for multistate analyses, HCUP creates the combined categorization of race and ethnicity for data from States that report ethnicity separately. When a State data organization collects Hispanic ethnicity separately from race, HCUP uses Hispanic ethnicity to override any other race category to create a Hispanic category for the uniformly coded race and ethnicity data element, while also retaining the original race and ethnicity data. This Statistical Brief reports race and ethnicity for the following categories: Hispanic, non-Hispanic White, non-Hispanic Black, Asian/Pacific Islander, and non-Hispanic Other.

Diagnoses
The principal diagnosis is that condition established after study to be chiefly responsible for the patient's admission to the hospital.

ICD-10-CM
ICD-10-CM is the International Classification of Diseases, Tenth Revision, Clinical Modification.

Clinical Classifications Software Refined (CCSR) for ICD-10-CM Diagnoses
The CCSR aggregates ICD-10-CM diagnosis codes into a manageable number of clinically meaningful categories.b The CCSR is intended to be used analytically to examine patterns of healthcare in terms of cost, utilization, and outcomes; rank utilization by diagnoses; and risk-adjust by clinical condition. The CCSR capitalizes on the specificity of the ICD-10-CM coding scheme and allows ICD-10-CM codes to be classified in more than one category. Approximately 10 percent of diagnosis codes are associated with more than one CCSR category because the diagnosis code documents either multiple conditions or a condition along with a common symptom or manifestation. For this Statistical Brief, the principal diagnosis code is assigned to a single default CCSR based on clinical coding guidelines, etiology and pathology of diseases, and standards set by other Federal agencies. The assignment of the default CCSR for the principal diagnosis is available starting with version v2020.2 of the software tool. ICD-10-CM coding definitions for each CCSR category presented in this Statistical Brief can be found in the CCSR reference file, available at www.hcup-us.ahrq.gov/toolssoftware/ccsr/ccs_refined.jsp#download. For this Statistical Brief, v2022.1 of the CCSR was used.

Maternal/nonmaternal discharges
Maternal discharges are defined by Major Diagnostic Category (MDC) 14, Pregnancy, Childbirth and the Puerperium. MDC was assigned without using "present on admission" information on the record because not all HCUP data sources provide present on admission indicators.


About HCUP

The Healthcare Cost and Utilization Project (HCUP, pronounced "H-Cup") is a family of healthcare databases and related software tools and products developed through a Federal-State-Industry partnership and sponsored by the Agency for Healthcare Research and Quality (AHRQ). HCUP databases bring together the data collection efforts of State data organizations, hospital associations, and private data organizations (HCUP Partners) and the Federal government to create a national information resource of encounter-level healthcare data. HCUP includes the largest collection of longitudinal hospital care data in the United States, with all-payer, encounter-level information beginning in 1988. These databases enable research on a broad range of health policy issues, including cost and quality of health services, medical practice patterns, access to healthcare programs, and outcomes of treatments at the national, State, and local market levels.

HCUP would not be possible without the contributions of the following data collection Partners from across the United States:


About the NRD

The HCUP Nationwide Readmissions Database (NRD) is a calendar-year, discharge-level database constructed from the HCUP State Inpatient Databases (SID) with verified patient linkage numbers that can be used to track a person across hospitals within a State. The 2010-2020 NRD are available for purchase through the HCUP Central Distributor. The NRD is designed to support various types of analyses of national readmission rates. The database includes discharges for patients with and without repeat hospital visits in a year and those who have died in the hospital. Repeat stays may or may not be related. The criteria to determine the relationship between hospital admissions are left to the analyst using the NRD. The NRD was constructed as a sample of convenience consisting of 100 percent of the eligible discharges. Discharge weights for national estimates are developed using the target universe of community hospitals (excluding rehabilitation and long-term acute care hospitals) in the United States. Over time, the sampling frame for the NRD will change; thus, the number of States contributing to the NRD will vary from year to year. The NRD is intended for national estimates only; no regional, State-, or hospital-specific estimates can be produced. The unweighted sample size for the 2020 NRD is 16,692,694 (weighted, this represents 32,336,475 inpatient stays). The unweighted sample size for the 2016 NRD is 17,197,683 (weighted, this represents 35,660,906 inpatient stays).

For More Information

For other information on readmissions and revisits, refer to the HCUP Statistical Briefs topic area located at https://www.hcup-us.ahrq.gov/reports/statbriefs/sb_readmission.jsp.

For additional HCUP statistics, visit:

For more information about HCUP, visit www.hcup-us.ahrq.gov/.

For a detailed description of HCUP and more information on the design of the Nationwide Readmissions Database (NRD), please refer to the following database documentation:

Agency for Healthcare Research and Quality. Overview of the Nationwide Readmissions Database (NRD). Healthcare Cost and Utilization Project (HCUP). Rockville, MD: Agency for Healthcare Research and Quality. Updated October 2021. www.hcup-us.ahrq.gov/nrdoverview.jsp.

Suggested Citation

Jiang HJ, Hensche MK. Characteristics of 30-Day All-Cause Hospital Readmissions, 2016-2020. HCUP Statistical Brief #304. Rockville, MD: Agency for Healthcare Research and Quality; September 2023 www.hcup-us.ahrq.gov/reports/statbriefs/sb304-readmissions-2016-2020.pdf.

Acknowledgments

The authors would like to acknowledge the contributions of Minya Sheng, formerly of IBM Watson Health.

***

AHRQ welcomes questions and comments from readers of this publication who are interested in obtaining more information about access, cost, use, financing, and quality of healthcare in the United States. We also invite you to tell us how you are using this Statistical Brief and other HCUP data and tools, and to share suggestions on how HCUP products might be enhanced to further meet your needs. Please email us at hcup@ahrq.gov or send a letter to the address below:

Joel W. Cohen, Ph.D., Director
Center for Financing, Access and Cost Trends
Agency for Healthcare Research and Quality
5600 Fishers Lane
Rockville, MD 20857

This Statistical Brief was posted online on September 22, 2023.

a Agency for Healthcare Research and Quality. Cost-to-Charge Ratio (CCR) Files. Healthcare Cost and Utilization Project (HCUP). Updated November 3, 2021. www.hcup-us.ahrq.gov/db/state/costtocharge.jsp. Accessed March 9, 2022.

b Agency for Healthcare Research and Quality. Clinical Classifications Software Refined (CCSR) for ICD-10-CM Diagnoses. Healthcare Cost and Utilization Project (HCUP). Updated December 9, 2022. www.hcup-us.ahrq.gov/toolssoftware/ccsr/dxccsr.jsp


Internet Citation: Statistical Brief #304. Healthcare Cost and Utilization Project (HCUP). September 2023. Agency for Healthcare Research and Quality, Rockville, MD. www.hcup-us.ahrq.gov/reports/statbriefs/sb304-readmissions-2016-2020.jsp.
Are you having problems viewing or printing pages on this website?
If you have comments, suggestions, and/or questions, please contact hcup@ahrq.gov.
Privacy Notice, Viewers & Players
Last modified 9/22/23