STATISTICAL BRIEF #223 |
May 2017
(Revised February 2018)* (Revised July 2020)** Claudia A. Steiner, M.D., M.P.H., Zeynal Karaca, Ph.D., Brian J. Moore, Ph.D., Melina C. Imshaug, M.P.H., and Gary Pickens, Ph.D. Introduction Ambulatory surgery (AS), or outpatient surgery, is a planned operation for which the patient is not expected to be admitted to the hospital. Comparison of ambulatory surgery with inpatient surgery is essential for understanding utilization patterns for specific surgical procedures, including changing trends and estimates of total surgical volumes. As the number of surgical procedures capable of being safely performed in an ambulatory setting increases, comparisons of ambulatory surgery with inpatient surgery can also be useful in the evaluation of post-surgical complications, hospital cost savings, and patient experience of care surveys. Self-reported facility estimates from the American Hospital Association suggest that a growing share of all surgeries at community hospitals in the United States are performed in the AS setting (66 percent in 2014, up from 57 percent in 1994),1 although an ambiguous definition for AS introduces variation across facility volume estimates. Recent reports on specific surgical procedure trends in a subset of States also point to a shift from the inpatient surgical setting to the AS setting.2,3 Nationally representative AS estimates for a broad group of surgical procedures do not yet exist. This Healthcare Cost and Utilization Project (HCUP) Statistical Brief presents national data on surgeries performed in two hospital settings: hospital inpatient and hospital-based AS settings. The findings in this Statistical Brief represent an update and expansion of 2012 statistics previously reported.4 Procedures performed in freestanding (non-hospital-owned) AS centers were not included because many State AS data sources do not include these types of centers. The analysis was limited to visits for an invasive surgery commonly performed for therapeutic purposes (i.e., to treat disease or injury); excluded were noninvasive surgeries and surgeries typically used for diagnostic or exploratory purposes (e.g., colonoscopy). The HCUP Surgery Flag Software for the International Classification of Diseases, Ninth Revision, Clinical Modification (ICD-9-CM)5 and the HCUP Surgery Flag Software for Services and Procedures6 were used to identify invasive, therapeutic surgeries based on a narrow and targeted definition.7 This report presents characteristics of outpatient surgery visits and hospital inpatient stays for invasive, therapeutic surgical procedures. All references to surgeries, outpatient surgeries, or ambulatory surgeries refer to this subset of surgeries. We also present the distribution of outpatient surgeries compared with inpatient surgical procedures by payer, body system, and the most common surgical procedures performed in an outpatient setting overall and by payer. In addition, ambulatory and inpatient volume and procedure rates are compared for each procedure. Unless otherwise noted, volumes and rates are based on all-listed procedure codes. |
|
All differences between estimates noted in the text are statistically significant at the .05 level or better.
* Figure 2 of this Statistical Brief was revised to include secondary inpatient surgical procedures that were not included in the original version. This only affected Figure 2 and resulted in an increase in the percentage of surgical visits or stays that occurred in the inpatient setting. ** This Statistical Brief was revised to use an updated version of a nationwide ambulatory surgery analytic file that was created from the 2014 State Ambulatory Surgery and Services Databases (SASD) and weighted for national estimates. The update involved a change to the census region assigned to a subset of hospitals in the sample. This change affected the encounter weights used to produce national estimates, resulting in minor changes to ambulatory surgery totals and related percentages and rankings reported in this Statistical Brief. Findings Characteristics of invasive, therapeutic surgeries performed in hospital-based ambulatory surgery compared with hospital inpatient settings, 2014 Table 1 presents characteristics of community hospital visits for invasive, therapeutic surgeries performed in the ambulatory (outpatient) surgery setting versus the hospital inpatient setting (admitted to the hospital) in 2014. |
| Table 1. Characteristics of hospital visits or stays for invasive, therapeutic surgery performed in hospital-based ambulatory and inpatient settings, 2014 | ||
| Characteristic | Ambulatory setting | Inpatient setting |
|---|---|---|
| Total visits or stays for surgeries | ||
| Total number, N | 9,915,100 | 7,247,600 |
| Percent of total visits or stays for surgeries, % | 57.8 | 42.2 |
| Total surgeries | ||
| Total number, N | 11,474,800 | 10,303,000 |
| Percent of total surgeries, % | 52.7 | 47.3 |
| Number of surgeries per visit or stay, mean | 1.2 | 1.4 |
| Length of stay, mean, days | 0.2 | 6.0 |
| Visits or stays by type of community hospital, % | ||
| By hospital bed size | ||
| Large | 53.9 | 58.3 |
| Medium | 26.1 | 26.3 |
| Small | 20.0 | 15.4 |
| By hospital location, teaching status | ||
| Rural | 14.6 | 6.6 |
| Urban nonteaching | 27.7 | 24.6 |
| Urban teaching | 57.7 | 68.8 |
| By control/ownership of hospital | ||
| Non-Federal government | 12.2 | 11.5 |
| Private not-for-profit | 76.9 | 73.7 |
| Private for-profit | 8.3 | 14.7 |
| Note: Only invasive, therapeutic surgeries that are performed and reliably reported in the hospital-based ambulatory surgery setting were included. Source: Agency for Healthcare Research and Quality (AHRQ), Center for Delivery, Organization, and Markets, Healthcare Cost and Utilization Project (HCUP), National Inpatient Sample (NIS) and nationwide ambulatory surgery analytic file created from the State Ambulatory Surgery and Services Databases (SASD), weighted for national estimates, 2014 | ||
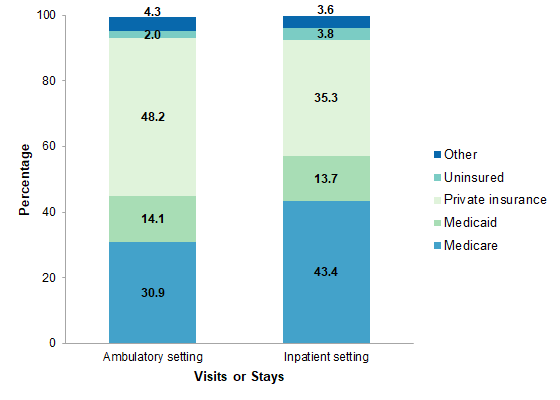
Hospital visits or stays with invasive, therapeutic surgeries by payer, 2014 Figure 1 presents the distribution of hospital visits or stays involving invasive, therapeutic surgeries performed in the ambulatory (outpatient) surgery setting versus the hospital inpatient setting (admitted to the hospital) by expected primary payer in 2014. |
|
Figure 1. Hospital visits or stays with invasive, therapeutic surgeries by expected primary payer, 2014
Notes: Only invasive, therapeutic surgeries that are performed and reliably reported in the hospital-based ambulatory surgery setting were included. "Other" payer includes Workers Compensation, TRICARE/CHAMPUS, CHAMPVA, Title V, and other government programs. Bar chart that shows the percentage of hospital visits or stays with invasive, therapeutic surgeries in 2014 by expected payer. Ambulatory setting: 30.9% Medicare; 14.1% Medicaid; 48.2% private insurance; 2.0% uninsured; 4.3% other. Inpatient setting: 43.4% Medicare; 13.7% Medicaid; 35.3% private insurance; 3.8% uninsured; 3.6% other. |
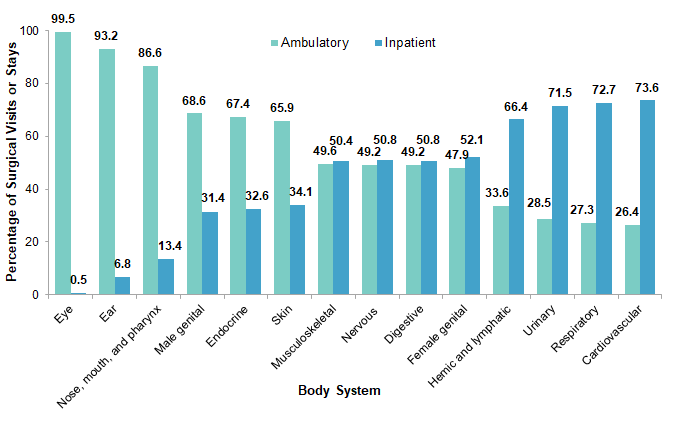
Comparison of invasive, therapeutic surgeries by body system in hospital-based ambulatory surgery versus inpatient settings, 2014 Figure 2 shows the distribution of invasive, therapeutic surgeries by body system that were performed in the AS and hospital inpatient settings in 2014. |
|
Figure 2. Ambulatory versus inpatient invasive, therapeutic surgeries in the United States by body system, 2014
Notes: Only invasive, therapeutic surgeries that are performed and reliably reported in the hospital-based ambulatory surgery setting were included. Body systems are based on Clinical Classifications Software (CCS) and Clinical Classifications Software for Services and Procedures. Gastric bypass and volume reduction, which is not classified by the CCS, has been included with the digestive body system. Percentage of surgical visits or stays is calculated using unrounded data. Bar chart that shows the percentage of surgical visits or stays in 2014 by body system. Eye: 99.5% ambulatory; 0.5% inpatient. Ear: 93.2% ambulatory, 6.8% inpatient. Nose, mouth, and pharynx: 86.6% ambulatory; 13.4% inpatient. Male genital: 68.6% ambulatory; 31.4% inpatient. Endocrine: 67.4% ambulatory; 32.6% inpatient. Skin: 65.9% ambulatory; 34.1% inpatient. Musculoskeletal: 49.6% ambulatory; 50.4% inpatient. Nervous: 49.2% ambulatory; 50.8% inpatient. Digestive: 49.2% ambulatory; 50.8% inpatient. Female genital: 47.9% ambulatory; 52.1% inpatient. Hemic and lymphatic: 33.6% ambulatory; 66.4% inpatient. Urinary: 28.5% ambulatory; 71.5% inpatient. Respiratory: 27.3% ambulatory; 72.7% inpatient. Cardiovascular: 26.4% ambulatory; 73.6% inpatient.
|
The most common ambulatory invasive, therapeutic surgeries performed, 2014 Table 2 lists the 25 most common, invasive, therapeutic clinically grouped surgeries that were performed in the hospital-based ambulatory surgery setting in the United States in 2014, along with the percentage of these types of surgeries that were performed in the ambulatory versus inpatient setting. Surgeries are ranked from most to least common in the AS setting. A comprehensive list of the distribution between outpatient and inpatient settings for all specific, invasive, therapeutic surgeries by body system is presented in the appendix. |
| Table 2. The 25 most common ambulatory invasive, therapeutic surgeries performed in community hospitals in the United States, 2014 | ||||||
| All-listed CCS procedures | All AS, % | Surgeries, Na | Surgeries, N per 100,000 populationb | Surgeries performed in ambulatory setting, % | ||
|---|---|---|---|---|---|---|
| AS | Inpatient | AS | Inpatient | |||
| Lens and cataract procedures | 12.4 | 1,419,100 | 1,000 | 447.4 | 0.3 | 99.9 |
| Muscle, tendon, and soft tissue OR procedures | 6.6 | 755,500 | 295,300 | 238.2 | 93.1 | 71.9 |
| Incision or fusion of joint, destruction of joint lesion | 5.3 | 608,700 | 147,800 | 191.9 | 46.6 | 80.5 |
| Cholecystectomy and common duct exploration | 5.0 | 577,400 | 372,600 | 182.0 | 117.5 | 60.8 |
| Excision of semilunar cartilage of knee | 4.5 | 513,600 | 6,900 | 161.9 | 2.2 | 98.7 |
| Inguinal and femoral hernia repair | 3.8 | 435,900 | 38,300 | 137.4 | 12.1 | 91.9 |
| Repair of diaphragmatic, incisional, and umbilical hernia | 3.3 | 376,400 | 239,000 | 118.7 | 75.3 | 61.2 |
| Tonsillectomy and/or adenoidectomy | 3.1 | 356,100 | 16,800 | 112.3 | 5.3 | 95.5 |
| Decompression peripheral nerve | 2.8 | 322,500 | 16,300 | 101.7 | 5.1 | 95.2 |
| OR procedures of skin and breast, including plastic procedures on breast | 2.8 | 325,500 | 88,100 | 102.6 | 27.8 | 78.7 |
| Myringotomy | 2.6 | 298,600 | 8,300 | 94.1 | 2.6 | 97.3 |
| Lumpectomy, quadrantectomy of breast | 2.6 | 296,500 | 8,000 | 93.5 | 2.5 | 97.4 |
| Insertion, revision, replacement, removal of cardiac pacemaker or cardioverter/defibrillator | 2.5 | 286,400 | 245,600 | 90.3 | 77.4 | 53.8 |
| Non-fracture, non-arthroplasty OR procedures on the bone | 2.4 | 279,800 | 139,800 | 88.2 | 44.1 | 66.7 |
| Hysterectomy, abdominal and vaginal | 2.4 | 276,100 | 237,500 | 87.0 | 74.9 | 53.8 |
| Partial excision bone | 2.2 | 251,500 | 358,900 | 79.3 | 113.2 | 41.2 |
| Laminectomy, excision intervertebral disc | 1.9 | 219,900 | 438,300 | 69.3 | 138.2 | 33.4 |
| Appendectomy | 1.8 | 208,800 | 238,800 | 65.8 | 75.3 | 46.6 |
| Vascular stents and OR procedures, other than head or neck | 1.8 | 206,200 | 1,000,500 | 65.0 | 315.4 | 17.1 |
| Testicular, prostate, and penile OR procedures | 1.6 | 187,300 | 22,100 | 59.1 | 7.0 | 89.4 |
| Vaginal, vulvar, and female pelvic OR procedures | 1.6 | 187,600 | 74,500 | 59.1 | 23.5 | 71.6 |
| Bunionectomy or repair of toe deformities | 1.6 | 185,800 | 2,900 | 58.6 | 0.9 | 98.5 |
| OR procedures of mouth, nose, and throat, excluding tonsils and teeth | 1.5 | 175,100 | 76,400 | 55.2 | 24.1 | 69.6 |
| Plastic procedures on nose | 1.4 | 164,900 | 14,600 | 52.0 | 4.6 | 91.9 |
| Lymph node biopsies and excisions, bone marrow procedures | 1.3 | 152,200 | 301,100 | 48.0 | 94.9 | 33.6 |
| Abbreviations: AS, ambulatory surgery; CCS, Clinical Classifications Software; OR, operating room Notes: Only invasive, therapeutic surgeries that are performed and reliably reported in the hospital-based ambulatory surgery setting were included. Procedures are based on the Clinical Classifications Software (CCS) and Clinical Classifications Software for Services and Procedures. For more information on the CCS categories, please see the Appendix. a The number of discharges was rounded to the nearest 100. b Based on population estimates from the U.S. Census Bureau Source: Agency for Healthcare Research and Quality (AHRQ), Center for Delivery, Organization, and Markets, Healthcare Cost and Utilization Project (HCUP), National Inpatient Sample (NIS) and nationwide ambulatory surgery analytic file created from the State Ambulatory Surgery and Services Databases (SASD), weighted for national estimates, 2014 | ||||||
The most common ambulatory invasive, therapeutic surgeries performed by payer, 2014 Table 3 lists the five most common, invasive, therapeutic surgeries that were performed in the hospital-based AS setting by payer in 2014, along with the percentage of these types of surgeries that were performed in the ambulatory versus inpatient setting. Surgeries are ranked from most to least common in the AS setting for patients with expected primary payers of Medicare, Medicaid, private insurance, and uninsured. |
| Table 3. The five most common ambulatory invasive, therapeutic surgeries performed in community hospitals in the United States by payer, 2014 | |||
| All-listed CCS procedures | Surgeries, Na | Surgeries performed in ambulatory setting, % | |
|---|---|---|---|
| AS | Inpatient | ||
| Medicare | |||
| Lens and cataract procedures | 985,000 | 400 | 100.0 |
| Insertion, revision, replacement, removal of cardiac pacemaker or cardioverter/defibrillator | 210,800 | 178,400 | 54.2 |
| Muscle, tendon, and soft tissue OR procedures | 186,600 | 119,600 | 60.9 |
| Vascular stents and OR procedures, other than head or neck | 136,700 | 551,800 | 19.9 |
| Inguinal and femoral hernia repair | 131,600 | 19,600 | 87.0 |
| Medicaid | |||
| Tonsillectomy and/or adenoidectomy | 140,400 | 7,400 | 95.0 |
| Myringotomy | 124,800 | 3,600 | 97.2 |
| Cholecystectomy and common duct exploration | 108,100 | 68,600 | 61.2 |
| Muscle, tendon, and soft tissue OR procedures | 83,200 | 48,600 | 63.1 |
| Lens and cataract procedures | 76,400 | 300 | 99.6 |
| Private Insurance | |||
| Muscle, tendon, and soft tissue OR procedures | 404,900 | 91,500 | 81.6 |
| Incision or fusion of joint, destruction of joint lesion | 361,600 | 51,900 | 87.4 |
| Cholecystectomy and common duct exploration | 328,900 | 133,900 | 71.1 |
| Excision of semilunar cartilage of knee | 328,100 | 2,900 | 99.1 |
| Lens and cataract procedures | 318,400 | 200 | 99.9 |
| Uninsured | |||
| OR procedures of skin and breast, including plastic procedures on breast | 45,400 | 4,800 | 90.4 |
| Cholecystectomy and common duct exploration | 15,700 | 31,500 | 33.3 |
| Appendectomy | 13,800 | 21,100 | 39.5 |
| Lens and cataract procedures | 13,700 | 100 | 99.3 |
| Muscle, tendon, and soft tissue OR procedures | 10,700 | 18,100 | 37.2 |
| Abbreviation: AS, ambulatory surgery; CCS, Clinical Classifications Software; OR, operating room Notes: Only invasive, therapeutic surgeries that are performed and reliably reported in the hospital-based ambulatory surgery setting were included. Procedures are based on the Clinical Classifications Software (CCS) and Clinical Classifications Software for Services and Procedures. For more information on the CCS categories, please see the Appendix. a The number of discharges was rounded to the nearest 100. Source: Agency for Healthcare Research and Quality (AHRQ), Center for Delivery, Organization, and Markets, Healthcare Cost and Utilization Project (HCUP), National Inpatient Sample (NIS) and nationwide ambulatory surgery analytic file created from the State Ambulatory Surgery and Services Databases (SASD), weighted for national estimates, 2014 | |||
|
| Appendix. Invasive, therapeutic surgeries, listed by body system, performed in community hospitals in the United States by setting (ambulatory versus inpatient), 2014 | |||||
| All-listed procedures (CCS number and description) | Surgeries, Na | Surgeries, N per 100,000 populationb | Surgeries performed in ambulatory setting, % | ||
|---|---|---|---|---|---|
| AS | Inpatient | AS | Inpatient | ||
| Operations on the nervous system | |||||
| 3: Laminectomy, excision intervertebral disc | 219,900 | 438,300 | 69.3 | 138.2 | 33.4 |
| 6: Decompression peripheral nerve | 322,500 | 16,300 | 101.7 | 5.1 | 95.2 |
| 9: Other OR therapeutic nervous system procedures | 81,800 | 191,100 | 25.8 | 60.3 | 30.0 |
| Operations on the endocrine system | |||||
| 10: Thyroidectomy, partial or complete | 101,600 | 29,700 | 32.0 | 9.4 | 77.4 |
| 12: Other therapeutic endocrine procedures | 39,400 | 38,500 | 12.4 | 12.1 | 50.6 |
| Operations on the eye | |||||
| 13: Corneal transplant | 30,100 | 300 | 9.5 | 0.1 | 99.0 |
| 15: Lens and cataract procedures | 1,419,100 | 1,000 | 447.4 | 0.3 | 99.9 |
| 16: Repair of retinal tear, detachment | 109,600 | 1,000 | 34.5 | 0.3 | 99.1 |
| 21: Other extraocular muscle and orbit therapeutic procedures | 70,500 | 6,200 | 22.2 | 1.9 | 91.9 |
| Operations on the ear | |||||
| 22: Tympanoplasty | 26,500 | 700 | 8.3 | 0.2 | 97.4 |
| 23: Myringotomy | 298,600 | 8,300 | 94.1 | 2.6 | 97.3 |
| 24: Mastoidectomy | 17,100 | 2,500 | 5.4 | 0.8 | 87.2 |
| 26: Other therapeutic ear procedures | 29,800 | 15,600 | 9.4 | 4.9 | 65.6 |
| Operations on the nose, mouth, and pharynx | |||||
| 28: Plastic procedures on nose | 164,900 | 14,600 | 52.0 | 4.6 | 91.9 |
| 30: Tonsillectomy and/or adenoidectomy | 356,100 | 16,800 | 112.3 | 5.3 | 95.5 |
| 33: Other OR therapeutic procedures on nose, mouth and pharynx (OR procedures of mouth, nose, and throat, excluding tonsils and teeth) | 175,100 | 76,400 | 55.2 | 24.1 | 69.6 |
| Operations on the respiratory system | |||||
| 42: Other OR therapeutic procedures on respiratory system and mediastinum | 39,100 | 104,300 | 12.3 | 32.9 | 27.3 |
| Operations on the cardiovascular system | |||||
| 48: Insertion, revision, replacement, removal of cardiac pacemaker or cardioverter/defibrillator | 286,400 | 245,600 | 90.3 | 77.4 | 53.8 |
| 53: Varicose vein stripping, lower limb | 29,700 | 500 | 9.4 | 0.1 | 98.3 |
| 57: Creation, revision and removal of arteriovenous fistula or vessel-to-vessel cannula for dialysis | 150,400 | 38,400 | 48.4 | 12.1 | 80.0 |
| 61: Other OR procedures on vessels other than head and neck (vascular stents and OR procedures, other than head or neck) | 206,200 | 1,000,500 | 65.0 | 315.4 | 17.1 |
| 63: Other non-OR therapeutic cardiovascular procedures | 33,700 | 689,600 | 10.6 | 217.4 | 4.7 |
| Operations on the hemic and lymphatic system | |||||
| 67: Other therapeutic procedures, hemic and lymphatic system (lymph node biopsies and excisions, bone marrow procedures) | 152,200 | 301,100 | 48.0 | 94.9 | 33.6 |
| Operations on the digestive system | |||||
| 78: Colorectal resection | 7,500 | 302,500 | 2.4 | 95.4 | 2.4 |
| 80: Appendectomy | 208,800 | 238,800 | 65.8 | 75.3 | 46.6 |
| 84: Cholecystectomy and common duct exploration | 577,400 | 372,600 | 182.0 | 117.5 | 60.8 |
| 85: Inguinal and femoral hernia repair | 435,900 | 38,300 | 137.4 | 12.1 | 91.9 |
| 86: Other hernia repair (repair of diaphragmatic, incisional, and umbilical hernia) | 376,400 | 239,000 | 118.7 | 75.3 | 61.2 |
| 87: Laparoscopy (GI only) | 114,900 | 57,700 | 36.2 | 18.2 | 66.6 |
| 94: Other OR upper GI therapeutic procedures | 7,700 | 159,100 | 2.4 | 50.2 | 4.6 |
| 96: Other OR lower GI therapeutic procedures | 53,200 | 266,500 | 16.8 | 84.0 | 16.6 |
| 99: Other OR gastrointestinal therapeutic procedures | 34,400 | 230,300 | 10.8 | 72.6 | 13.0 |
| 244: Gastric bypass and volume reductionc | 31,400 | 0 | 9.9 | 0.0 | 100.0 |
| Operations on the urinary system | |||||
| 100: Endoscopy and endoscopic biopsy of the urinary tract | 16,400 | 161,100 | 5.2 | 50.8 | 9.2 |
| 101: Transurethral excision, drainage, or removal urinary obstruction | 4,600 | 104,300 | 1.4 | 32.9 | 4.2 |
| 106: Genitourinary incontinence procedures | 88,800 | 24,100 | 28.0 | 7.6 | 78.7 |
| 109: Procedures on the urethra | 23,900 | 28,800 | 7.5 | 9.1 | 45.4 |
| 112: Other OR therapeutic procedures of urinary tract | 28,100 | 87,100 | 8.8 | 27.4 | 24.4 |
| Operations on the male genital system | |||||
| 113: Transurethral resection of prostate (TURP) | 56,400 | 29,100 | 17.8 | 9.2 | 66.0 |
| 114: Open prostatectomy | 3,400 | 61,600 | 1.1 | 19.4 | 5.2 |
| 118: Other OR therapeutic procedures, male genital (testicular, prostate, and penile OR procedures) | 187,300 | 22,100 | 59.1 | 7.0 | 89.4 |
| Operations on the female genital system | |||||
| 119: Oophorectomy, unilateral and bilateral | 99,800 | 182,400 | 31.5 | 57.5 | 35.4 |
| 121: Ligation or occlusion of fallopian tubes | 103,600 | 254,500 | 32.7 | 80.2 | 28.9 |
| 124: Hysterectomy, abdominal and vaginal | 276,100 | 237,500 | 87.0 | 74.9 | 53.8 |
| 125: Other excision of cervix and uterus | 16,000 | 38,100 | 5.1 | 12.0 | 29.6 |
| 129: Repair of cystocele and rectocele, obliteration of vaginal vault | 68,300 | 30,000 | 21.5 | 9.5 | 69.5 |
| 132: Other OR therapeutic procedures, female organs (vaginal, vulvar, and female pelvic OR procedures) | 187,600 | 74,500 | 59.1 | 23.5 | 71.6 |
| Operations on the musculoskeletal system | |||||
| 142: Partial excision bone | 251,500 | 358,900 | 79.3 | 113.2 | 41.2 |
| 143: Bunionectomy or repair of toe deformities | 185,800 | 2,900 | 58.6 | 0.9 | 98.5 |
| 144: Treatment, facial fracture or dislocation | 53,400 | 27,200 | 16.8 | 8.6 | 66.3 |
| 145: Treatment, fracture or dislocation of radius and ulna | 117,800 | 60,100 | 37.2 | 19.0 | 66.2 |
| 147: Treatment, fracture or dislocation of lower extremity (other than hip or femur) | 142,000 | 196,600 | 44.8 | 62.0 | 41.9 |
| 148: Other fracture and dislocation procedure | 109,300 | 167,600 | 34.5 | 52.9 | 39.5 |
| 149: Arthroscopy | 98,700 | 9,600 | 31.1 | 3.0 | 91.1 |
| 150: Division of joint capsule, ligament or cartilage | 69,200 | 14,300 | 21.8 | 4.5 | 82.9 |
| 151: Excision of semilunar cartilage of knee | 513,600 | 6,900 | 161.9 | 2.2 | 98.7 |
| 152: Arthroplasty knee | 37,300 | 753,000 | 11.8 | 237.4 | 4.7 |
| 153: Hip replacement, total and partial | 21,200 | 523,100 | 6.7 | 164.9 | 3.9 |
| 154: Arthroplasty other than hip or knee | 49,900 | 104,500 | 15.7 | 33.0 | 32.3 |
| 157: Amputation of lower extremity | 34,500 | 146,600 | 10.9 | 46.2 | 19.1 |
| 158: Spinal fusion | 38,000 | 463,800 | 12.0 | 146.2 | 7.6 |
| 160: Other therapeutic procedures on muscles and tendons (muscle, tendon, and soft tissue OR procedures) | 755,500 | 295,300 | 238.2 | 93.1 | 71.9 |
| 161: Other OR therapeutic procedures on bone (non-fracture, non-arthroplasty OR procedures on the bone) | 279,800 | 139,800 | 88.2 | 44.1 | 66.7 |
| 162: Other OR therapeutic procedures on joints (incision or fusion of joint, destruction of joint lesion) | 608,700 | 147,800 | 191.9 | 46.6 | 80.5 |
| 164: Other OR therapeutic procedures on musculoskeletal system | 36,700 | 45,700 | 11.6 | 14.4 | 44.5 |
| Operations on the integumentary (skin) system | |||||
| 166: Lumpectomy, quadrantectomy of breast | 296,500 | 8,000 | 93.5 | 2.5 | 97.4 |
| 167: Mastectomy | 61,200 | 42,600 | 19.3 | 13.4 | 59.0 |
| 174: Other non-OR therapeutic procedures on skin and breast | 17,600 | 223,400 | 5.5 | 70.4 | 7.3 |
| 175: Other OR therapeutic procedures on skin and breast (OR procedures of skin and breast, including plastic procedures on breast) | 325,500 | 88,100 | 102.6 | 27.8 | 78.7 |
| Abbreviations: AS, ambulatory surgery; CCS, Clinical Classifications Software; OR, operating room; GI, gastrointestinal Notes: Only invasive, therapeutic surgeries that are performed and reliably reported in the hospital-based ambulatory surgery setting were included. Procedures are based on the Clinical Classifications Software (CCS) and the CCS for Services and Procedures. Statistics are based on the "narrow" definition of the HCUP Surgery Flag software. a The number of discharges was rounded to the nearest 100. b Based on population estimates from the U.S. Census Bureau c The gastric bypass and volume reduction CCS category (244) does not exist in the ICD-9-CM categorization. Inpatient gastric bypass and volume reductions are included in alternative categories, such as CCS 94, Other upper GI Therapeutic procedures. Source: Agency for Healthcare Research and Quality (AHRQ), Center for Delivery, Organization, and Markets, Healthcare Cost and Utilization Project (HCUP), National Inpatient Sample (NIS) and nationwide ambulatory surgery analytic file created from the State Ambulatory Surgery and Services Databases (SASD), weighted for national estimates, 2014 | |||||
Data Source
The estimates in this Statistical Brief are based upon data from the Healthcare Cost and Utilization Project (HCUP) 2014 National Inpatient Sample (NIS) and 2014 nationwide ambulatory surgery analytic file created from the State Ambulatory Surgery and Services Databases (SASD), weighted for national estimates. This report evaluates both inpatient and outpatient surgery data. SASD from 22 States were used to create the nationwide ambulatory surgery analytic file: California, Florida, Georgia, Illinois, Indiana, Iowa, Kansas, Kentucky, Maryland, Minnesota, Missouri, Nebraska, Nevada, New Jersey, New York, North Carolina, North Dakota, Oklahoma, Oregon, Pennsylvania, South Dakota, and Texas. The ambulatory surgery analytic file included 2.0 million unweighted discharges. The study population in the ambulatory surgery analytic file includes discharges with invasive, therapeutic surgeries from community, nonrehabilitation hospitals with a service type of either general acute care or children's hospital. Weights for national estimates were developed using stratification on hospital characteristics (census region, bed size, location/teaching status, ownership). Supplemental sources included population denominator data for use with HCUP databases, derived from information available from the Bureau of the Census.8 Definitions Procedures, ICD-9-CM, Current Procedural Terminology (CPT®), and Clinical Classifications Software (CCS) All-listed procedures include all procedures performed during the hospital stay, whether for definitive treatment or for diagnostic or exploratory purposes. The first-listed procedure is the procedure that is listed first on the discharge record. Inpatient data define this as the principal procedure—the procedure that is performed for definitive treatment rather than for diagnostic or exploratory purposes (i.e., the procedure that was necessary to take care of a complication). Procedures on inpatient hospitalization records are coded using the International Classification of Diseases, Ninth Revision, Clinical Modification (ICD-9-CM); procedures on ambulatory surgery and services records can be coded using either ICD-9-CM or the CPT. ICD-9-CM and CPT both assign numeric codes to procedures; ICD-9-CM is limited to procedures in the inpatient setting. There are approximately 4,000 ICD-9-CM procedure codes and 9,600 CPT procedure codes. CCS categorizes ICD-9-CM procedure codes into a manageable number of clinically meaningful categories.9 This clinical grouper makes it easier to quickly understand patterns of procedure use. When CPT was used on ambulatory surgery records, the CCS for Services and Procedures10 was used to classify procedures into groupings comparable to the CCS. Case definition For this report, the case definition was based on criteria developed with 2012 ambulatory surgery data and validated against other datasets. To facilitate comparisons across years, the same CCS procedure categories that were selected for inclusion in 2012 were used to create a 2014 nationwide ambulatory surgery analytic file. For this report, records from the SASD meeting the following criteria were included in the nationwide ambulatory surgery analytic file:
For this report, records from the NIS meeting the following criteria were included:
Therefore, the implied hierarchy of surgeries can be considered as follows:
Types of hospitals included in the HCUP National Inpatient Sample The National Inpatient Sample (NIS) is based on data from community hospitals, which are defined as short-term, non-Federal, general, and other hospitals, excluding hospital units of other institutions (e.g., prisons). The NIS includes obstetrics and gynecology, otolaryngology, orthopedic, cancer, pediatric, public, and academic medical hospitals. Excluded are long-term care facilities such as rehabilitation, psychiatric, and alcoholism and chemical dependency hospitals. Beginning in 2012, long-term acute care hospitals are also excluded. However, if a patient received long-term care, rehabilitation, or treatment for a psychiatric or chemical dependency condition in a community hospital, the discharge record for that stay will be included in the NIS. Types of hospitals included in HCUP State Ambulatory Surgery and Services Databases This analysis used State Ambulatory Surgery and Services Databases (SASD) limited to data from hospital-owned ambulatory surgery facilities. Although some SASD include data from facilities not owned by a hospital, those facilities were excluded from this analysis. The designation of a facility as hospital-owned is specific to its financial relationship with a hospital that provides inpatient care and is not related to its physical location. Ambulatory surgery performed in hospital-owned facilities may be performed within the hospital, in a facility attached to the hospital, or in a facility physically separated from the hospital. The analysis was further limited to ambulatory surgeries performed at facilities owned by community hospitals. Community hospitals are defined as short-term, non-Federal, general, and other specialty hospitals, excluding hospital units of other institutions (e.g., prisons). We limited the analysis to community hospitals with at least 100 ambulatory surgery visits per year. Unit of analysis The unit of analysis is the ambulatory surgery visit or hospital discharge (i.e., the hospital stay), not a person or patient. This means that a person who is admitted to the hospital multiple times in 1 year will be counted each time as a separate discharge from the hospital. Hospital location The classification of whether a hospital is in a metropolitan area (urban) or nonmetropolitan area (rural) is defined from the American Hospital Association (AHA) Annual Survey, using the 1993 U.S. Office of Management and Budget definition. Payer Payer is the expected payer for the hospital stay. To make coding uniform across all HCUP data sources, payer combines detailed categories into general groups:
Hospital stays billed to the State Children's Health Insurance Program (SCHIP) may be classified as Medicaid, Private Insurance, or Other, depending on the structure of the State program. Because most State data do not identify patients in SCHIP specifically, it is not possible to present this information separately. For this Statistical Brief, when more than one payer is listed for a hospital discharge, the first-listed payer is used. About HCUP The Healthcare Cost and Utilization Project (HCUP, pronounced "H-Cup") is a family of healthcare databases and related software tools and products developed through a Federal-State-Industry partnership and sponsored by the Agency for Healthcare Research and Quality (AHRQ). HCUP databases bring together the data collection efforts of State data organizations, hospital associations, and private data organizations (HCUP Partners) and the Federal government to create a national information resource of encounter-level healthcare data. HCUP includes the largest collection of longitudinal hospital care data in the United States, with all-payer, encounter-level information beginning in 1988. These databases enable research on a broad range of health policy issues, including cost and quality of health services, medical practice patterns, access to healthcare programs, and outcomes of treatments at the national, State, and local market levels. HCUP would not be possible without the contributions of the following data collection Partners from across the United States: Alaska Department of Health and Social Services Alaska State Hospital and Nursing Home Association Arizona Department of Health Services Arkansas Department of Health California Office of Statewide Health Planning and Development Colorado Hospital Association Connecticut Hospital Association District of Columbia Hospital Association Florida Agency for Health Care Administration Georgia Hospital Association Hawaii Health Information Corporation Illinois Department of Public Health Indiana Hospital Association Iowa Hospital Association Kansas Hospital Association Kentucky Cabinet for Health and Family Services Louisiana Department of Health Maine Health Data Organization Maryland Health Services Cost Review Commission Massachusetts Center for Health Information and Analysis Michigan Health & Hospital Association Minnesota Hospital Association Mississippi State Department of Health Missouri Hospital Industry Data Institute Montana Hospital Association Nebraska Hospital Association Nevada Department of Health and Human Services New Hampshire Department of Health & Human Services New Jersey Department of Health New Mexico Department of Health New York State Department of Health North Carolina Department of Health and Human Services North Dakota (data provided by the Minnesota Hospital Association) Ohio Hospital Association Oklahoma State Department of Health Oregon Association of Hospitals and Health Systems Oregon Office of Health Analytics Pennsylvania Health Care Cost Containment Council Rhode Island Department of Health South Carolina Revenue and Fiscal Affairs Office South Dakota Association of Healthcare Organizations Tennessee Hospital Association Texas Department of State Health Services Utah Department of Health Vermont Association of Hospitals and Health Systems Virginia Health Information Washington State Department of Health West Virginia Health Care Authority Wisconsin Department of Health Services Wyoming Hospital Association About Statistical Briefs HCUP Statistical Briefs are descriptive summary reports presenting statistics on hospital inpatient, ambulatory surgery, and emergency department use and costs, quality of care, access to care, medical conditions, procedures, patient populations, and other topics. The reports use HCUP administrative healthcare data. About the NIS The HCUP National Inpatient Sample (NIS) is a national database of hospital inpatient stays. The NIS is nationally representative of all community hospitals (i.e., short-term, non-Federal, nonrehabilitation hospitals). The NIS includes all payers. It is drawn from a sampling frame that contains hospitals comprising more than 95 percent of all discharges in the United States. The vast size of the NIS allows the study of topics at the national and regional levels for specific subgroups of patients. In addition, NIS data are standardized across years to facilitate ease of use. Over time, the sampling frame for the NIS has changed; thus, the number of States contributing to the NIS varies from year to year. The NIS is intended for national estimates only; no State-level estimates can be produced. The 2012 NIS was redesigned to optimize national estimates. The redesign incorporates two critical changes:
The new sampling strategy is expected to result in more precise estimates than those that resulted from the previous NIS design by reducing sampling error: for many estimates, confidence intervals under the new design are about half the length of confidence intervals under the previous design. The change in sample design for 2012 necessitates recomputation of prior years NIS data to enable analysis of trends that uses the same definitions of discharges and hospitals. About the SASD The HCUP State Ambulatory Surgery and Services Databases (SASD) include encounter-level data for ambulatory surgeries and may also include various types of outpatient services such as observation stays, lithotripsy, radiation therapy, imaging, chemotherapy, and labor and delivery. The specific types of ambulatory surgery and outpatient services included in each SASD vary by State and data year. All SASD include data from hospital-owned ambulatory surgery facilities. In addition, some States include data from facilities not owned by a hospital. The designation of a facility as hospital-owned is specific to its financial relationship with a hospital that provides inpatient care and is not related to its physical location. Hospital-owned ambulatory surgery and other outpatient care facilities may be contained within the hospital, physically attached to the hospital, or located in a different geographic area. In order to provide information that is comparable across all States, analysis was restricted to hospital-owned ambulatory surgery. For More Information For other information on procedures and treatments, including procedures in the ambulatory surgery setting, refer to the HCUP Statistical Briefs located at www.hcup-us.ahrq.gov/reports/statbriefs/sb_procedures.jsp. For additional HCUP statistics, visit:
For more information about HCUP, visit www.hcup-us.ahrq.gov/. For a detailed description of HCUP and more information on the design of the National (Nationwide) Inpatient Sample (NIS) and State Ambulatory Surgery and Services Databases (SASD), please refer to the following database documentation: Agency for Healthcare Research and Quality. Overview of the National (Nationwide) Inpatient Sample (NIS). Healthcare Cost and Utilization Project (HCUP). Rockville, MD: Agency for Healthcare Research and Quality. Updated December 2016. www.hcup-us.ahrq.gov/nisoverview.jsp. Accessed January 31, 2017. Agency for Healthcare Research and Quality. Overview of the State Ambulatory Surgery and Services Databases (SASD). Healthcare Cost and Utilization Project (HCUP). Rockville, MD: Agency for Healthcare Research and Quality. Updated June 2016. www.hcup-us.ahrq.gov/sasdoverview.jsp. Accessed January 31, 2017. Suggested Citation Steiner CA (Institute for Health Research, Kaiser Permanente), Karaca Z (AHRQ), Moore BJ (IBM Watson Health), Imshaug MC (IBM Watson Health), Pickens G (IBM Watson Health). Surgeries in Hospital-Based Ambulatory Surgery and Hospital Inpatient Settings, 2014. HCUP Statistical Brief #223. May 2017. Agency for Healthcare Research and Quality, Rockville, MD. www.hcup-us.ahrq.gov/reports/statbriefs/sb223-Ambulatory-Inpatient-Surgeries-2014.pdf. Acknowledgments The authors would like to acknowledge the contributions of Clare Sun of IBM Watson Health. *** AHRQ welcomes questions and comments from readers of this publication who are interested in obtaining more information about access, cost, use, financing, and quality of healthcare in the United States. We also invite you to tell us how you are using this Statistical Brief and other HCUP data and tools, and to share suggestions on how HCUP products might be enhanced to further meet your needs. Please e-mail us at hcup@ahrq.gov or send a letter to the address below:Sharon B. Arnold, Ph.D., Acting Director Center for Delivery, Organization, and Markets Agency for Healthcare Research and Quality 5600 Fishers Lane Rockville, MD 20857 This Statistical Brief was posted online on May 11, 2017. The revised version of this Statistical Brief was posted online on February 5, 2018. A second revision of this Statistical Brief was posted online on July 20, 2020. 1 American Hospital Association. Utilization and Volume. In: Trends Affecting Hospitals and Health Systems. Updated for 2016; chapter 3. https://www.aha.org/system/files/research/reports/tw/chartbook/2016/chapter3.pdf. 2 Moore BJ, Steiner CA, Davis PH, Stocks C, Barrett ML. Trends in Hysterectomies and Oophorectomies in Hospital Inpatient and Ambulatory Settings, 2005-2013. HCUP Statistical Brief #214. November 2016. Agency for Healthcare Research and Quality, Rockville, MD. www.hcup-us.ahrq.gov/reports/statbriefs/sb214-Hysterectomy-Oophorectomy-Trends.pdf. Accessed December 5, 2016. 3 Steiner CA, Weiss AJ, Barrett ML, Fingar KR, Davis PH. Trends in Bilateral and Unilateral Mastectomies in Hospital Inpatient and Ambulatory Settings, 2005-2013. HCUP Statistical Brief #201. February 2016. Agency for Healthcare Research and Quality, Rockville, MD. www.hcup-us.ahrq.gov/reports/statbriefs/sb201-Mastectomies-Inpatient-Outpatient.pdf. Accessed December 5, 2016. 4 Wier LM, Steiner CA, Owens PL. Surgeries in Hospital-Owned Outpatient Facilities, 2012. HCUP Statistical Brief #188. February 2015. Agency for Healthcare Research and Quality, Rockville, MD. www.hcup-us.ahrq.gov/reports/statbriefs/sb188-Surgeries-Hospital-Outpatient-Facilities-2012.pdf. Accessed December 2, 2016. 5 Agency for Healthcare Research and Quality. HCUP Surgery Flag Software for ICD-9-CM. Healthcare Cost and Utilization Project (HCUP). Rockville, MD: Agency for Healthcare Research and Quality. Updated February 26, 2016. www.hcup-us.ahrq.gov/toolssoftware/surgflags/surgeryflags.jsp. Accessed October 10, 2016. 6 Agency for Healthcare Research and Quality. HCUP Surgery Flag Software for Services and Procedures. Healthcare Cost and Utilization Project (HCUP). Rockville, MD: Agency for Healthcare Research and Quality. Updated August 2019. www.hcup-us.ahrq.gov/toolssoftware/surgeryflags_svcproc/surgeryflagssvc_proc.jsp. Accessed June 23, 2020. 7 The narrow surgery definition includes surgical procedures that involve incision, excision, manipulation, or suturing of tissue that penetrates or breaks the skin; typically require use of an operating room; and also require regional anesthesia, general anesthesia, or sedation to control pain. The version of the HCUP Surgery Flag Software for Services and Procedures used for this Statistical Brief did not include cardiac CPT codes. 8 Barrett M, McCarty J, Coffey R, Levit K. Population Denominator Data for Use with the HCUP Databases (Updated with 2015 Population Data). HCUP Methods Series Report #2016-04. September 29, 2016. U.S. Agency for Healthcare Research and Quality. www.hcup-us.ahrq.gov/reports/methods/2016-04.pdf. Accessed January 31, 2017. 9 Agency for Healthcare Research and Quality. HCUP Clinical Classifications Software (CCS) for ICD-9-CM. Healthcare Cost and Utilization Project (HCUP). Rockville, MD: Agency for Healthcare Research and Quality. Updated October 2016. www.hcup-us.ahrq.gov/toolssoftware/ccs/ccs.jsp. January 31, 2017. 10 Agency for Healthcare Research and Quality. HCUP Clinical Classifications Software for Services and Procedures. Healthcare Cost and Utilization Project (HCUP). Rockville, MD: Agency for Healthcare Research and Quality. Updated May 2014. www.hcup-us.ahrq.gov/toolssoftware/ccs_svcsproc/ccssvcproc.jsp. Accessed October 31, 2016. 11 Agency for Healthcare Research and Quality. HCUP Surgery Flag Software for Services and Procedures. Healthcare Cost and Utilization Project (HCUP). Rockville, MD: Agency for Healthcare Research and Quality. Updated August 2019. www.hcup-us.ahrq.gov/toolssoftware/surgeryflags_svcproc/surgeryflagssvc_proc.jsp. Accessed June 23, 2020. 12 Agency for Healthcare Research and Quality. HCUP Surgery Flag Software for ICD-9-CM. Healthcare Cost and Utilization Project (HCUP). Rockville, MD: Agency for Healthcare Research and Quality. Updated February 26, 2016. www.hcup-us.ahrq.gov/toolssoftware/surgflags/surgeryflags.jsp. Accessed October 10, 2016. |
| Internet Citation: Statistical Brief #223. Healthcare Cost and Utilization Project (HCUP). July 2020. Agency for Healthcare Research and Quality, Rockville, MD. hcup-us.ahrq.gov/reports/statbriefs/sb223-Ambulatory-Inpatient-Surgeries-2014.jsp. |
| Are you having problems viewing or printing pages on this website? |
| If you have comments, suggestions, and/or questions, please contact hcup@ahrq.gov. |
| If you are experiencing issues related to Section 508 accessibility of information on this website, please contact hcup@ahrq.gov. |
| Privacy Notice, Viewers & Players |
| Last modified 7/20/20 |