STATISTICAL BRIEF #218 |
December 2016
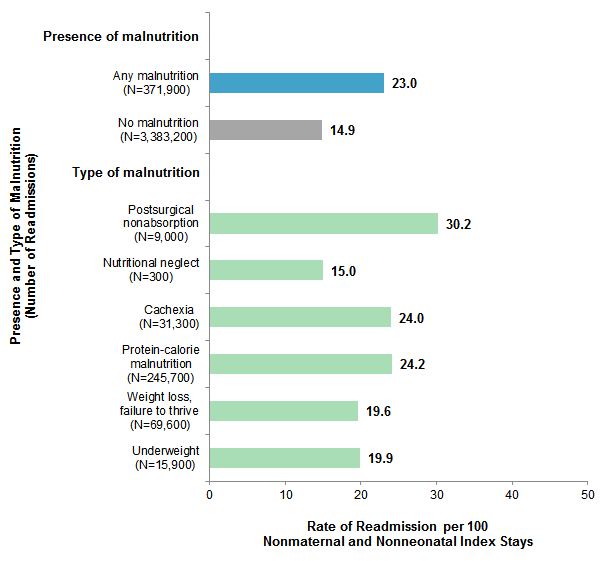
Kathryn R. Fingar, Ph.D., M.P.H., Audrey J. Weiss, Ph.D., Marguerite L. Barrett, M.S., Anne Elixhauser, Ph.D., Claudia A. Steiner, M.D., M.P.H., Peggi Guenter, Ph.D., R.N., and Mary Hise Brown, Ph.D. Introduction Recent estimates indicate that 7 percent of nonmaternal and nonneonatal hospital stays in the United States are for patients with malnutrition,1 defined here as undernutrition characterized by lack of adequate calories, protein, or other nutrients needed for tissue maintenance and repair.2 Malnutrition has been associated with longer and more costly hospitals stays, as well as a greater likelihood of comorbidity and death among hospitalized patients.3 Conceptually, malnutrition may also contribute to posthospital syndrome, described as "an acquired, transient period of vulnerability" following hospitalization,4 which may dramatically increase risk of readmission.5,6 There are many causes of malnutrition.7,8 Some cases involve chronic starvation related to conditions such as anorexia nervosa. In other instances, malnutrition may be a consequence of an acute or chronic illness or injury, such as burns or cancer. This heterogeneity has complicated recognition and proper treatment of malnutrition in hospital-based settings, as well as efforts to develop a standard definition of malnutrition for clinical and surveillance purposes.9,10 Inpatient outcomes—including length of hospital stay, costs, and mortality—appear to vary by malnutrition type. In the United States in 2013, the in-hospital death rate was 12 percent for stays involving cachexia (i.e., wasting syndrome) and 8 percent for those involving protein-calorie malnutrition, compared with 2-5 percent for stays with other types of malnutrition, including postsurgical nonabsorption, nutritional neglect, weight loss or failure to thrive, and underweight diagnoses.11 Compared with other types of malnutrition, hospital stays involving protein-calorie malnutrition had the longest average length of stay and the highest average cost per stay.12 The frequency of readmissions following hospital stays involving malnutrition is largely unknown at a national level. Patients with malnutrition have been found to have a higher likelihood of readmission, but many studies have been conducted in other countries13,14,15 or were limited to older adults,16,17 individual hospitals,18,19 or certain clinical populations.20 More research on the epidemiology of readmissions following hospital stays for patients with malnutrition is warranted. This Healthcare Cost and Utilization Project (HCUP) Statistical Brief supplements a recent HCUP Statistical Brief that describes inpatient hospital stays among patients with six types of malnutrition: postsurgical nonabsorption, nutritional neglect, cachexia, protein-calorie malnutrition, weight loss or failure to thrive, and underweight.21 The current Statistical Brief presents additional information on the all-cause 30-day rate of readmissions following an initial inpatient hospital stay for patients with malnutrition in the United States in 2013, following the same typology of malnutrition presented in the earlier Statistical Brief. Malnutrition was identified at the initial inpatient stay, or index stay, as either a principal or secondary diagnosis. Analysis was limited to patients with a nonmaternal and nonneonatal index stay. A patient can have multiple index stays during the course of a year. Readmissions could be for any cause; thus, malnutrition may or may not have been recorded at the time of readmission. Thirty-day readmission rates are presented for the six types of malnutrition and across patient characteristics. For comparison, the readmission rate for nonmaternal and nonneonatal index stays among patients without malnutrition also is presented. Finally, costs and reasons for readmissions are presented by presence and type of malnutrition. All differences between estimates noted in the text are greater than 10 percent. Findings Readmission rate by malnutrition type, 2013 Figure 1 displays the all-cause 30-day rate of readmission among patients with malnutrition following an index stay in 2013, according to type of malnutrition. For comparison, the readmission rate among patients without malnutrition at the index stay also is shown. |
|
|
Figure 1. All-cause 30-day readmission rate by presence and type of malnutrition, 2013
Source: Agency for Healthcare Research and Quality (AHRQ), Center for Delivery, Organization, and Markets, Healthcare Cost and Utilization Project (HCUP), Nationwide Readmissions Database (NRD), 2013 Bar chart that shows rate of 30-day readmission per 100 nonmaternal and nonneonatal index stays by presence and type of malnutrition. Presence of malnutrition: any malnutrition (N=371,900): 23.0; no malnutrition (N=3,383,200): 14.9. Type of malnutrition: postsurgical nonabsorption (N=9,000): 30.2; nutritional neglect (N=300): 15.0; cachexia (N=31,300): 24.0; protein-calorie malnutrition (N=245,700): 24.2; weight loss, failure to thrive (N=69,600): 19.6; underweight (N=15,900): 19.9.
|
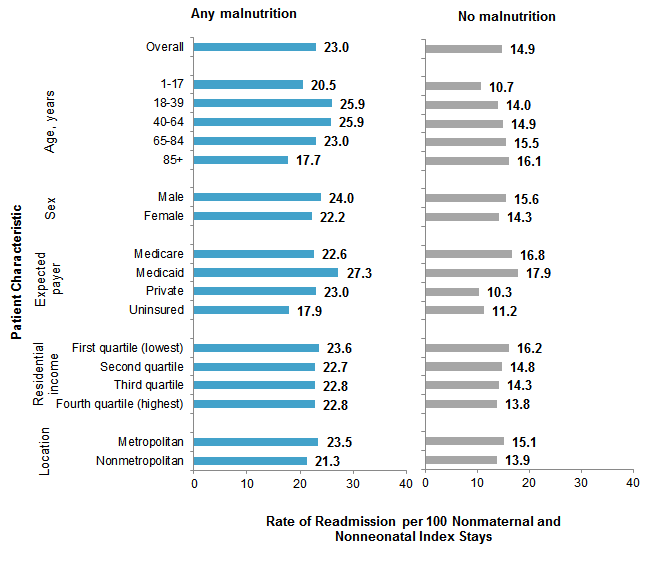
Readmission rate by patient characteristics, 2013 Figure 2 displays the all-cause 30-day rate of readmission among patients with any type of malnutrition during an index stay in 2013, overall and by patient characteristics. The readmission rate among patients without malnutrition at the index stay also is shown for comparison. |
|
Figure 2. All-cause 30-day readmission rate among patients with any type of malnutrition during an index stay versus those without malnutrition, by patient characteristics, 2013
Source: Agency for Healthcare Research and Quality (AHRQ), Center for Delivery, Organization, and Markets, Healthcare Cost and Utilization Project (HCUP), Nationwide Readmissions Database (NRD), 2013 Bar chart that shows the rate of all-cause 30-day readmission per 100 nonmaternal and nonneonatal index stays with and without malnutrition by patient characteristic. Any malnutrition: overall: 23.0; by age, years: 1-17, 20.5; 18-39, 25.9; 40-64, 25.9; 65-84, 23.0; 85+, 17.7; by sex: male, 24.0; female, 22.2; by expected payer: Medicare, 22.6, Medicaid, 27.3; private, 23.0; uninsured, 17.9; by residential income: first quartile (lowest), 23.6; second quartile, 22.7; third quartile, 22.8; fourth quartile (highest), 22.8; by location: metropolitan, 23.5; nonmetropolitan, 21.3. No malnutrition: overall: 14.9; by age, years: 1-17, 10.7; 18-39, 14.0; 40-64, 14.9; 65-84, 15.5; 85+, 16.1; by sex: male, 15.6; female, 14.3; by expected payer: Medicare, 16.8, Medicaid, 17.9; private, 10.3; uninsured, 11.2; by residential income: first quartile (lowest), 16.2; second quartile, 14.8; third quartile, 14.3; fourth quartile (highest), 13.8; by location: metropolitan, 15.1; nonmetropolitan, 13.9.
|
Patterns in the rate of readmission across patient characteristics generally were similar for the different types of malnutrition, with several exceptions, which are discussed in Table 1. Table 1 presents the readmission rate in 2013, according to presence and type of malnutrition and patient characteristics. |
| Table 1. All-cause 30-day readmission rate by presence and type of malnutrition, and patient characteristics, 2013 | ||||||||
| Patient characteristic | Any malnutrition | No malnutrition | Type of malnutrition | |||||
|---|---|---|---|---|---|---|---|---|
| Postsurgical non-absorption | Nutritional neglect | Cachexia | Protein-calorie malnutrition | Weight loss, failure to thrive | Under-weight | |||
| Total readmitted, N | 371,900 | 3,383,200 | 9,000 | 300 | 31,300 | 245,700 | 69,600 | 15,900 |
| Total, rate | 23.0 | 14.9 | 30.2 | 15.0 | 24.0 | 24.2 | 19.6 | 19.9 |
| Age group, years, rate | ||||||||
| 1-17 | 20.5 | 10.7 | 29.8 | 7.6 | 27.3 | 25.7 | 17.7 | 20.0 |
| 18-39 | 25.9 | 14.0 | 36.7 | a | 33.5 | 27.2 | 19.7 | 21.2 |
| 40-64 | 25.9 | 14.9 | 30.7 | 20.0 | 27.0 | 26.7 | 22.2 | 22.9 |
| 65-84 | 23.0 | 15.5 | 27.8 | 20.8 | 23.2 | 23.8 | 20.9 | 19.7 |
| 85+ | 17.7 | 16.1 | 20.5 | 14.6 | 17.4 | 19.0 | 15.5 | 15.6 |
| Sex, rate | ||||||||
| Male | 24.0 | 15.6 | 31.6 | 17.6 | 25.1 | 24.9 | 20.9 | 22.2 |
| Female | 22.2 | 14.3 | 29.3 | 12.9 | 22.7 | 23.5 | 18.5 | 18.6 |
| Expected payer, rate | ||||||||
| Medicare | 22.6 | 16.8 | 30.3 | 20.2 | 23.0 | 23.7 | 19.6 | 19.5 |
| Medicaid | 27.3 | 17.9 | 33.9 | 8.4 | 30.4 | 29.2 | 21.7 | 25.2 |
| Private insurance | 23.0 | 10.3 | 27.2 | a | 23.9 | 24.4 | 19.5 | 17.9 |
| Uninsured | 17.9 | 11.2 | 21.5 | a | 19.0 | 19.1 | 15.1 | 15.3 |
| Community-level income, rate | ||||||||
| First quartile (poorest) | 23.6 | 16.2 | 30.2 | 18.0 | 25.2 | 24.6 | 20.2 | 21.3 |
| Second quartile | 22.7 | 14.8 | 30.9 | 13.3 | 23.7 | 23.9 | 19.0 | 19.8 |
| Third quartile | 22.8 | 14.3 | 29.6 | 10.9 | 23.0 | 23.9 | 19.7 | 19.3 |
| Fourth quartile (wealthiest) | 22.8 | 13.8 | 29.3 | 18.0 | 23.1 | 24.2 | 19.5 | 18.5 |
| Location of residence, rate | ||||||||
| Metropolitan | 23.5 | 15.1 | 30.0 | 14.9 | 24.4 | 24.7 | 19.9 | 20.2 |
| Nonmetropolitan | 21.3 | 13.9 | 30.9 | 15.2 | 22.0 | 22.1 | 18.3 | 18.6 |
| Note: Rate is per 100 nonmaternal and nonneonatal index stays. a Suppressed due to cell size <11 readmissions. Source: Agency for Healthcare Research and Quality (AHRQ), Center for Delivery, Organization, and Markets, Healthcare Cost and Utilization Project (HCUP), Nationwide Readmissions Database (NRD), 2013 | ||||||||
Cost of malnutrition-related index stays and readmissions, 2013 Table 2 presents the average cost of index stays involving malnutrition and subsequent readmissions for any cause within 30 days, according to malnutrition type. For comparison, costs also are presented for index stays without malnutrition. |
| Table 2. Average cost of nonmaternal and nonneonatal index stays and subsequent readmissions, by presence and type of malnutrition, 2013 | ||||
| Malnutrition type at index stay | Average cost of index admission, $ | Average cost of readmission, $ | Marginal difference in cost of readmission, $ | Change in cost of readmission, % |
|---|---|---|---|---|
| Presence of malnutrition | ||||
| Any malnutrition | 21,200 | 16,200 | -5,000 | -30.9 |
| No malnutrition | 12,200 | 13,400 | 1,300 | 10.7 |
| Type of malnutrition | ||||
| Postsurgical nonabsorption | 21,400 | 17,900 | -3,500 | -16.4 |
| Nutritional neglect | 15,800 | 16,300 | 500 | 3.2 |
| Cachexia | 16,600 | 15,100 | -1,500 | -8.8 |
| Protein-calorie malnutrition | 25,500 | 16,900 | -8,700 | -33.9 |
| Weight loss, failure to thrive | 13,200 | 15,000 | 1,800 | 13.3 |
| Underweight | 12,400 | 13,700 | 1,200 | 9.8 |
| Source: Agency for Healthcare Research and Quality (AHRQ), Center for Delivery, Organization, and Markets, Healthcare Cost and Utilization Project (HCUP), Nationwide Readmissions Database (NRD), 2013 | ||||
Reasons for malnutrition-related readmissions, 2013 The most common reasons for readmission among patients with malnutrition during an index stay in 2013 are provided in Table 3 (general reasons) and Table 4 (specific reasons), according to the type of malnutrition. Table 3 focuses on primary condition groupings, which are based on broad body systems or etiology, as defined by the International Classification of Diseases, Ninth Revision, Clinical Modification (ICD-9-CM). Table 4 focuses on principal diagnoses, which are more specific categories of conditions. The most common reasons for readmission among patients without malnutrition at the index stay also are presented for comparison. |
| Table 3. Top five primary condition groupings at the readmission, by presence and type of malnutrition at the index stay, 2013 | ||||||||||||||||
| Primary condition groupinga at readmission | Any malnutrition | No malnutrition | Type of malnutrition | |||||||||||||
|---|---|---|---|---|---|---|---|---|---|---|---|---|---|---|---|---|
| Postsurgical non-absorption | Nutritional neglect | Cachexia | Protein-calorie malnutrition | Weight loss, failure to thrive | Under-weight | |||||||||||
| Rank | % | Rank | % | Rank | % | Rank | % | Rank | % | Rank | % | Rank | % | Rank | % | |
| Total readmitted, N | 371,900 | 3,383,200 | 9,000 | 300 | 31,300 | 245,700 | 69,600 | 15,900 | ||||||||
| Digestive system | 1 | 14.4 | 2 | 11.6 | - | - | 2 | 18.9 | 4 | 12.1 | 2 | 14.8 | 1 | 13.6 | 2 | 13.6 |
| Infectious and parasitic | 2 | 14.3 | - | - | 2 | 18.8 | 4 | 8.8 | 2 | 15.7 | 1 | 15.8 | 5 | 10.2 | 5 | 9.2 |
| Respiratory system | 3 | 13.1 | 3 | 11.2 | 3 | 11.8 | - | - | 1 | 18.0 | 3 | 12.8 | 4 | 12.3 | 1 | 17.3 |
| Circulatory system | 4 | 12.5 | 1 | 19.2 | 1 | 19.2 | - | - | 3 | 12.2 | 4 | 12.6 | 2 | 13.4 | 3 | 12.5 |
| Injury and poisoning | 5 | 10.5 | 4 | 11.2 | 5 | 9.1 | 1 | 27.5 | - | - | 5 | 11.0 | - | - | 4 | 9.4 |
| Mental illness | - | - | 5 | 9.4 | 4 | 10.2 | - | - | - | - | - | - | - | - | - | - |
| Genito-urinary system | - | - | - | - | - | - | 3 | 9.6 | - | - | - | - | - | - | - | - |
| Endocrine, nutritional, metabolic | - | - | - | - | - | - | 5 | 8.7 | - | - | - | - | - | - | - | - |
| Neoplasms | - | - | - | - | - | - | - | - | 5 | 10.3 | - | - | 3 | 12.8 | - | - |
| Notes: A dash indicates that the condition did not rank among the top five primary condition groupings for that type of malnutrition. Denominators for all percentage calculations are the total number of hospital stays for each malnutrition type. a Primary condition grouping was identified based on the diagnosis chapter of the International Classification of Diseases, Ninth Revision, Clinical Modification (ICD-9-CM). Source: Agency for Healthcare Research and Quality (AHRQ), Center for Delivery, Organization, and Markets, Healthcare Cost and Utilization Project (HCUP), Nationwide Readmissions Database (NRD), 2013 | ||||||||||||||||
Table 4 lists the five most common principal diagnoses at readmission among patients with malnutrition during the index stay, by malnutrition type in 2013. These are more specific categories of conditions than the body system/etiology groupings in Table 3. The most common principal diagnoses at readmission among patients without malnutrition at the index stay also are presented for comparison. |
| Table 4. Top five principal diagnoses at readmission, by presence and type of malnutrition at the index stay, 2013 | ||||||||||||||||
| Principal diagnosis CCS at readmission | Any malnutrition | No malnutrition | Type of malnutrition | |||||||||||||
|---|---|---|---|---|---|---|---|---|---|---|---|---|---|---|---|---|
| Postsurgical non-absorption | Nutritional neglect | Cachexia | Protein-calorie malnutrition | Weight loss, failure to thrive | Under-weight | |||||||||||
| Rank | % | Rank | % | Rank | % | Rank | % | Rank | % | Rank | % | Rank | % | Rank | % | |
| Total readmitted, N | 371,900 | 3,383,200 | 9,000 | 300 | 31,300 | 245,700 | 69,600 | 15,900 | ||||||||
| Septicemia (except in labor) | 1 | 12.5 | 1 | 5.8 | 3 | 7.8 | 1 | 14.3 | 1 | 11.9 | 1 | 14.1 | 1 | 8.8 | 1 | 7.9 |
| Complication surgery, medical care | 2 | 4.2 | 3 | 4.7 | 2 | 8.5 | - | - | - | - | 2 | 4.7 | - | - | 5 | 3.3 |
| Pneumonia | 3 | 14.1 | - | - | - | - | 2 | a | 2 | 5.1 | 4 | 4.0 | 2 | 4.3 | 2 | 5.3 |
| Complication device; implant, graft | 4 | 4.1 | 4 | 3.5 | 1 | 17.4 | - | - | - | - | 3 | 4.1 | - | - | - | - |
| CHF; non-hypertensive | 5 | 3.8 | 2 | 5.4 | - | - | 3 | a | 4 | 4.1 | 5 | 4.0 | 3 | 3.8 | 4 | 3.5 |
| Acute and unspecified renal failure | - | - | - | - | 4 | 7.3 | - | - | - | - | - | - | 4 | 3.2 | - | - |
| Fluid and electrolyte disorders | - | - | - | - | 5 | 6.5 | - | - | - | - | - | - | 5 | 3.0 | - | - |
| Acute cere-brovascular disease | - | - | - | - | - | - | 4 | a | - | - | - | - | - | - | - | - |
| Deficiency and other anemia | - | - | - | - | - | - | 5 | a | - | - | - | - | - | - | - | - |
| Resp. failure; insufficiency; arrest (adult) | - | - | - | - | - | - | - | - | 3 | 4.2 | - | - | - | - | - | - |
| COPD and bronchiectasis | - | - | - | - | - | - | - | - | 5 | 4.0 | - | - | - | - | - | - |
| Mood disorders | - | - | 5 | 3.4 | - | - | - | - | - | - | - | - | - | - | ||
| Abbreviations: CCS, Clinical Classifications Software; CHF, congestive heart failure; COPD, chronic obstructive pulmonary disease Notes: A dash indicates that the condition did not rank among the top five primary condition groupings for that type of malnutrition. Denominators for all percentage calculations are the total number of hospital stays for each malnutrition type. a Suppressed due to cell size <11 readmissions. Source: Agency for Healthcare Research and Quality (AHRQ), Center for Delivery, Organization, and Markets, Healthcare Cost and Utilization Project (HCUP), Nationwide Readmissions Database (NRD), 2013 | ||||||||||||||||
Data Source The estimates in this Statistical Brief are based upon data from the Healthcare Cost and Utilization Project (HCUP) 2013 Nationwide Readmissions Database (NRD). Definitions Diagnoses, ICD-9-CM, Clinical Classifications Software (CCS), and major diagnostic categories (MDCs) The principal diagnosis is that condition established after study to be chiefly responsible for the patient's admission to the hospital. ICD-9-CM is the International Classification of Diseases, Ninth Revision, Clinical Modification, which assigns numeric codes to diagnoses. There are approximately 14,000 ICD-9-CM diagnosis codes. CCS categorizes ICD-9-CM diagnosis codes into a manageable number of clinically meaningful categories.22 This clinical grouper makes it easier to quickly understand patterns of diagnoses. CCS categories identified as Other typically are not reported; these categories include miscellaneous, otherwise unclassifiable diagnoses that may be difficult to interpret as a group. MDCs assign ICD-9-CM principal diagnosis codes to one of 25 general diagnosis categories. Case definition The six types of malnutrition were defined at the index stay using the ICD-9-CM diagnosis codes listed in Table 5. Maternal and neonatal discharges, identified by MDC 14 (Pregnancy, Childbirth and the Puerperium) and MDC 15 (Newborns and Other Neonates With Conditions Originating in the Perinatal Period), were excluded from the analysis. Discharges identified only as a personal history or screening for malnutrition were not included (V12.1, personal history of nutritional deficiency; V77.2, special screening for malnutrition). |
| Table 5. ICD-9-CM diagnosis codes for malnutrition | |
| Code | Description |
|---|---|
| Postsurgical nonabsorption | |
| 579.3 | Other and unspecified postsurgical nonabsorption |
| Nutritional neglect | |
| 995.52 | Child neglect (nutritional) |
| 995.84 | Adult neglect (nutritional) |
| Cachexia | |
| 799.4 | Cachexia |
| Protein-calorie malnutrition | |
| 260 | Kwashiorkor |
| 261 | Nutritional marasmus |
| 262 | Other severe protein-calorie malnutrition |
| 263.0 | Malnutrition of moderate degree |
| 263.1 | Malnutrition of mild degree |
| 263.2 | Arrested development following protein-calorie malnutrition |
| 263.8 | Other protein-calorie malnutrition |
| 263.9 | Unspecified protein-calorie malnutrition |
| Weight loss, failure to thrive | |
| 783.21 | Loss of weight |
| 783.3 | Feeding difficulties and mismanagement |
| 783.41 | Failure to thrive [child] |
| 783.7 | Adult failure to thrive |
| Underweight | |
| 783.22 | Underweight |
| V85.0 | Body Mass Index less than 19, adult |
| V85.51 | Body Mass Index, pediatric, less than 5th percentile for age |
Each hospital stay involving malnutrition was categorized into only one malnutrition type based on the following hierarchy:
If a single inpatient record included multiple diagnosis codes indicating different types of malnutrition (e.g., nutritional neglect and weight loss), the record was classified into the higher ranked type of malnutrition (in this example, nutritional neglect). If both types of malnutrition at the same hierarchy level appeared on a discharge record (e.g., both postsurgical nonabsorption and nutritional neglect), then the record was classified into the malnutrition type that appeared first on the record. Readmissions The 30-day readmission rate is defined as the number of admissions for each condition for which there was at least one subsequent hospital admission within 30 days, divided by the total number of admissions from January through November of the same year. That is, when patients are discharged from the hospital, they are followed for 30 days in the data. If any readmission to the same or different hospital occurs during this time period, the admission is counted as having a readmission. No more than one readmission is counted within the 30-day period, because the outcome measure assessed is "percentage of admissions that are readmitted." If a patient was transferred to a different hospital on the same day or was transferred within the same hospital, the two events were combined as a single stay and the second event was not counted as a readmission; that is, transfers were not considered a readmission. In the case of admissions for which there was more than one readmission in the 30-day period, the data presented in this Statistical Brief reflect the characteristics and costs of the first readmission. Every qualifying hospital stay is counted as a separate initial (starting point) admission. Thus, a single patient can be counted multiple times during the course of the January through November observation period. In addition, initial admissions do not require a prior “clean period” with no hospitalizations; that is, a hospital stay may be a readmission for a prior stay and the initial admission for a subsequent readmission. Admissions were disqualified from the analysis as initial admissions if they could not be followed for 30 days for one of the following reasons: (1) the patient died in the hospital, (2) information on length of stay was missing, or (3) the patient was discharged in December. Types of hospitals included in the HCUP Nationwide Readmissions Database The Nationwide Readmissions Database (NRD) is based on data from community hospitals, which are defined as short-term, non-Federal, general, and other hospitals, excluding hospital units of other institutions (e.g., prisons). The NRD includes obstetrics and gynecology, otolaryngology, orthopedic, cancer, pediatric, public, and academic medical hospitals. Excluded are long-term care facilities such as rehabilitation, long-term acute care, psychiatric, and alcoholism and chemical dependency hospitals. However, if a patient received long-term care, rehabilitation, or treatment for a psychiatric or chemical dependency condition in a community hospital, the discharge record for that stay will be included in the NRD. Unit of analysis The unit of analysis is the hospital discharge (i.e., the hospital stay), not a person or patient. This means that a person who is admitted to the hospital multiple times in 1 year will be counted each time as a separate discharge from the hospital. Costs and charges Total hospital charges were converted to costs using HCUP Cost-to-Charge Ratios based on hospital accounting reports from the Centers for Medicare & Medicaid Services (CMS).23 Costs reflect the actual expenses incurred in the production of hospital services, such as wages, supplies, and utility costs; charges represent the amount a hospital billed for the case. For each hospital, a hospital-wide cost-to-charge ratio is used. Hospital charges reflect the amount the hospital billed for the entire hospital stay and do not include professional (physician) fees. For the purposes of this Statistical Brief, costs are reported to the nearest hundred. Location of patients' residence Place of residence is based on the urban-rural classification scheme for U.S. counties developed by the National Center for Health Statistics (NCHS). For this Statistical Brief, we collapsed the NCHS categories into either urban or rural according to the following: Metropolitan:
Nonmetropolitan:
Median community-level income Median community-level income is the median household income of the patient's ZIP Code of residence. Income levels are separated into population-based quartiles with cut-offs determined using ZIP Code demographic data obtained from the Nielsen Company. The income quartile is missing for patients who are homeless or foreign. Payer For this Statistical Brief, a hierarchy was used to assign the payer category based on the primary and secondary expected payer: 24 Urban:
Categorization of readmission counts and costs by expected payer was based on the index stay. The concordance between the expected payer coded at the index stay and the expected payer coded at readmission varies by payer: 98 percent for Medicare, 95 percent for Medicaid, 93 percent for private, and 80 percent for uninsured (percentages based on the 2013 NRD). About HCUP The Healthcare Cost and Utilization Project (HCUP, pronounced "H-Cup") is a family of healthcare databases and related software tools and products developed through a Federal-State-Industry partnership and sponsored by the Agency for Healthcare Research and Quality (AHRQ). HCUP databases bring together the data collection efforts of State data organizations, hospital associations, and private data organizations (HCUP Partners) and the Federal government to create a national information resource of encounter-level healthcare data. HCUP includes the largest collection of longitudinal hospital care data in the United States, with all-payer, encounter-level information beginning in 1988. These databases enable research on a broad range of health policy issues, including cost and quality of health services, medical practice patterns, access to healthcare programs, and outcomes of treatments at the national, State, and local market levels. HCUP would not be possible without the contributions of the following data collection Partners from across the United States: Alaska State Hospital and Nursing Home Association Arizona Department of Health Services Arkansas Department of Health California Office of Statewide Health Planning and Development Colorado Hospital Association Connecticut Hospital Association District of Columbia Hospital Association Florida Agency for Health Care Administration Georgia Hospital Association Hawaii Health Information Corporation Illinois Department of Public Health Indiana Hospital Association Iowa Hospital Association Kansas Hospital Association Kentucky Cabinet for Health and Family Services Louisiana Department of Health and Hospitals Maine Health Data Organization Maryland Health Services Cost Review Commission Massachusetts Center for Health Information and Analysis Michigan Health & Hospital Association Minnesota Hospital Association Mississippi Department of Health Missouri Hospital Industry Data Institute Montana MHA - An Association of Montana Health Care Providers Nebraska Hospital Association Nevada Department of Health and Human Services New Hampshire Department of Health & Human Services New Jersey Department of Health New Mexico Department of Health New York State Department of Health North Carolina Department of Health and Human Services North Dakota (data provided by the Minnesota Hospital Association) Ohio Hospital Association Oklahoma State Department of Health Oregon Association of Hospitals and Health Systems Oregon Office of Health Analytics Pennsylvania Health Care Cost Containment Council Rhode Island Department of Health South Carolina Revenue and Fiscal Affairs Office South Dakota Association of Healthcare Organizations Tennessee Hospital Association Texas Department of State Health Services Utah Department of Health Vermont Association of Hospitals and Health Systems Virginia Health Information Washington State Department of Health West Virginia Health Care Authority Wisconsin Department of Health Services Wyoming Hospital Association About Statistical Briefs HCUP Statistical Briefs are descriptive summary reports presenting statistics on hospital inpatient, ambulatory surgery, and emergency department use and costs, quality of care, access to care, medical conditions, procedures, patient populations, and other topics. The reports use HCUP administrative healthcare data. About the NRD The HCUP Nationwide Readmissions Database (NRD) is a calendar-year, discharge-level database constructed from the HCUP State Inpatient Databases (SID) with verified patient linkage numbers that can be used to track a person across hospitals within a State. The 2013 NRD is available for purchase through the HCUP Central Distributor. The NRD is designed to support various types of analyses of national readmission rates. The database includes discharges for patients with and without repeat hospital visits in a year and those who have died in the hospital. Repeat stays may or may not be related. The criteria to determine the relationship between hospital admissions are left to the analyst using the NRD. The NRD was constructed as a sample of convenience consisting of 100 percent of the eligible discharges. Discharge weights for national estimates are developed using the target universe of community hospitals (excluding rehabilitation and long-term acute care hospitals) in the United States. Over time, the sampling frame for the NRD will change; thus, the number of States contributing to the NRD will vary from year to year. The NRD is intended for national estimates only; no regional, State-, or hospital-specific estimates can be produced. For More Information For other information on malnutrition-related hospital stays in the United States, refer to the HCUP Statistical Briefs located at http://www.hcup-us.ahrq.gov/reports/statbriefs/sb_diabetes.jsp. For additional HCUP statistics, visit:
For more information about HCUP, visit http://www.hcup-us.ahrq.gov/. For a detailed description of HCUP and more information on the design of the Nationwide Readmissions Database (NRD), please refer to the following database documentation: Agency for Healthcare Research and Quality. Overview of the Nationwide Readmissions Database (NRD). Healthcare Cost and Utilization Project (HCUP). Rockville, MD: Agency for Healthcare Research and Quality. Updated December 2015. http://www.hcup-us.ahrq.gov/nrdoverview.jsp. Accessed September 22, 2016. Suggested Citation Fingar KR (Truven Health Analytics), Weiss AJ (Truven Health Analytics), Barrett ML (M.L. Barrett, Inc.), Elixhauser A (AHRQ), Steiner CA (AHRQ), Guenter P (American Society for Parenteral and Enteral Nutrition), Brown MH (Baxter International, Inc.). All-Cause Readmissions Following Hospital Stays for Patients With Malnutrition, 2013. HCUP Statistical Brief #218. December 2016. Agency for Healthcare Research and Quality, Rockville, MD. http://www.hcup-us.ahrq.gov/reports/statbriefs/sb218-Malnutrition-Readmissions-2013.pdf. Acknowledgments The authors would like to acknowledge the contributions of Ainsley Malone of the American Society for Parenteral and Enteral Nutrition, Evangelia Davanos and Crystal Riley of Baxter Healthcare Corporation, and Minya Sheng of Truven Health Analytics. *** AHRQ welcomes questions and comments from readers of this publication who are interested in obtaining more information about access, cost, use, financing, and quality of healthcare in the United States. We also invite you to tell us how you are using this Statistical Brief and other HCUP data and tools, and to share suggestions on how HCUP products might be enhanced to further meet your needs. Please e-mail us at hcup@ahrq.gov or send a letter to the address below:David Knutson, Director Center for Delivery, Organization, and Markets Agency for Healthcare Research and Quality 5600 Fishers Lane Rockville, MD 20857 This Statistical Brief was posted online on December 13, 2016. 1 Weiss AJ, Fingar KR, Barrett ML, Elixhauser A, Steiner CA, Guenter P, et al. Characteristics of Hospital Stays Involving Malnutrition, 2013. HCUP Statistical Brief #210. September 2016. Agency for Healthcare Research and Quality, Rockville, MD. http://www.hcup-us.ahrq.gov/reports/statbriefs/sb210-Malnutrition-Hospital-Stays-2013.pdf. Accessed November 29, 2016. 2 White JV, Guenter P, Jensen G, Malone A, Schofield M, Academy Malnutrition Work Group, et al. Consensus statement: Academy of Nutrition and Dietetics and American Society for Parenteral and Enteral Nutrition: characteristics recommended for the identification and documentation of adult malnutrition (undernutrition). Journal of Parenteral and Enteral Nutrition. 2012:36(3):275-83. 3 Corkins MR, Guenter P, DiMaria-Ghalili RA, Jensen GL, Malone A, Miller S, et al. Malnutrition diagnoses in hospitalized patients: United States, 2010. Journal of Parenteral and Enteral Nutrition. 2014;38(2):186-95. 4 Krumholz HM. Post-hospital syndrome—an acquired, transient condition of generalized risk. New England Journal of Medicine. 2013;368(2):100-2. 5 Suaer A. Luo M. Role of Malnutrition in Increasing Risk of Hospital Readmissions. Abbot Nutrition Health Institute. December 2015. http://static.abbottnutrition.com/cms-prod/anhi.org/img/Role-Of-Malnutrition-In-Increasing-Risk-Of-Hospital-Readmissions-article.pdf. 6 Guenter P, Jensen G, Patel V, Miller S, Mogensen KM, Malone A, et al. Addressing disease-related malnutrition in hospitalized patients: a call for a national goal. Joint Commission Journal on Quality and Patient Safety. 2015;41(10):469-73. 7 Lean M, Wiseman M. Malnutrition in hospitals. BMJ. 2008;336(7639):290. 8 White et al., 2012. Op. cit. 9 Tappenden KA, Quatrara B, Parkhurst ML, Malone AM, Fanjiang G, Ziegler TR. Critical role of nutrition in improving quality of care: an interdisciplinary call to action to address adult hospital malnutrition. Journal of the Academy of Nutrition and Dietetics. 2013;113(9):1219-37. 10 White JV, Guenter P, Jensen G, Malone A, Schofield M, Academy Malnutrition Work Group, et al. Consensus statement: Academy of Nutrition and Dietetics and American Society for Parenteral and Enteral Nutrition: characteristics recommended for the identification and documentation of adult malnutrition (undernutrition). Journal of Parenteral and Enteral Nutrition. 2012:36(3):275-83. 11 Weiss AJ, Fingar KR, Barrett ML, Elixhauser A, Steiner CA, Guenter P, et al. Characteristics of Hospital Stays Involving Malnutrition, 2013. HCUP Statistical Brief #210. September 2016. Agency for Healthcare Research and Quality, Rockville, MD. http://www.hcup-us.ahrq.gov/reports/statbriefs/sb210-Malnutrition-Hospital-Stays-2013.pdf. Accessed November 29, 2016. 12 Ibid. 13 Mudge A, Kasper K, Clair A, et al. Recurrent readmissions in medical patients: a prospective study. Journal of Hospital Medicine. 2011;6:61-7. 14 Laniece I, Couturier P, Drame M, Gavazzi G, Lehman S, Jolly D, et al. Incidence and main factors associated with early unplanned hospital readmission among French medical inpatients aged 75 and over admitted through emergency units. Age and Ageing. 2008;37:416-22. 15 Lim SL, Ong KC, Chan YH, Loke WC, Ferguson M, Daniels L. Malnutrition and its impact on cost of hospitalization, length of stay, readmission and 3-year mortality. Clinical Nutrition. 2012;31(3):345-50. 16 Friedmann J, Jensen G, Smiciklas-Wright H, McCamish M. Predicting early nonelective hospital readmissions in nutritionally compromised older adults. American Journal of Clinical Nutrition. 1997;65:1714-20. 17 Sullivan D. Risk factors for early hospital readmission in a select population of geriatric rehabilitation patients: the significance of nutritional status. Journal of the American Geriatric Society. 1992;40:792-8. 18 Allaudeen N, Vidyarthi A, Maselli J, Auerbach A. Redefining readmission risk factors for general medicine patients. Journal of Hospital Medicine. 2011;6(2):54-60. 19 Thomas D, Zdrowski C, Wilson M, Conright KC, Lewis C, Tariq S, et al. Malnutrition in subacute care. American Journal of Clinical Nutrition. 2002;75:308-13. 20 Kassin MT, Owen RM, Perez SD, Leeds I, Cox JC, Schnier K, et al. Risk factors for 30-day hospital readmission among general surgery patients. Journal of the American College of Surgeons. 2012;215(3):322-30. 21 Weiss et al., 2016. Op. cit. 22 Agency for Healthcare Research and Quality. HCUP Clinical Classifications Software (CCS). Healthcare Cost and Utilization Project (HCUP). Rockville, MD: Agency for Healthcare Research and Quality. Updated June 2015. http://www.hcup-us.ahrq.gov/toolssoftware/ccs/ccs.jsp. Accessed February 17, 2016. 23 Agency for Healthcare Research and Quality. HCUP Cost-to-Charge Ratio (CCR) Files. Healthcare Cost and Utilization Project (HCUP). 2001-2013. Rockville, MD: Agency for Healthcare Research and Quality. Updated November 2015. http://www.hcup-us.ahrq.gov/db/state/costtocharge.jsp. Accessed February 17, 2016. 24 The 2013 NRD available for purchase through the HCUP Central Distributor includes the data element for the primary expected payer but not the data element for the secondary expected payer. |
| Internet Citation: Statistical Brief #218. Healthcare Cost and Utilization Project (HCUP). December 2016. Agency for Healthcare Research and Quality, Rockville, MD. hcup-us.ahrq.gov/reports/statbriefs/sb218-Malnutrition-Readmissions-2013.jsp. |
| Are you having problems viewing or printing pages on this website? |
| If you have comments, suggestions, and/or questions, please contact hcup@ahrq.gov. |
| If you are experiencing issues related to Section 508 accessibility of information on this website, please contact hcup@ahrq.gov. |
| Privacy Notice, Viewers & Players |
| Last modified 12/8/16 |