STATISTICAL BRIEF #210 |
September 2016
Audrey J. Weiss, Ph.D., Kathryn R. Fingar, Ph.D., M.P.H., Marguerite L. Barrett, M.S., Anne Elixhauser, Ph.D., Claudia A. Steiner, M.D., M.P.H., Peggi Guenter, Ph.D., R.N., and Mary Hise Brown, Ph.D. Introduction Undernutrition is a form of malnutrition characterized by a lack of adequate calories, protein, or other nutrients needed for tissue maintenance and repair.1 Malnutrition (undernutrition) occurs among approximately 3 percent of adult hospital inpatient stays in the United States and is associated with increased morbidity, mortality, and healthcare costs.2 Adult hospitalizations with a diagnosis of malnutrition have a longer length of stay, higher costs, more comorbidities, and 5 times the likelihood of death, compared with other adult hospital stays.3 Evidence suggests that early nutritional intervention may reduce complication rates, mortality, and resource use associated with malnutrition. However, many cases of malnutrition are unrecognized and untreated.4 Clinical definitions of malnutrition and the set of diagnostic codes used to identify malnutrition in hospital administrative data have varied.5 Standardizing definitions and treatment protocols for malnutrition is complicated by the fact that its etiology is heterogeneous. Malnutrition may result from chronic starvation and conditions such as anorexia, but it also may be a consequence of acute and chronic illness or injury.6,7 Using a consistent set of diagnostic criteria and understanding the diseases that are associated with malnutrition are important for recognizing and treating malnutrition, as well as tracking its incidence, prevalence, and outcomes.8 This Healthcare Cost and Utilization Project (HCUP) Statistical Brief presents national estimates on the characteristics of malnutrition reported during nonmaternal and nonneonatal hospital inpatient stays in 2013. Although malnutrition can include high caloric intake associated with overweight and obesity when defined broadly as nutritional imbalance, this Statistical Brief examines undernutrition only. Malnutrition was identified using a broad set of diagnostic codes that included the following six categories:
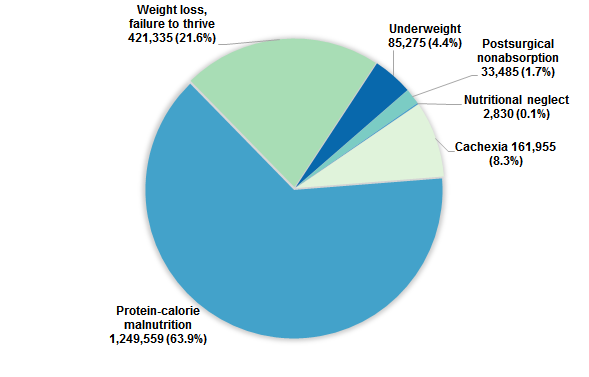
Findings Hospital stays involving malnutrition, 2013 Figure 1 provides the distribution of six types of malnutrition among hospital inpatient stays in 2013. |
|
|
Figure 1. Types of malnutrition among hospital stays with malnutrition, 2013
*Source: Agency for Healthcare Research and Quality (AHRQ), Center for Delivery, Organization, and Markets, Healthcare Cost and Utilization Project (HCUP), National Inpatient Sample (NIS), 2013 Pie chart showing the number and percentage of six types of hospital stays with malnutrition. Protein-calorie malnutrition: 1,249,559 stays, 63.9%; weight loss, failure to thrive: 421,335 stays, 21.6%; cachexia: 161,955 stays, 8.3%; underweight: 85,275 stays, 4.4%; postsurgical nonabsorption: 33,485 stays, 1.7%; nutritional neglect: 2,830 stays, 0.1%.
|
Characteristics and outcomes of hospital stays involving malnutrition, 2013 Table 1 provides characteristics of malnutrition-related hospital stays by type of malnutrition in 2013. |
| Table 1. Characteristics of hospital stays with malnutrition by malnutrition type, 2013 | ||||||
| Characteristic | Postsurgical nonabsorption | Nutritional neglect | Cachexia | Protein-calorie malnutrition | Weight loss, failure to thrive | Under-weight |
|---|---|---|---|---|---|---|
| Total number | 33,485 | 2,830 | 161,955 | 1,249,559 | 421,335 | 85,275 |
| Rate per 100,000 population | 10.6 | 0.9 | 51.2 | 395.3 | 133.3 | 27.0 |
| Age, mean years | 47.1 | 47.5 | 68.3 | 66.9 | 59.7 | 65.0 |
| Age, years, rate per 100,000 population | ||||||
| <18 | 8.8 | 1.4 | 1.3 | 21.1 | 88.2 | 3.8 |
| 18-39 | 3.8 | 0.1 | 8.6 | 88.4 | 25.0 | 10.3 |
| 40-64 | 13.1 | 0.4 | 51.6 | 378.9 | 87.9 | 21.8 |
| 65-84 | 22.7 | 2.4 | 181.1 | 1,439.3 | 415.0 | 84.8 |
| 85+ | 17.8 | 6.6 | 524.0 | 3,612.8 | 1,412.7 | 308.1 |
| Sex, rate per 100,000 population | ||||||
| Male | 7.8 | 0.8 | 53.4 | 383.2 | 131.3 | 19.7 |
| Female | 13.3 | 1.0 | 49.5 | 410.0 | 136.2 | 34.2 |
| Race/ethnicity, rate per 100,000 population | ||||||
| White | 10.9 | 0.7 | 51.7 | 419.9 | 135.7 | 29.1 |
| Black | 11.3 | 1.7 | 73.7 | 450.8 | 157.0 | 31.5 |
| Hispanic | 5.5 | 0.5 | 21.8 | 174.7 | 69.5 | 9.2 |
| Other | 6.8 | 0.6 | 47.8 | 331.0 | 118.6 | 24.1 |
| Community-level income, rate per 100,000 population | ||||||
| Quartile 1 (lowest) | 11.2 | 1.5 | 65.5 | 493.7 | 162.6 | 34.6 |
| Quartile 2 | 11.5 | 1.0 | 50.8 | 423.4 | 138.0 | 28.0 |
| Quartile 3 | 10.6 | 0.6 | 43.4 | 350.9 | 117.0 | 22.7 |
| Quartile 4 | 8.3 | 0.4 | 40.3 | 285.3 | 106.7 | 20.9 |
| Location of residence, rate per 100,000 population | ||||||
| Large central metropolitan | 9.9 | 0.9 | 56.5 | 389.2 | 128.7 | 26.4 |
| Large fringe metropolitan (suburbs) | 10.5 | 0.7 | 48.0 | 348.7 | 133.0 | 25.7 |
| Medium/small metropolitan | 10.8 | 0.9 | 46.7 | 397.5 | 128.4 | 26.1 |
| Micropolitan/noncore (rural) | 11.8 | 1.0 | 52.4 | 469.9 | 149.6 | 31.3 |
| Source: Agency for Healthcare Research and Quality (AHRQ), Center for Delivery, Organization, and Markets, Healthcare Cost and Utilization Project (HCUP), National Inpatient Sample (NIS), 2013 | ||||||
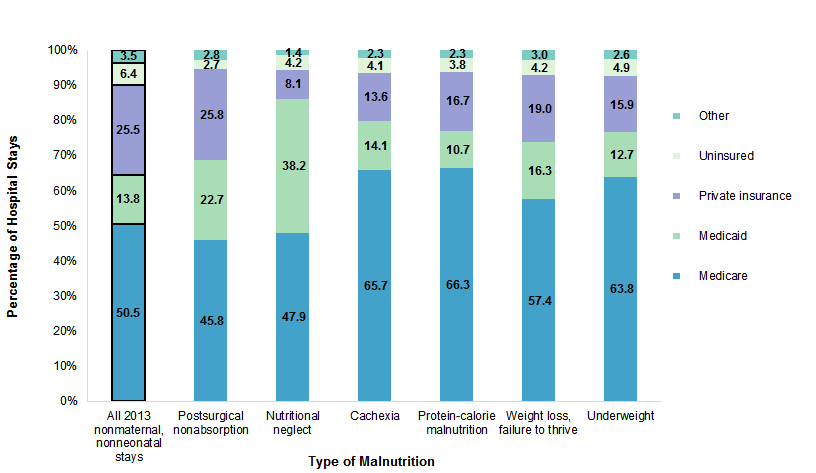
Figure 2 provides the expected payer distribution of malnutrition-related hospital stays by type of malnutrition in 2013. For reference, the distribution of all 2013 nonmaternal, nonneonatal stays also is provided. |
|
Figure 2. Distribution of expected payer across hospital stays with malnutrition by malnutrition type, 2013
Source: Agency for Healthcare Research and Quality (AHRQ), Center for Delivery, Organization, and Markets, Healthcare Cost and Utilization Project (HCUP), National Inpatient Sample (NIS), 2013 Stacked bar chart showing percentage of hospital stays by expected payer and malnutrition type. All 2013 nonmaternal, nonneonatal stays: Medicare, 50.5%; Medicaid, 13.8%; private insurance, 25.5%; uninsured, 6.4%; other, 3.5%. Postsurgical nonabsorption: Medicare, 45.8%; Medicaid, 22.7%; private insurance, 25.8%; uninsured, 2.7%; other, 2.8%. Nutritional neglect: Medicare, 47.9%; Medicaid, 38.2%; private insurance, 8.1%; uninsured, 4.2%; other, 1.4%. Cachexia: Medicare, 65.7%; Medicaid, 14.1%; private insurance, 13.6%; uninsured, 4.1%; other, 2.3%. Protein-calorie malnutrition: Medicare, 66.3%; Medicaid, 10.7%; private insurance, 16.7%; uninsured, 3.8%; other, 2.3%. Weight loss, failure to thrive: Medicare, 57.4%; Medicaid, 16.3%; private insurance, 19.0%; uninsured, 4.2%; other, 3.0%. Underweight: Medicare, 63.8%; Medicaid, 12.7%; private insurance, 15.9%; uninsured, 4.9%; other, 2.6%.
|
Table 2 provides admission and discharge characteristics and outcomes for malnutrition-related hospital stays by malnutrition type, in 2013. |
| Table 2. Admission and discharge characteristics and outcomes for hospital stays involving malnutrition by malnutrition type, 2013 | ||||||
| Characteristic or outcome | Postsurgical nonabsorption | Nutritional neglect | Cachexia | Protein-calorie malnutrition | Weight loss, failure to thrive | Under-weight |
|---|---|---|---|---|---|---|
| Total number | 33,485 | 2,830 | 161,955 | 1,249,559 | 421,335 | 85,275 |
| Admission, % | ||||||
| Malnutrition diagnosis present on admission | 84.1 | 88.0 | 88.6 | 80.2 | 88.5 | -a |
| Malnutrition listed as secondary diagnosis only | 93.8 | 82.5 | 99.9 | 99.4 | 96.8 | 100.0 |
| Elective admission | 15.2 | 5.8 | 7.5 | 11.7 | 13.1 | 12.4 |
| Received emergency department services | 60.9 | 70.0 | 76.6 | 68.8 | 65.9 | 71.4 |
| Discharge status, % | ||||||
| Routine discharge | 53.1 | 39.9 | 31.2 | 29.0 | 47.5 | 48.5 |
| Transfer to another acute care hospital | 2.8 | 3.7 | 2.6 | 3.1 | 2.6 | 1.9 |
| Transfer to another facilityb | 13.8 | 41.0 | 31.2 | 38.5 | 27.8 | 26.2 |
| Home healthcare | 27.2 | 10.4 | 21.8 | 20.2 | 16.7 | 18.3 |
| Against medical advice | 0.7 | 0.9 | 1.3 | 0.7 | 0.7 | 1.3 |
| Died during hospital stay | 2.3 | 3.9 | 11.7 | 8.4 | 4.5 | 3.7 |
| Outcome | ||||||
| Length of stay, mean days | 9.6 | 9.2 | 7.5 | 10.7 | 6.5 | 6.0 |
| Hospital costs, mean $ | 23,000 | 14,700 | 16,200 | 25,200 | 14,100 | 12,100 |
| Aggregate hospital costs, mean $ millions | 770 | 42 | 2,627 | 31,465 | 5,945 | 1,034 |
| Receipt of enteral/parenteral nutrition, % | ||||||
| Received enteral nutrition | 5.1 | 3.2 | 3.1 | 4.7 | 3.8 | 1.8 |
| Received parenteral nutrition | 28.7 | 1.6 | 2.4 | 6.6 | 2.0 | 1.2 |
| a Because two frequent codes in the underweight malnutrition type (V85.0 and V85.51) are exempt from present-on-admission reporting, this information is not reported. b Includes transfer to a skilled nursing facility, intermediate care facility, or another type of healthcare facility. Source: Agency for Healthcare Research and Quality (AHRQ), Center for Delivery, Organization, and Markets, Healthcare Cost and Utilization Project (HCUP), National Inpatient Sample (NIS), 2013 | ||||||
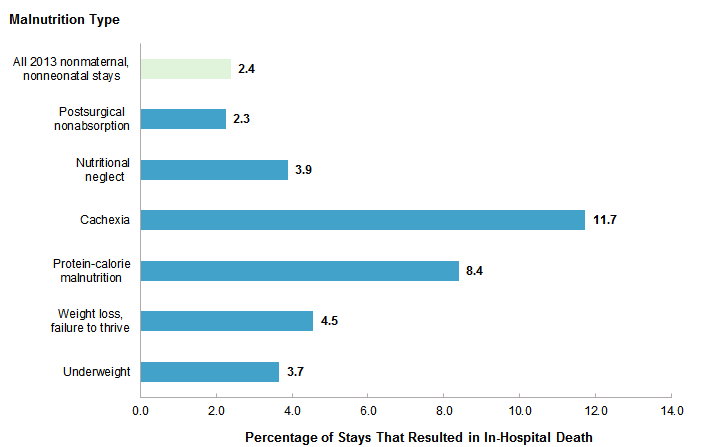
Figure 3 presents information on in-hospital deaths by type of malnutrition in 2013. For reference, the proportion of in-hospital deaths among all nonmaternal, nonneonatal hospital stays also is provided. |
|
Figure 3. Percentage of stays that resulted in in-hospital death by malnutrition type, 2013
Source: Agency for Healthcare Research and Quality (AHRQ), Center for Delivery, Organization, and Markets, Healthcare Cost and Utilization Project (HCUP), National Inpatient Sample (NIS), 2013 Bar chart showing percentage of malnutrition stays resulting in death. All 2013 nonmaternal, nonneonatal stays: 2.4%; postsurgical nonabsorption: 2.3; nutritional neglect: 3.9; cachexia: 11.7; protein-calorie malnutrition: 8.4; weight loss, failure to thrive: 4.5; underweight: 3.7.
|
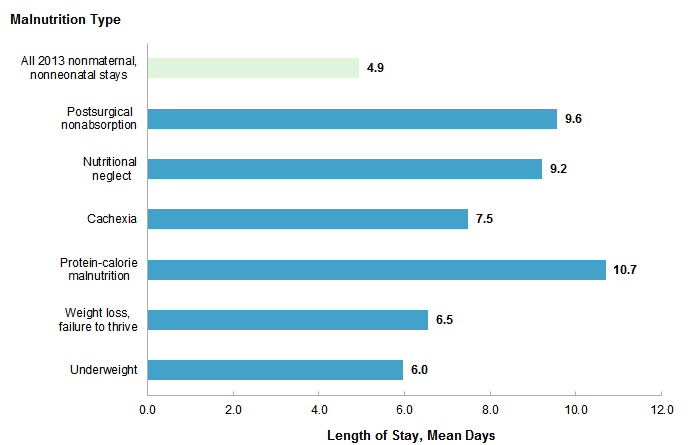
Figure 4 presents the average length of stay in the hospital by type of malnutrition in 2013. For reference, the average length of stay among all nonmaternal, nonneonatal hospital stays also is provided. |
|
Figure 4. Average length of hospital stay by malnutrition type, 2013
Source: Agency for Healthcare Research and Quality (AHRQ), Center for Delivery, Organization, and Markets, Healthcare Cost and Utilization Project (HCUP), National Inpatient Sample (NIS), 2013 Bar chart showing average length of hospital stay in days by malnutrition type. All 2013 nonmaternal, nonneonatal stays: 4.9; postsurgical nonabsorption: 9.6; nutritional neglect: 9.2; cachexia: 7.5; protein-calorie malnutrition: 10.7; weight loss, failure to thrive: 6.5; underweight: 6.0. |
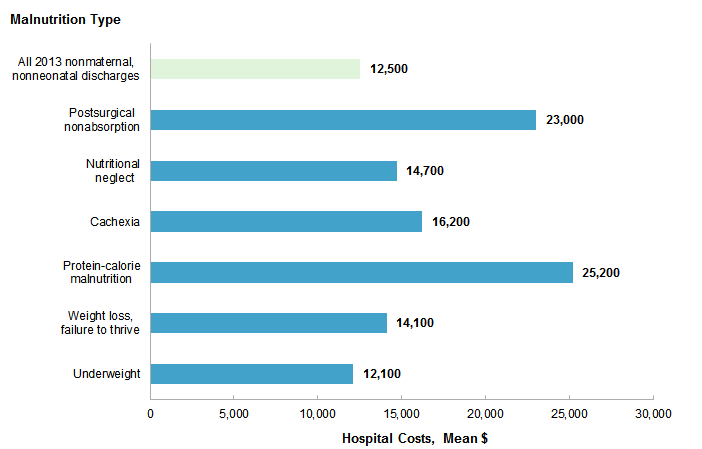
Figure 5 presents average hospital costs for stays by type of malnutrition in 2013. For reference, the average hospital cost among all nonmaternal, nonneonatal hospital stays also is provided. |
|
Figure 5. Average hospital costs by malnutrition type, 2013
Source: Agency for Healthcare Research and Quality (AHRQ), Center for Delivery, Organization, and Markets, Healthcare Cost and Utilization Project (HCUP), National Inpatient Sample (NIS), 2013 Bar chart showing average hospital costs in dollars by malnutrition type. All 2013 nonmaternal, nonneonatal stays: 12,500; postsurgical nonabsorption: 23,000; nutritional neglect: 14,700; cachexia: 16,200; protein-calorie malnutrition: 25,200; weight loss, failure to thrive: 14,100; underweight: 12,100. |
Reasons for hospital stays with malnutrition, 2013 The most common reasons for hospital stays involving malnutrition by malnutrition type in 2013 are provided in Table 3 (general reasons) and Table 4 (specific reasons). Table 3 focuses on primary condition groupings, which are based on broad body systems or etiology. Table 4 focuses on principal diagnoses, which are more specific categories of conditions. |
| Table 3. Top five primary condition groupings among hospital stays involving malnutrition by malnutrition type, 2013 | ||||||||||||
| Primary condition groupinga | Postsurgical nonabsorption | Nutritional neglect | Cachexia | Protein-calorie malnutrition | Weight loss, failure to thrive | Under-weight | ||||||
|---|---|---|---|---|---|---|---|---|---|---|---|---|
| Rank | % | Rank | % | Rank | % | Rank | % | Rank | % | Rank | % | |
| Injury and poisoningb | 1 | 27.5 | 1 | 27.4 | - | - | 5 | 9.9 | - | - | 4 | 9.3 |
| Digestive system | 2 | 20.5 | - | - | 5 | 10.0 | 2 | 14.6 | 1 | 14.0 | 3 | 13.6 |
| Genitourinary system | 3 | 8.8 | 5 | 8.3 | - | - | - | - | - | - | - | - |
| Endocrine/nutritional/metabolic | 4 | 7.6 | 2 | 13.3 | - | - | - | - | 3 | 11.6 | - | - |
| Infectious and parasitic | 5 | 7.5 | 3 | 10.4 | 2 | 14.6 | 1 | 17.1 | - | - | - | - |
| Mental illness | - | - | 4 | 10.2 | - | - | - | - | - | - | - | - |
| Respiratory system | - | - | - | - | 1 | 20.5 | 3 | 12.7 | 2 | 13.5 | 1 | 17.3 |
| Circulatory system | - | - | - | - | 3 | 12.5 | 4 | 11.7 | 4 | 11.2 | 2 | 7.5 |
| Neoplasms | - | - | - | - | 4 | 12.0 | 5 | 9.8 | 5 | 7.5 | ||
| Notes: A dash indicates that the condition did not rank among the top five primary condition groupings for that type of malnutrition. Denominators for all percentage calculations are the total number of hospital stays for each malnutrition type. a Primary condition grouping was identified based on the diagnosis chapter of the International Classification of Diseases, Ninth Revision, Clinical Modification (ICD-9-CM). b Includes complications of surgical procedures or medical care, and complication of device, implant or graft. Source: Agency for Healthcare Research and Quality (AHRQ), Center for Delivery, Organization, and Markets, Healthcare Cost and Utilization Project (HCUP), National Inpatient Sample (NIS), 2013 | ||||||||||||
Table 4 lists the five most common principal diagnoses for malnutrition-related hospital stays by malnutrition type in 2013. These are more specific categories of conditions than the body system/etiology groupings in Table 3. |
| Table 4. Top five principal diagnoses among hospital stays involving malnutrition by malnutrition type, 2013 | ||||||||||||
| Principal Diagnosis CCS | Postsurgical nonabsorption | Nutritional neglect | Cachexia | Protein-calorie malnutrition | Weight loss, failure to thrive | Under-weight | ||||||
|---|---|---|---|---|---|---|---|---|---|---|---|---|
| Rank | % | Rank | % | Rank | % | Rank | % | Rank | % | Rank | % | |
| Complication of device; implant or graft | 1 | 15.3 | - | - | - | - | 5 | 2.8 | - | - | - | - |
| Complications of surgical procedures or medical care | 2 | 10.6 | - | - | - | - | - | - | - | - | - | - |
| Septicemia (except in labor) | 3 | 6.4 | 2 | 9.5 | 1 | 11.5 | 1 | 15.7 | 1 | 5.4 | 2 | 5.6 |
| Acute and unspecified renal failure | 4 | 6.2 | 5 | 3.9 | - | - | 3 | 3.6 | 4 | 4.5 | 5 | 3.1 |
| Intestinal obstruction without hernia | 5 | 5.7 | - | - | - | - | - | - | - | - | - | - |
| Other injuries and conditions due to external causes | - | - | 1 | 19.1 | - | - | - | - | - | - | - | - |
| Other nutritional; endocrine; and metabolic disorders | - | - | 3 | 5.3 | - | - | - | - | 3 | 4.5 | - | - |
| Urinary tract infections | - | - | 4 | 4.4 | - | - | - | - | - | - | - | - |
| Pneumonia | - | - | - | - | 2 | 6.3 | 2 | 4.6 | 2 | 4.5 | 1 | 5.7 |
| Chronic obstructive pulmonary disease and bronchiectasis | - | - | - | - | 3 | 5.2 | - | - | - | - | 3 | 5.4 |
| Respiratory failure; insufficiency; arrest (adult) | - | - | - | - | 4 | 4.1 | - | - | - | - | - | - |
| Congestive heart failure; nonhypertensive | - | - | - | - | 5 | 3.6 | 4 | 2.8 | - | - | - | - |
| Fluid and electrolyte disorders | - | - | - | - | - | - | - | - | 5 | 4.2 | 4 | 3.2 |
| Abbreviation: CCS, Clinical Classifications Software Notes: A dash indicates that the condition did not rank among the top five principal Clinical Classifications Software (CCS) diagnoses for that type of malnutrition. Denominators for all percentage calculations are the total number of hospital stays for each malnutrition type. Source: Agency for Healthcare Research and Quality (AHRQ), Center for Delivery, Organization, and Markets, Healthcare Cost and Utilization Project (HCUP), National Inpatient Sample (NIS), 2013 | ||||||||||||
Data Source The estimates in this Statistical Brief are based upon data from the Healthcare Cost and Utilization Project (HCUP) 2013 National Inpatient Sample (NIS). Supplemental sources included population denominator data derived from demographic data provided by the Nielsen Company, a vendor that compiles and adds value to the U.S. Bureau of Census data. Nielsen uses intra-census methods to estimate household and demographic statistics by ZIP Code.10 Definitions Diagnoses, procedures, ICD-9-CM, Clinical Classifications Software (CCS) The principal diagnosis is that condition established after study to be chiefly responsible for the patient's admission to the hospital. Secondary diagnoses are concomitant conditions that coexist at the time of admission or develop during the stay. All-listed diagnoses include the principal diagnosis plus these additional secondary conditions. All-listed procedures include all procedures performed during the hospital stay, whether for definitive treatment or for diagnostic or exploratory purposes. The first-listed procedure is the procedure that is listed first on the discharge record. Inpatient data define this as the principal procedure—the procedure that is performed for definitive treatment rather than for diagnostic or exploratory purposes (i.e., the procedure that was necessary to take care of a complication). ICD-9-CM is the International Classification of Diseases, Ninth Revision, Clinical Modification, which assigns numeric codes to diagnoses and procedures. There are approximately 14,000 ICD-9-CM diagnosis codes and 4,000 ICD-9-CM procedure codes. CCS categorizes ICD-9-CM diagnosis codes and procedure codes into a manageable number of clinically meaningful categories.11 This clinical grouper makes it easier to quickly understand patterns of diagnoses and procedure use. CCS categories identified as Other typically are not reported; these categories include miscellaneous, otherwise unclassifiable diagnoses and procedures that may be difficult to interpret as a group. Case definition The six types of malnutrition were defined using the ICD-9-CM diagnosis codes listed in Table 5. Maternal and neonatal discharges, identified by Major Diagnostic Category (MDC) 14 (Pregnancy, Childbirth & the Puerperium) and MDC 15 (Newborns and Other Neonates With Conditions Originating in the Perinatal Period), were excluded from the analysis. Discharges identified only as a personal history or screening for malnutrition were not included (V12.1, Personal history of nutritional deficiency; V77.2, Special screening for malnutrition). |
| Table 5. ICD-9-CM diagnosis codes for malnutrition | |
| ICD-9-CM diagnosis code | Description |
|---|---|
| Postsurgical nonabsorption | |
| 579.3 | Other and unspecified postsurgical nonabsorption |
| Nutritional neglect | |
| 995.52 | Child neglect (nutritional) |
| 995.84 | Adult neglect (nutritional) |
| Cachexia | |
| 799.4 | Cachexia |
| Protein-calorie malnutrition | |
| 260 | Kwashiorkor |
| 261 | Nutritional marasmus |
| 262 | Other severe protein-calorie malnutrition |
| 263.0 | Malnutrition of moderate degree |
| 263.1 | Malnutrition of mild degree |
| 263.2 | Arrested development following protein-calorie malnutrition |
| 263.8 | Other protein-calorie malnutrition |
| 263.9 | Unspecified protein-calorie malnutrition |
| Weight loss, failure to thrive | |
| 783.21 | Loss of weight |
| 783.3 | Feeding difficulties and mismanagement |
| Failure to thrive (child) | |
| 783.7 | Adult failure to thrive |
| Underweight | |
| 783.22 | Underweight |
| V85.0 | Body Mass Index less than 19, adult |
| V85.51 | Body Mass Index, pediatric, less than 5th percentile for age |
Each hospital stay involving malnutrition was categorized into only one malnutrition type based on the following hierarchy:
If a single inpatient record included multiple diagnosis codes indicating different types of malnutrition (e.g., nutritional neglect and underweight), the record was classified into the higher-ranked type of malnutrition (in this example, nutritional neglect). If both types of malnutrition at the same hierarchy level appeared on a discharge record (e.g., both postsurgical nonabsorption and nutritional neglect), then the record was classified into the malnutrition type that appeared first on the record. Table 6 reports the frequency of the six different types of malnutrition by individual diagnosis code among hospital inpatient stays in 2013. The following two additional statistics are provided: (1) the frequency with which each code is the only type of malnutrition code reported on the hospital discharge record and (2) the frequency with which each code occurs either alone or before any other malnutrition code reported on the record. |
| Table 6. Number and co-occurrence of different types of malnutrition, 2013 | |||||||
| Malnutrition type | Diagnosis code | Code description | Total records with this malnutrition code | Records with only this malnutrition code | Records with only this malnutrition code or with this malnutrition code listed first | ||
|---|---|---|---|---|---|---|---|
| N | N | % | N | % | |||
| Postsurgical nonabsorption | 579.3 | Other and unspecified postsurgical nonabsorption | 33,500 | 21,665 | 64.7 | 27,550 | 82.2 |
| Nutritional neglect | 995.52 | Child neglect (nutritional) | 1,035 | 510 | 49.3 | 825 | 79.7 |
| 995.84 | Adult neglect (nutritional) | 1,800 | 820 | 45.6 | 1,195 | 66.4 | |
| Cachexia | 799.4 | Cachexia | 211,210 | 78,995 | 37.4 | 154,180 | 73.0 |
| Protein-calorie malnutrition | 260 | Kwashiorkor | 1,990 | 1,380 | 69.3 | 1,885 | 94.7 |
| 261 | Nutritional marasmus | 85,795 | 51,975 | 60.6 | 82,625 | 96.3 | |
| 262 | Other severe protein-calorie malnutrition | 270,475 | 179,265 | 66.3 | 261,765 | 96.8 | |
| 263.0 | Malnutrition of moderate degree | 195,225 | 150,205 | 76.9 | 183,620 | 94.1 | |
| 263.1 | Malnutrition of mild degree | 75,335 | 61,150 | 81.2 | 71,540 | 95.0 | |
| 263.2 | Arrested development following protein-calorie malnutrition | 85 | 55 | 64.7 | 70 | 82.4 | |
| 263.8 | Other protein-calorie malnutrition | 16,340 | 12,345 | 75.6 | 15,250 | 93.3 | |
| 263.9 | Unspecified protein-calorie malnutrition | 650,320 | 496,530 | 76.4 | 610,375 | 93.9 | |
| Weight loss, failure to thrive | 783.21 | Loss of weight | 257,195 | 164,140 | 63.8 | 173,550 | 67.5 |
| 783.3 | Feeding difficulties and mismanagement | 47,595 | 32,380 | 68.0 | 35,630 | 74.9 | |
| 783.41 | Failure to thrive (child) | 36,740 | 23,075 | 62.8 | 30,530 | 83.1 | |
| 783.7 | Adult failure to thrive | 305,215 | 177,275 | 58.1 | 195,815 | 64.2 | |
| Underweight | 783.22 | Underweight | 29,470 | 5,975 | 20.3 | 8,710 | 29.6 |
| V85.0 | Body Mass Index less than 19, adult | 307,915 | 39,980 | 13.0 | 98,450 | 32.0 | |
| V85.51 | Body Mass Index, pediatric, less than 5th percentile for age | 2,980 | 615 | 20.6 | 880 | 29.5 | |
| Source: Agency for Healthcare Research and Quality (AHRQ), Center for Delivery, Organization, and Markets, Healthcare Cost and Utilization Project (HCUP), National Inpatient Sample (NIS), 2013 | |||||||
Receipt of enteral and parenteral nutrition was based on CCS procedure category 223. CCS 223 includes ICD-9-CM procedure code 966 (Enteral infusion of concentrated nutritional substances) and ICD-9-CM procedure code 9915 (Parenteral infusion of concentrated nutritional substances).
Types of hospitals included in the HCUP National Inpatient Sample The National Inpatient Sample (NIS) is based on data from community hospitals, which are defined as short-term, non-Federal, general, and other hospitals, excluding hospital units of other institutions (e.g., prisons). The NIS includes obstetrics and gynecology, otolaryngology, orthopedic, cancer, pediatric, public, and academic medical hospitals. Excluded are long-term care facilities such as rehabilitation, psychiatric, and alcoholism and chemical dependency hospitals. Beginning in 2012, long-term acute care hospitals are also excluded. However, if a patient received long-term care, rehabilitation, or treatment for a psychiatric or chemical dependency condition in a community hospital, the discharge record for that stay will be included in the NIS. Unit of analysis The unit of analysis is the hospital discharge (i.e., the hospital stay), not a person or patient. This means that a person who is admitted to the hospital multiple times in 1 year will be counted each time as a separate discharge from the hospital. Costs and charges Total hospital charges were converted to costs using HCUP Cost-to-Charge Ratios based on hospital accounting reports from the Centers for Medicare & Medicaid Services (CMS).12 Costs reflect the actual expenses incurred in the production of hospital services, such as wages, supplies, and utility costs; charges represent the amount a hospital billed for the case. For each hospital, a hospital-wide cost-to-charge ratio is used. Hospital charges reflect the amount the hospital billed for the entire hospital stay and do not include professional (physician) fees. For the purposes of this Statistical Brief, mean costs are reported to the nearest hundred. How HCUP estimates of costs differ from National Health Expenditure Accounts There are a number of differences between the costs cited in this Statistical Brief and spending as measured in the National Health Expenditure Accounts (NHEA), which are produced annually by CMS.13 The largest source of difference comes from the HCUP coverage of inpatient treatment only in contrast to the NHEA inclusion of outpatient costs associated with emergency departments and other hospital-based outpatient clinics and departments as well. The outpatient portion of hospitals' activities has been growing steadily and may exceed half of all hospital revenue in recent years. On the basis of the American Hospital Association Annual Survey, 2012 outpatient gross revenues (or charges) were about 44 percent of total hospital gross revenues.14 Smaller sources of differences come from the inclusion in the NHEA of hospitals that are excluded from HCUP. These include Federal hospitals (Department of Defense, Veterans Administration, Indian Health Services, and Department of Justice [prison] hospitals) as well as psychiatric, substance abuse, and long-term care hospitals. A third source of difference lies in the HCUP reliance on billed charges from hospitals to payers, adjusted to provide estimates of costs using hospital-wide cost-to-charge ratios, in contrast to the NHEA measurement of spending or revenue. HCUP costs estimate the amount of money required to produce hospital services, including expenses for wages, salaries, and benefits paid to staff as well as utilities, maintenance, and other similar expenses required to run a hospital. NHEA spending or revenue measures the amount of income received by the hospital for treatment and other services provided, including payments by insurers, patients, or government programs. The difference between revenues and costs include profit for for-profit hospitals or surpluses for nonprofit hospitals. Location of patients' residence Place of residence is based on the urban-rural classification scheme for U.S. counties developed by the National Center for Health Statistics (NCHS):
Median community-level income Median community-level income is the median household income of the patient's ZIP Code of residence. Income levels are separated into population-based quartiles with cut-offs determined using ZIP Code demographic data obtained from the Nielsen Company. The income quartile is missing for patients who are homeless or foreign. Payer Payer is the expected payer for the hospital stay. To make coding uniform across all HCUP data sources, payer combines detailed categories into general groups:
Hospital stays billed to the State Children's Health Insurance Program (SCHIP) may be classified as Medicaid, Private Insurance, or Other, depending on the structure of the State program. Because most State data do not identify patients in SCHIP specifically, it is not possible to present this information separately. For this Statistical Brief, when more than one payer is listed for a hospital discharge, the first-listed payer is used. Admission source or point of origin Admission source (now known as the patient's point of origin) indicates where the patient was located prior to admission to the hospital. Emergency admission indicates that the patient was admitted to the hospital through the emergency department. Admission from another hospital indicates that the patient was admitted to this hospital from another short-term, acute-care hospital. This usually signifies that the patient required the transfer in order to obtain more specialized services that the originating hospital could not provide. Admission from a long-term care facility indicates that the patient was admitted from a long-term facility such as a nursing home. Discharge status Discharge status reflects the disposition of the patient at discharge from the hospital and includes the following six categories: routine (to home); transfer to another short-term hospital; other transfers (including skilled nursing facility, intermediate care, and another type of facility such as a nursing home); home healthcare; against medical advice (AMA); or died in the hospital. Reporting of race and ethnicity Data on Hispanic ethnicity are collected differently among the States and also can differ from the Census methodology of collecting information on race (White, Black, Asian/Pacific Islander, American Indian/Alaska Native, Other (including mixed race)) separately from ethnicity (Hispanic, non-Hispanic). State data organizations often collect Hispanic ethnicity as one of several categories that include race. Therefore, for multistate analyses, HCUP creates the combined categorization of race and ethnicity for data from States that report ethnicity separately. When a State data organization collects Hispanic ethnicity separately from race, HCUP uses Hispanic ethnicity to override any other race category to create a Hispanic category for the uniformly coded race/ethnicity data element, while also retaining the original race and ethnicity data. This Statistical Brief reports race/ethnicity for the following categories: Hispanic, non-Hispanic White, non-Hispanic Black, and non-Hispanic Other. Present on admission In many cases the hospital discharge record includes an indication that the diagnosis was present on admission, the diagnosis occurred during the hospital stay, or onset could not be determined.15 About HCUP The Healthcare Cost and Utilization Project (HCUP, pronounced "H-Cup") is a family of healthcare databases and related software tools and products developed through a Federal-State-Industry partnership and sponsored by the Agency for Healthcare Research and Quality (AHRQ). HCUP databases bring together the data collection efforts of State data organizations, hospital associations, and private data organizations (HCUP Partners) and the Federal government to create a national information resource of encounter-level healthcare data. HCUP includes the largest collection of longitudinal hospital care data in the United States, with all-payer, encounter-level information beginning in 1988. These databases enable research on a broad range of health policy issues, including cost and quality of health services, medical practice patterns, access to healthcare programs, and outcomes of treatments at the national, State, and local market levels. HCUP would not be possible without the contributions of the following data collection Partners from across the United States: Alaska State Hospital and Nursing Home Association Arizona Department of Health Services Arkansas Department of Health California Office of Statewide Health Planning and Development Colorado Hospital Association Connecticut Hospital Association District of Columbia Hospital Association Florida Agency for Health Care Administration Georgia Hospital Association Hawaii Health Information Corporation Illinois Department of Public Health Indiana Hospital Association Iowa Hospital Association Kansas Hospital Association Kentucky Cabinet for Health and Family Services Louisiana Department of Health and Hospitals Maine Health Data Organization Maryland Health Services Cost Review Commission Massachusetts Center for Health Information and Analysis Michigan Health & Hospital Association Minnesota Hospital Association Mississippi Department of Health Missouri Hospital Industry Data Institute Montana MHA - An Association of Montana Health Care Providers Nebraska Hospital Association Nevada Department of Health and Human Services New Hampshire Department of Health & Human Services New Jersey Department of Health New Mexico Department of Health New York State Department of Health North Carolina Department of Health and Human Services North Dakota (data provided by the Minnesota Hospital Association) Ohio Hospital Association Oklahoma State Department of Health Oregon Association of Hospitals and Health Systems Oregon Office of Health Analytics Pennsylvania Health Care Cost Containment Council Rhode Island Department of Health South Carolina Revenue and Fiscal Affairs Office South Dakota Association of Healthcare Organizations Tennessee Hospital Association Texas Department of State Health Services Utah Department of Health Vermont Association of Hospitals and Health Systems Virginia Health Information Washington State Department of Health West Virginia Health Care Authority Wisconsin Department of Health Services Wyoming Hospital Association About Statistical Briefs HCUP Statistical Briefs are descriptive summary reports presenting statistics on hospital inpatient and emergency department use and costs, quality of care, access to care, medical conditions, procedures, patient populations, and other topics. The reports use HCUP administrative healthcare data. About the NIS The HCUP National (Nationwide) Inpatient Sample (NIS) is a nationwide database of hospital inpatient stays. The NIS is nationally representative of all community hospitals (i.e., short-term, non-Federal, nonrehabilitation hospitals). The NIS includes all payers. It is drawn from a sampling frame that contains hospitals comprising more than 95 percent of all discharges in the United States. The vast size of the NIS allows the study of topics at the national and regional levels for specific subgroups of patients. In addition, NIS data are standardized across years to facilitate ease of use. Over time, the sampling frame for the NIS has changed; thus, the number of States contributing to the NIS varies from year to year. The NIS is intended for national estimates only; no State-level estimates can be produced. The 2012 NIS was redesigned to optimize national estimates. The redesign incorporates two critical changes:
For More Information For more information about HCUP, visit http://www.hcup-us.ahrq.gov/. For additional HCUP statistics, visit HCUP Fast Stats at https://datatools.ahrq.gov/hcup-fast-stats for easy access to the latest HCUP-based statistics for health information topics, or visit HCUPnet, HCUP's interactive query system, at https://datatools.ahrq.gov/hcupnet. For information on other hospitalizations in the United States, refer to the following HCUP Statistical Briefs located at http://www.hcup-us.ahrq.gov/reports/statbriefs/statbriefs.jsp:
For a detailed description of HCUP and more information on the design of the National Inpatient Sample (NIS), please refer to the following database documentation: Agency for Healthcare Research and Quality. Overview of the National (Nationwide) Inpatient Sample (NIS). Healthcare Cost and Utilization Project (HCUP). Rockville, MD: Agency for Healthcare Research and Quality. Updated November 2015. http://www.hcup-us.ahrq.gov/nisoverview.jsp. Accessed February 17, 2016. Suggested Citation Weiss AJ (Truven Health Analytics), Fingar KR (Truven Health Analytics), Barrett ML (M.L. Barrett, Inc.), Elixhauser A (AHRQ), Steiner CA (AHRQ), Guenter P (American Society for Parenteral and Enteral Nutrition), Brown MH (Baxter International, Inc.). Characteristics of Hospital Stays Involving Malnutrition, 2013. HCUP Statistical Brief #210. September 2016. Agency for Healthcare Research and Quality, Rockville, MD. http://www.hcup-us.ahrq.gov/reports/statbriefs/sb210-Malnutrition-Hospital-Stays-2013.pdf. Acknowledgments The authors would like to acknowledge the contributions of Ainsley Malone of the American Society for Parenteral and Enteral Nutrition, Evangelia Davanos and Crystal Riley of Baxter Healthcare Corporation, and Minya Sheng of Truven Health Analytics. *** AHRQ welcomes questions and comments from readers of this publication who are interested in obtaining more information about access, cost, use, financing, and quality of healthcare in the United States. We also invite you to tell us how you are using this Statistical Brief and other HCUP data and tools, and to share suggestions on how HCUP products might be enhanced to further meet your needs. Please e-mail us at hcup@ahrq.gov or send a letter to the address below:David Knutson, Director Center for Delivery, Organization, and Markets Agency for Healthcare Research and Quality 5600 Fishers Lane Rockville, MD 20857 This Statistical Brief was posted online on September 20, 2016. 1 White JV, Guenter P, Jensen G, Malone A, Schofield M, Academy Malnutrition Work Group, et al. Consensus statement: Academy of Nutrition and Dietetics and American Society for Parenteral and Enteral Nutrition: characteristics recommended for the identification and documentation of adult malnutrition (undernutrition). Journal of Parenteral and Enteral Nutrition. 2012:36(3):275-83. 2 Corkins MR, Guenter P, DiMaria-Ghalili RA, Jensen GL, Malone A, Miller S, et al. Malnutrition diagnoses in hospitalized patients: United States, 2010. Journal of Parenteral and Enteral Nutrition. 2014;38(2):186-95. 3 Ibid. 4 Tappenden KA, Quatrara B, Parkhurst ML, Malone AM, Fanjiang G, Ziegler TR. Critical role of nutrition in improving quality of care: an interdisciplinary call to action to address adult hospital malnutrition. Journal of the Academy of Nutrition and Dietetics. 2013;113(9):1219-37. 5 White et al., 2012. Op. cit. 6 Lean M, Wiseman M. Malnutrition in hospitals. BMJ. 2008;336(7639):290. 7 White et al., 2012. Op. cit. 8 Ibid. 9 Only 28.3 percent of stays with underweight diagnoses were reported as present on admission. However, the International Classification of Diseases, Ninth Revision, Clinical Modification (ICD-9-CM) V codes for body mass index that are part of the underweight malnutrition type (V85.0 and V85.51) are exempt from present-on-admission reporting. 10 The Nielsen Company. Nielsen Demographic Data. Available: https://www.claritas.com/. 11 Agency for Healthcare Research and Quality. HCUP Clinical Classifications Software (CCS). Healthcare Cost and Utilization Project (HCUP). Rockville, MD: Agency for Healthcare Research and Quality. Updated June 2015. http://www.hcup-us.ahrq.gov/toolssoftware/ccs/ccs.jsp. Accessed February 17, 2016. 12 Agency for Healthcare Research and Quality. HCUP Cost-to-Charge Ratio (CCR) Files. Healthcare Cost and Utilization Project (HCUP). 2001-2013. Rockville, MD: Agency for Healthcare Research and Quality. Updated November 2015. http://www.hcup-us.ahrq.gov/db/state/costtocharge.jsp. Accessed February 17, 2016. 13 For additional information about the NHEA, see Centers for Medicare & Medicaid Services (CMS). National Health Expenditure Data. CMS website May 2014. http://www.cms.gov/Research-Statistics-Data-and-Systems/Statistics-Trends-and-Reports/NationalHealthExpendData/index.html?redirect=/NationalHealthExpendData/. Accessed February 17, 2016. 14 American Hospital Association. TrendWatch Chartbook, 2014. Table 4.2. Distribution of Inpatient vs. Outpatient Revenues, 1992-2012. Original source is no longer available on the Web; for related information refer to TrendWatch Chartbook, 2018. Table 4.2. Distribution of Inpatient vs. Outpatient Revenues, 1995-2016. www.aha.org/system/files/2018-05/2018-chartbook-table-4-2.pdf. 15 Centers for Medicare & Medicaid Services. Hospital-Acquired Conditions (Present on Admission Indicator). Reporting. Last modified February 12, 2014. http://www.cms.gov/Medicare/Medicare-Fee-for-Service-Payment/HospitalAcqCond/Reporting.html. Accessed June 29, 2016. |
| Internet Citation: Statistical Brief #210. Healthcare Cost and Utilization Project (HCUP). September 2016. Agency for Healthcare Research and Quality, Rockville, MD. hcup-us.ahrq.gov/reports/statbriefs/sb210-Malnutrition-Hospital-Stays-2013.jsp. |
| Are you having problems viewing or printing pages on this website? |
| If you have comments, suggestions, and/or questions, please contact hcup@ahrq.gov. |
| If you are experiencing issues related to Section 508 accessibility of information on this website, please contact hcup@ahrq.gov. |
| Privacy Notice, Viewers & Players |
| Last modified 9/15/16 |