STATISTICAL BRIEF #198 |
December 2015
Susan O. Raetzman, M.S.P.H., Anika L. Hines, Ph.D., M.P.H., Marguerite L. Barrett, M.S., and Zeynal Karaca, Ph.D. Introduction The Centers for Medicare & Medicaid Services (CMS) use two main mechanisms to pay for covered services received by Medicare beneficiaries. The traditional mechanism is fee for service (FFS),1 by which CMS contractors administer a payment to providers based on the specific medical service delivered to the beneficiary. An alternative payment mechanism involves paying a predetermined amount per beneficiary to CMS-approved private insurance companies that deliver covered services doing business as Medicare Advantage (MA) plans.2 The set payment per beneficiary to MA plans is intended to incentivize innovation and efficiency and promote care management. This incentive structure is important because, despite a slowdown in the average spending for Medicare beneficiaries over the past few years, aggregate Medicare spending is projected to increase 5 to 7 percent annually over the next 10 years.3 However, historically, MA plans have received higher per enrollee payments relative to the average spending on care for beneficiaries in Medicare FFS. More recently, under provisions of the Affordable Care Act of 2010, the difference between per enrollee payments to MA plans and those on behalf of beneficiaries in Medicare FFS have become smaller.4 MA plan enrollment continues to increase, more than tripling since 2003.5 In 2014, 15.8 million Medicare beneficiaries—30 percent of the total—enrolled in MA plans.6 Because both overall Medicare spending and beneficiary are affected by MA plans, the MA program is a focal point for policymakers. A key issue is how resource use by beneficiaries in MA plans compares with that by beneficiaries in Medicare FFS. Healthcare resource use can be measured by the number of hospital stays, length of inpatient stays, and average costs for hospital stays, and resource use varies across hospital settings. In addition, resource use by Medicare enrollees younger than 65 years who are entitled to coverage on the basis of disability or end-stage renal disease differs in important ways from that by Medicare enrollees 65 years and older; this younger age group accounted for 17 percent of the Medicare population in 2012.7 Published studies on the relative use of resources between MA plans and Medicare FFS generally have found lower service use by MA plan enrollees after controlling for demographic characteristics and health status.8 This Healthcare Cost and Utilization Project (HCUP) Statistical Brief presents data from the 13 States that provide the distinction between MA plans and Medicare FFS in their information on payment source. Statistics are presented on utilization and costs of hospital inpatient stays for which Medicare is the primary expected payment source. Outcomes are provided by Medicare coverage option—MA plan versus Medicare FFS—and for two Medicare patient age groups (younger than 65 years and 65 years and older). Information is presented for different types of hospital stays and for select hospital characteristics. Only differences in values of 10 percent or greater between MA and FFS are noted in the text. |
|
Findings
Characteristics of Medicare hospital stays, 2013 Table 1 presents characteristics of inpatient hospitalizations in 2013 for which Medicare was the expected primary payer. Statistics are reported separately for stays for which the expected primary payer was an MA plan versus Medicare FFS; these payer groups are further subdivided into patients younger than 65 years versus those 65 years and older. |
| Table 1. Characteristics of Medicare hospital inpatient stays by patient age and Medicare coverage option, 2013 | ||||
| Characteristic | Younger than 65 years | 65 years and older | ||
|---|---|---|---|---|
| MA | FFS | MA | FFS | |
| Patient characteristics | ||||
| Mean age, years | 53.4 | 51.6 | 77.5 | 78.4 |
| Female, % | 51.2 | 48.1 | 55.3 | 56.6 |
| Chronic conditions | ||||
| Mean number | 3.4 | 3.3 | 4.1 | 4.1 |
| None, % | 6.3 | 5.7 | 1.9 | 1.9 |
| 1-4 conditions, % | 66.1 | 68.0 | 58.5 | 58.4 |
| 5+ conditions, % | 27.7 | 26.3 | 39.7 | 39.8 |
| Hospital stay characteristics | ||||
| Total hospital stays, na | 260,100 | 857,500 | 1,390,100 | 3,307,700 |
| Aggregate costs, billions $ | 3.2 | 11.6 | 17.9 | 44.8 |
| Admissions from emergency department, % | 68.8 | 70.0 | 71.8 | 70.3 |
| Mean length of stay, days | 5.4 | 6.1 | 5.2 | 5.6 |
| Abbreviations: MA, Medicare Advantage; FFS, fee for service Note: FFS refers to the traditional Medicare fee-for-service program and not the private fee-for-service plans that are offered under the Medicare Advantage program. a The number of total hospital stays is rounded to the nearest 100. Source: Agency for Healthcare Research and Quality (AHRQ), Center for Delivery, Organization, and Markets, Healthcare Cost and Utilization Project (HCUP), State Inpatient Databases (SID) for 13 States, 2013 | ||||
Table 2 presents utilization and costs for select types of hospital inpatient stays among Medicare patients in 2013. Statistics are reported separately by age (younger than 65 years vs. 65 years and older), and these age groups are subdivided into the Medicare coverage options (MA vs. FFS). |
| Table 2. Utilization and cost per stay for Medicare hospital inpatient stays by patient age and Medicare coverage option, 2013 | ||||||
| Type of stay | Hospital stays, % | Mean length of stay, days | Mean cost per stay, $a | |||
|---|---|---|---|---|---|---|
| MA | FFS | MA | FFS | MA | FFS | |
| Younger than 65 years | ||||||
| Type of hospital service | ||||||
| Medical stays | 60.9 | 62.1 | 4.7 | 5.1 | 9,200 | 10,500 |
| Surgical stays | 23.8 | 19.7 | 6.4 | 7.3 | 23,300 | 26,800 |
| Injury-related stays | 4.0 | 3.7 | 4.8 | 5.0 | 13,300 | 14,800 |
| Mental health stays | 9.6 | 13.8 | 7.5 | 9.2 | 7,300 | 8,300 |
| Selected types of stays | ||||||
| Potentially preventable hospitalizations | 15.6 | 14.5 | 4.7 | 4.8 | 9,000 | 9,800 |
| Resource intensive DRGs | 17.3 | 17.1 | 4.5 | 4.9 | 10,300 | 11,400 |
| 65 years and older | ||||||
| Type of hospital service | ||||||
| Medical stays | 66.7 | 69.1 | 4.7 | 5.2 | 9,100 | 10,000 |
| Surgical stays | 25.8 | 22.8 | 6.0 | 6.3 | 22,600 | 24,400 |
| Injury-related stays | 5.7 | 5.9 | 5.1 | 5.1 | 13,900 | 14,300 |
| Mental health stays | 1.7 | 2.2 | 8.1 | 9.6 | 8,700 | 9,600 |
| Selected types of stays | ||||||
| Potentially preventable hospitalizations | 16.9 | 17.5 | 4.7 | 4.8 | 8,600 | 9,100 |
| Resource intensive DRGs | 21.8 | 21.8 | 4.8 | 5.2 | 10,700 | 11,400 |
| Abbreviations: DRG, diagnosis-related group; MA, Medicare Advantage; FFS, fee for service Note: FFS refers to the traditional Medicare fee-for-service program and not the private fee-for-service plans that are offered under the Medicare Advantage program. a The mean cost per stay is rounded to the nearest 100. Source: Agency for Healthcare Research and Quality (AHRQ), Center for Delivery, Organization, and Markets, Healthcare Cost and Utilization Project (HCUP), State Inpatient Databases (SID) for 13 States, 2013 | ||||||
|
|
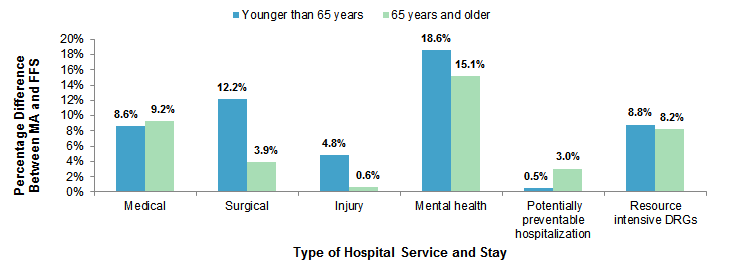
Figure 1. Percentage by which mean length of stay is lower for patients in MA plans versus those with Medicare FFS, by patient age and type of stay, 2013
Abbreviations: DRG, diagnosis-related group; MA, Medicare Advantage; FFS, fee for service Figure 1 shows the percentage by which mean length of stay was lower for patients in Medicare Advantage plans versus patients in the Medicare fee-for-service program, by patient age group and type of stay in 2013. For medical services, mean length of stay was 8.6% lower for Medicare Advantage patients than for Medicare fee-for-service patients for patients younger than 65 years and 9.2% lower for patients 65 years and older. For surgical services, mean length of stay was 12.2% lower for Medicare Advantage patients than for Medicare fee-for-service patients for patients younger than 65 years and 3.9% lower for patients 65 years and older. For services related to injuries, mean length of stay was 4.8% lower for Medicare Advantage patients than for Medicare fee-for-service patients for patients younger than 65 years and 0.6% lower for patients 65 years and older. For mental health services, mean length of stay was 18.6% lower for Medicare Advantage patients than for Medicare fee-for-service patients for patients younger than 65 years and 15.1% lower for patients 65 years and older. For potentially preventable hospitalizations, mean length of stay was 0.5% lower for Medicare Advantage patients than for Medicare fee-for-service patients for patients younger than 65 years and 3.0% lower for patients 65 years and older. For resource intensive diagnosis-related groups, mean length of stay was 8.8% lower for Medicare Advantage patients than for Medicare fee-for-service patients for patients younger than 65 years and 8.2% lower for patients 65 years and older.
|
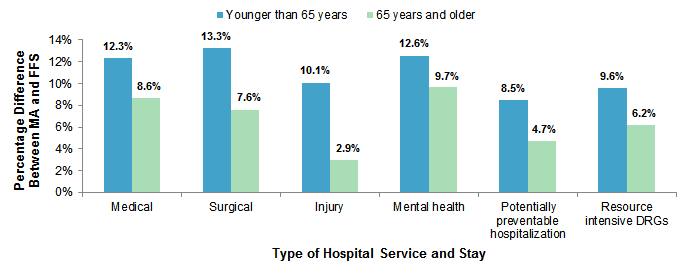
Figure 2 illustrates the percentage by which mean hospital cost per stay is lower for patients in MA plans than for those with Medicare FFS. |
|
Figure 2. Percentage by which mean hospital costs are lower for patients in MA plans versus with Medicare FFS, by patient age and type of stay, 2013
Abbreviations: DRG, diagnosis-related group; MA, Medicare Advantage; FFS, fee-for-service Figure 2 shows the percentage by which mean hospital costs were lower for patients in Medicare Advantage plans versus patients in the Medicare fee-for-service program, by patient age group and type of stay in 2013. For medical services, mean hospital costs were 12.3% lower for Medicare Advantage patients than for Medicare fee-for-service patients for patients younger than 65 years and 8.6% lower for patients 65 years and older. For surgical services, mean hospital costs were 13.3% lower for Medicare Advantage patients than for Medicare fee-for-service patients for patients younger than 65 years and 7.6% lower for patients 65 years and older. For services related to injuries, mean hospital costs were 10.1% lower for Medicare Advantage patients than for Medicare fee-for-service patients for patients younger than 65 years and 2.9% lower for patients 65 years and older. For mental health services, mean hospital costs were 12.6% lower for Medicare Advantage patients than for Medicare fee-for-service patients for patients younger than 65 years and 9.7% lower for patients 65 years and older. For potentially preventable hospitalizations, mean hospital costs were 8.5% lower for Medicare Advantage patients than for Medicare fee-for-service patients for patients younger than 65 years and 4.7% lower for patients 65 years and older. For resource intensive diagnosis-related groups, mean hospital costs were 9.6% lower for Medicare Advantage patients than for Medicare fee-for-service patients for patients younger than 65 years and 6.2% lower for patients 65 years and older.
|
Hospital utilization and costs for Medicare patients by select hospital characteristics, 2013 Table 3 presents utilization and costs for hospital inpatient stays in 2013 among Medicare patients by select hospital characteristics. Statistics are reported separately by Medicare patient age group (younger than 65 years vs. 65 years and older) and Medicare coverage option (MA vs. FFS). |
| Table 3. Utilization and cost of Medicare hospital inpatient stays for select hospital characteristics by patient age and Medicare coverage option, 2013 | ||||||
| Hospital characteristics | Hospital stays, % | Mean length of stay, days | Mean cost per stay, $a | |||
|---|---|---|---|---|---|---|
| MA | FFS | MA | FFS | MA | FFS | |
| Younger than 65 years | ||||||
| Teaching hospitals | 55.3 | 50.4 | 5.8 | 6.5 | 14,000 | 15,300 |
| Small hospitals (<100 beds) | 5.9 | 8.9 | 4.9 | 6.4 | 10,800 | 12,600 |
| Ownership | ||||||
| Public hospitals | 8.7 | 11.8 | 5.8 | 6.8 | 13,100 | 15,000 |
| Private, not-for-profit hospitals | 73.2 | 71.3 | 5.4 | 5.9 | 13,100 | 13,800 |
| Private, investor-owned hospitals | 18.1 | 16.9 | 4.8 | 6.5 | 9,600 | 11,100 |
| Hospital system | ||||||
| Centralized | 24.9 | 20.5 | 5.6 | 6.0 | 13,600 | 14,300 |
| Moderately centralized | 10.3 | 14.8 | 5.5 | 6.1 | 15,500 | 15,600 |
| Decentralized | 35.7 | 26.6 | 4.9 | 5.6 | 10,300 | 11,000 |
| Independent | 5.5 | 7.9 | 6.2 | 8.1 | 13,600 | 15,500 |
| 65 years and older | ||||||
| Teaching hospitals | 50.8 | 44.1 | 5.5 | 5.8 | 14,300 | 15,100 |
| Small hospitals (<100 beds) | 5.8 | 10.2 | 5.0 | 5.7 | 11,300 | 12,300 |
| Ownership | ||||||
| Public hospitals | 7.7 | 9.9 | 5.4 | 5.7 | 13,600 | 14,400 |
| Private, not-for-profit hospitals | 76.3 | 73.9 | 5.2 | 5.5 | 13,400 | 13,900 |
| Private, investor-owned hospitals | 16.0 | 16.3 | 4.8 | 5.9 | 10,200 | 11,600 |
| Hospital systemb | ||||||
| Centralized | 24.2 | 20.5 | 5.5 | 5.5 | 13,800 | 14,100 |
| Moderately centralized | 10.5 | 14.1 | 5.4 | 5.5 | 14,900 | 15,300 |
| Decentralized | 37.1 | 27.9 | 4.7 | 5.1 | 11,000 | 11,500 |
| Independent | 5.3 | 6.8 | 5.7 | 7.3 | 13,800 | 15,400 |
| Abbreviations: DRG, diagnosis-related group; MA, Medicare Advantage; FFS, fee for service Note: FFS refers to the traditional Medicare fee-for-service program and not the private fee-for-service plans that are offered under the Medicare Advantage program. a The mean cost per stay is rounded to the nearest 100. b In 2013, 28.4 percent of community, nonrehabilitation hospitals in the included States did not report to the American Hospital Association on type of hospital system. Source: Agency for Healthcare Research and Quality (AHRQ), Center for Delivery, Organization, and Markets, Healthcare Cost and Utilization Project (HCUP), State Inpatient Databases (SID) for 13 States, 2013 | ||||||
The estimates in this Statistical Brief are based upon data from the Healthcare Cost and Utilization Project (HCUP) 2013 State Inpatient Databases (SID) for 13 States: California, Connecticut, Florida, Georgia, Iowa, Kentucky, Maryland, New York, Oregon, Pennsylvania, Rhode Island, Tennessee, and West Virginia. These States provided enough detail on patients' source of payment to distinguish Medicare Advantage (MA) from fee for service (FFS). Data from the American Hospital Association (AHA) Annual Survey of Hospitals were used to obtain the hospital characteristics in the 13 States. Definitions Case definition The inclusion of a State in this analysis was based on three criteria:
Diagnoses, ICD-9-CM, Clinical Classifications Software (CCS), and diagnosis-related groups (DRGs) The principal diagnosis is that condition established after study to be chiefly responsible for the patient's admission to the hospital. Secondary diagnoses are concomitant conditions that coexist at the time of admission or develop during the stay. All-listed diagnoses include the principal diagnosis plus these additional secondary conditions. ICD-9-CM is the International Classification of Diseases, Ninth Revision, Clinical Modification, which assigns numeric codes to diagnoses. There are approximately 14,000 ICD-9-CM diagnosis codes. CCS categorizes ICD-9-CM diagnoses into a manageable number of clinically meaningful categories.9 This clinical grouper makes it easier to quickly understand patterns of diagnoses. CCS categories identified as Other typically are not reported; these categories include miscellaneous, otherwise unclassifiable diagnoses that may be difficult to interpret as a group. DRGs comprise a patient classification system that categorizes patients into groups that are clinically coherent and homogeneous with respect to resource use. DRGs group patients according to diagnosis, type of treatment (procedures), age, and other relevant criteria. Each hospital stay has one assigned DRG. DRGs are sensitive to whether the stay involved complications or comorbidities. Coding criteria for the four hospital service lines are provided in Table 4 and are based on ICD-9-CM codes, CCS categories, and DRGs. Each discharge was assigned to a single hospital service line hierarchically, based on the following order: maternal/neonatal, mental health, injury, surgical, and medical. |
Table 4. Coding criteria for the four hospital service lines analyzed in this research |
| Mental health service line |
| Mental health visits are defined using the following CCS principal diagnosis categories:
Starting in 2007
|
| Injury service line |
| Injuries are identified using the principal diagnosis and a scheme recommended by Safe States Alliance, which was previously known as the State and Territorial Injury Prevention Directors Association (STIPDA). Diagnosis codes in the 800-999 range used to identify injuries are listed below:
Included
|
| Surgical service line |
| Surgical stays are identified by a surgical DRG. The DRG grouper first assigns the discharge to a major diagnostic category (MDC) based on the principal diagnosis. For each MDC, there is a list of procedure codes that qualify as operating room procedures. If the discharge involves an operating room procedure, it is assigned to one of the surgical DRGs within the MDC category; otherwise, it is assigned to a medical DRG. |
| Medical service line |
| Medical stays are identified by a medical DRG. The DRG grouper first assigns the discharge to an MDC based on the principal diagnosis. For each MDC, there is a list of procedure codes that qualify as operating room procedures. If the discharge involves an operating room procedure, it is assigned to one of the surgical DRGs within the MDC category; otherwise, it is assigned to a medical DRG. |
| Abbreviations: CCS, Clinical Classifications Software; DRG, diagnosis-related group; NEC, not elsewhere classified |
Types of hospitals included in HCUP State Inpatient Databases
This analysis used State Inpatient Databases (SID) limited to data from community hospitals, which are defined as short-term, non-Federal, general, and other hospitals, excluding hospital units of other institutions (e.g., prisons). Community hospitals include obstetrics and gynecology, otolaryngology, orthopedic, cancer, pediatric, public, and academic medical hospitals. Excluded for this analysis are long-term care facilities such as rehabilitation, psychiatric, and alcoholism and chemical dependency hospitals. However, if a patient received long-term care, rehabilitation, or treatment for psychiatric or chemical dependency conditions in a community hospital, the discharge record for that stay was included in the analysis. Unit of analysis The unit of analysis is the hospital discharge (i.e., the hospital stay), not a person or patient. This means that a person who is admitted to the hospital multiple times in 1 year will be counted each time as a separate discharge from the hospital. Costs and charges Total hospital charges were converted to costs using HCUP Cost-to-Charge Ratios based on hospital accounting reports from the Centers for Medicare & Medicaid Services (CMS). 10 Costs reflect the actual expenses incurred in the production of hospital services, such as wages, supplies, and utility costs; charges represent the amount a hospital billed for the case. For each hospital, a hospital-wide cost-to-charge ratio is used. Hospital charges reflect the amount the hospital billed for the entire hospital stay and do not include professional (physician) fees. For the purposes of this Statistical Brief, costs are reported to the nearest hundred. How HCUP estimates of costs differ from National Health Expenditure Accounts There are a number of differences between the costs cited in this Statistical Brief and spending as measured in the National Health Expenditure Accounts (NHEA), which are produced annually by CMS.11 The largest source of difference comes from the HCUP coverage of inpatient treatment only in contrast to the NHEA inclusion of outpatient costs associated with emergency departments and other hospital-based outpatient clinics and departments as well. The outpatient portion of hospitals' activities has been growing steadily and may exceed half of all hospital revenue in recent years. On the basis of the AHA Annual Survey, 2012 outpatient gross revenues (or charges) were about 44 percent of total hospital gross revenues.12 Smaller sources of differences come from the inclusion in the NHEA of hospitals that are excluded from HCUP. These include Federal hospitals (Department of Defense, Veterans Administration, Indian Health Services, and Department of Justice [prison] hospitals) as well as psychiatric, substance abuse, and long-term care hospitals. A third source of difference lies in the HCUP reliance on billed charges from hospitals to payers, adjusted to provide estimates of costs using hospital-wide cost-to-charge ratios, in contrast to the NHEA measurement of spending or revenue. HCUP costs estimate the amount of money required to produce hospital services, including expenses for wages, salaries, and benefits paid to staff as well as utilities, maintenance, and other similar expenses required to run a hospital. NHEA spending or revenue measures the amount of income received by the hospital for treatment and other services provided, including payments by insurers, patients, or government programs. The difference between revenues and costs include profit for for-profit hospitals or surpluses for nonprofit hospitals. Payer Payer is the expected payer for the hospital stay. To make coding uniform across all HCUP data sources, payer combines detailed categories into general groups:
For this Statistical Brief, hospital stays were limited to those with an expected primary payer of Medicare. Discharges were identified as MA or Medicare FFS based on the expected primary payer as received from the State data source. The coding of managed care in HCUP data varies by State. Discharges with expected primary payer descriptions of Medicare HMO, Medicare PPO, Medicare POS, Medicare managed care, or Medicare Advantage were categorized as MA. All other Medicare discharges were categorized as Medicare FFS. Potentially preventable hospitalizations The Agency for Healthcare Research and Quality (AHRQ) Prevention Quality Indicators (PQIs) were used to develop estimates of the number of potentially preventable hospitalizations. The PQIs (version 4.5), a component of the AHRQ Quality Indicators (QIs), are a set of measures that can be used with hospital inpatient discharge data to identify access to and quality of care for "ambulatory care-sensitive conditions." These are conditions for which good outpatient care can potentially prevent the need for hospitalization or for which early intervention can prevent complications or more severe disease. Conditions included in the overall potentially preventable hospitalizations indicator (PQI #90) reported in this Statistical Brief are dehydration, bacterial pneumonia, urinary tract infection, diabetes with short-term complications, diabetes with long-term complications, uncontrolled diabetes without complications, diabetes with lower extremity amputation, chronic obstructive pulmonary disease, asthma, hypertension, heart failure, and angina without a cardiac procedure. PQI rates also can be affected by other factors such as disease prevalence. The PQIs are adjusted for age and sex. Further information on the AHRQ QIs, including documentation and free software downloads, is available at http://www.qualityindicators.ahrq.gov/. Additional information on how the QI software was applied to the HCUP data for the statistics reported in this Statistical Brief is available in Coffey et al., 2012.13 Resource intensive diagnosis-related groups (DRGs) In this Statistical Brief, resource intensive DRGs are defined as the 18 MS-DRG conditions and procedures with the highest proportion of intensive care unit (ICU) utilization based on a previous analysis of HCUP SID for 29 states in 2011.14 These MS-DRGs are presented in Table 5. |
Table 5. MS-DRG conditions and procedures with the highest proportion of ICU utilization |
| MS-DRG condition or procedure |
| 64 Intracranial hemorrhage or cerebral infarction with MCC |
| 65 Intracranial hemorrhage or cerebral infarction with CC |
| 189 Pulmonary edema and respiratory failure |
| 193 Simple pneumonia and pleurisy with MCC |
| 208 Respiratory system diagnosis with ventilator support less than 96 hours |
| 247 Percutaneous cardiovascular procedure with drug-eluting stent without MCC |
| 280 Acute myocardial infarction, discharged alive with MCC |
| 287 Circulatory disorders except AMI, with cardiac catheterization without MCC |
| 291 Heart failure and shock with MCC |
| 292 Heart failure and shock with CC |
| 309 Cardiac arrhythmia and conduction disorders with CC |
| 310 Cardiac arrhythmia and conduction disorders without CC/MCC |
| 313 Chest pain |
| 378 Gastrointestinal hemorrhage with CC |
| 638 Diabetes with CC |
| 682 Renal failure with MCC |
| 871 Septicemia or severe sepsis without mechanical ventilation 96+ hours with MCC |
| 918 Poisoning and toxic effects of drugs without MCC |
| Abbreviations: AMI, acute myocardial infarction; CC, chronic condition; MCC, multiple chronic conditions |
Hospital characteristics Hospital characteristics obtained from the AHA Annual Survey of Hospitals data were status as a teaching hospital, bed size, ownership, and type of hospital system. A teaching hospital is defined as having a residency program approved by the American Medical Association, being a member of the Council of Teaching Hospitals, or having a ratio of full-time equivalent interns and residents to beds of 0.25 or higher. Type of hospital system is based on responses to AHA Annual Survey of Hospitals questions related to health system membership and degree of centralization in hospital services, physician arrangements, and insurance product development. The AHA derives type of hospital system from a binary variable for system membership and the AHA system cluster variable shown in Table 6, which uses multiple AHA survey responses and factor analysis to classify hospitals into one of six categories on the basis of differentiation, centralization, and integration.15 System is defined by AHA as either a multihospital or a diversified single hospital system. A multihospital system is two or more hospitals owned, leased, sponsored, or contract managed by a central organization. Single, freestanding hospitals may be categorized as a system by bringing into membership three or more, and at least 25 percent, of their owned or leased nonhospital preacute or postacute organizations. For this Statistical Brief, the AHA cluster values 1 and 2 are collapsed into one group and called centralized systems. |
Table 6. American Hospital Association health system cluster descriptions16 |
||
| Cluster code | Label | Description |
| 1 | Centralized health system | A delivery system in which the system centrally organizes individual hospital service delivery, physician arrangements, and insurance product development. The number of different products/services that are offered across the system is moderate. |
| 2 | Centralized physician/insurance health system | A delivery system with highly centralized physician arrangements and insurance product development. Within this group, hospital services are relatively decentralized, with individual hospitals having discretion over the array of services they offer. The number of different products/services that are offered across the system is moderate. |
| 3 | Moderately centralized health system | A delivery system that is distinguished by the presence of both centralized and decentralized activity for hospital services, physician arrangements, and insurance product development. For example, a system within this group may have centralized care of expensive, high-technology services, such as open heart surgery, but allow individual hospitals to provide an array of other health services based on local needs. The number of different products and services that are offered across the system is moderate. |
| 4 | Decentralized health system | A delivery system with a high degree of decentralization of hospital services, physician arrangements, and insurance product development. Within this group, systems may lack an overarching structure for coordination. Service and product differentiation is high, which may explain why centralization is hard to achieve. In this group, the system may simply serve a role in sharing information and providing administrative support to highly developed local delivery systems centered around hospitals. |
| 5 | Independent hospital system | A delivery system with limited differentiation of hospital services, physician arrangements, and insurance product development. These systems are largely horizontal affiliations of autonomous hospitals. |
| 6 | Blank | Sufficient data from the FY 2012 Annual Survey were not available to determine a cluster assignment. |
About HCUP The Healthcare Cost and Utilization Project (HCUP, pronounced "H-Cup") is a family of databases and related software tools and products developed through a Federal-State-Industry partnership and sponsored by the Agency for Healthcare Research and Quality (AHRQ). HCUP databases bring together the data collection efforts of State data organizations, hospital associations, and private data organizations (HCUP Partners) and the Federal government to create a national information resource of encounter-level data. HCUP includes the largest collection of longitudinal hospital care data in the United States, with all-payer, encounter-level information beginning in 1988. These databases enable research on a broad range of health policy issues, including cost and quality of health services, medical practice patterns, access to programs, and outcomes of treatments at the national, State, and local market levels. HCUP would not be possible without the contributions of the following data collection Partners from across the United States: Alaska State Hospital and Nursing Home Association Arizona Department of Health Services Arkansas Department of Health California Office of Statewide Health Planning and Development Colorado Hospital Association Connecticut Hospital Association District of Columbia Hospital Association Florida Agency for Health Care Administration Georgia Hospital Association Hawaii Health Information Corporation Illinois Department of Public Health Indiana Hospital Association Iowa Hospital Association Kansas Hospital Association Kentucky Cabinet for Health and Family Services Louisiana Department of Health and Hospitals Maine Health Data Organization Maryland Health Services Cost Review Commission Massachusetts Center for Health Information and Analysis Michigan Health & Hospital Association Minnesota Hospital Association Mississippi Department of Health Missouri Hospital Industry Data Institute Montana MHA - An Association of Montana Health Care Providers Nebraska Hospital Association Nevada Department of Health and Human Services New Hampshire Department of Health & Human Services New Jersey Department of Health New Mexico Department of Health New York State Department of Health North Carolina Department of Health and Human Services North Dakota (data provided by the Minnesota Hospital Association) Ohio Hospital Association Oklahoma State Department of Health Oregon Association of Hospitals and Health Systems Oregon Office of Health Analytics Pennsylvania Health Care Cost Containment Council Rhode Island Department of Health South Carolina Revnue and Fiscal Affairs Office South Dakota Association of Healthcare Organizations Tennessee Hospital Association Texas Department of State Health Services Utah Department of Health Vermont Association of Hospitals and Health Systems Virginia Health Information Washington State Department of Health West Virginia Health Care Authority Wisconsin Department of Health Services Wyoming Hospital Association About Statistical Briefs HCUP Statistical Briefs are descriptive summary reports presenting statistics on hospital inpatient and emergency department use and costs, quality of care, access to care, medical conditions, procedures, patient populations, and other topics. The reports use HCUP administrative data. About the SID The HCUP State Inpatient Databases (SID) are hospital inpatient databases from data organizations participating in HCUP. The SID contain the universe of the inpatient discharge abstracts in the participating HCUP States, translated into a uniform format to facilitate multistate comparisons and analyses. Together, the SID encompass more than 95 percent of all U.S. community hospital discharges. The SID can be used to investigate questions unique to one State, to compare data from two or more States, to conduct market-area variation analyses, and to identify State-specific trends in inpatient care utilization, access, charges, and outcomes. For More Information For more information about HCUP, visit http://www.hcup-us.ahrq.gov/. For additional HCUP statistics, visit HCUPnet, our interactive query system, at https://datatools.ahrq.gov/hcupnet. For information on other hospitalizations in the United States, refer to the following HCUP Statistical Briefs located at http://www.hcup-us.ahrq.gov/reports/statbriefs/statbriefs.jsp:
Agency for Healthcare Research and Quality. Overview of the State Inpatient Databases (SID). Healthcare Cost and Utilization Project (HCUP). Rockville, MD: Agency for Healthcare Research and Quality. Updated November 2014. http://www.hcup-us.ahrq.gov/sidoverview.jsp. Accessed January 7, 2015. Suggested Citation Raetzman SO (Truven Health Analytics), Hines AL (Johns Hopkins School of Medicine), Barrett ML (M.L. Barrett, Inc.), Karaca Z (AHRQ). Hospital Stays in Medicare Advantage Plans Versus the Traditional Medicare Fee-for-Service Program, 2013. HCUP Statistical Brief #198. December 2015. Agency for Healthcare Research and Quality, Rockville, MD. http://www.hcup-us.ahrq.gov/reports/statbriefs/sb198-Hospital-Stays-Medicare-Advantage-Versus-Traditional-Medicare.pdf. Acknowledgments The authors would like to acknowledge the contributions of Minya Sheng, Katie Whitley, and Lucy Karnell of Truven Health Analytics. *** AHRQ welcomes questions and comments from readers of this publication who are interested in obtaining more information about access, cost, use, financing, and quality of in the United States. We also invite you to tell us how you are using this Statistical Brief and other HCUP data and tools, and to share suggestions on how HCUP products might be enhanced to further meet your needs. Please e-mail us at hcup@ahrq.gov or send a letter to the address below:Virginia Mackay-Smith, Acting Director Center for Delivery, Organization, and Markets Agency for Healthcare Research and Quality 5600 Fishers Lane Rockville, MD 20857 1 When used in this brief, FFS refers to the traditional Medicare fee-for-service program and not the private fee-for-service plans that are offered under the Medicare Advantage program. 2 Medicare Payment Advisory Commission. Report to the Congress: Medicare Payment Policy. Washington, DC: Medicare Payment Advisory Commission; March 2015, 315 http://medpac.gov/docs/default-source/reports/mar2015_entirereport_revised.pdf?sfvrsn=0. Accessed April 18, 2018. 3 Ibid., 14. 4 Ibid., 330. 5 Ibid., 321. 6 Ibid., 315. 7 Medicare Payment Advisory Commission. Report to Congress: Medicare Payment Policy. Washington, DC: Medicare Payment Advisory Commission; March 2015, 21. http://medpac.gov/docs/default-source/reports/mar2015_entirereport_revised.pdf?sfvrsn=0. Accessed November 8, 2017. 8 Afendulis CC, Chernew ME, Kessler DP. The Effect of Medicare Advantage on Hospital Admissions and Mortality. Working Paper 19101. Cambridge, MA: National Bureau of Economic Research; June 2013. 9 Agency for Healthcare Research and Quality. HCUP Clinical Classifications Software (CCS). Healthcare Cost and Utilization Project (HCUP). Rockville, MD: Agency for Healthcare Research and Quality. Updated November 2014. http://www.hcup-us.ahrq.gov/toolssoftware/ccs/ccs.jsp. Accessed January 7, 2015. 10 Agency for Healthcare Research and Quality. HCUP Cost-to-Charge Ratio (CCR) Files. Healthcare Cost and Utilization Project (HCUP). 2001-2012. Rockville, MD: Agency for Healthcare Research and Quality. Updated December 2014. https://www.hcup-us.ahrq.gov/db/state/costtocharge.jsp. Accessed January 7, 2015. 11 For additional information about the NHEA, see Centers for Medicare & Medicaid Services (CMS). National Health Expenditure Data. CMS website May 2014. http://www.cms.gov/Research-Statistics-Data-and-Systems/Statistics-Trends-and-Reports/NationalHealthExpendData/index.html?redirect=/NationalHealthExpendData/. Accessed January 7, 2015. 12 American Hospital Association. TrendWatch Chartbook, 2014. Table 4.2. Distribution of Inpatient vs. Outpatient Revenues, 1992-2012. Original source is no longer available on the Web; for related information refer to TrendWatch Chartbook, 2018. Table 4.2. Distribution of Inpatient vs. Outpatient Revenues, 1995-2016. www.aha.org/system/files/2018-05/2018-chartbook-table-4-2.pdf. 13 Coffey R, Barrett M, Houchens R, Moy E, Andrews R, Coenen N. Methods Applying AHRQ Quality Indicators to Healthcare Cost and Utilization Project (HCUP) Data for the Eleventh (2013) National Healthcare Quality Report (NHQR) and National Healthcare Disparities Report (NHDR). HCUP Methods Series Report #2012-03. Online. November 12, 2012. U.S. Agency for Healthcare Research and Quality. http://www.hcup-us.ahrq.gov/reports/methods/2012_03.pdf. Accessed January 7, 2015. 14 Barrett ML, Smith MW, Elixhauser A, Honigman LS, Pines JM. Utilization of Intensive Care Services, 2011. HCUP Statistical Brief #185. December 2014. Agency for Healthcare Research and Quality, Rockville, MD. http://www.hcup-us.ahrq.gov/reports/statbriefs/sb185-Hospital-Intensive-Care-Units-2011.pdf. Accessed May 16, 2015. 15 Bazzoli GJ, Shortell SM, Dubbs N, Chan C, Kralovec P. A taxonomy of health networks and systems: bringing order out of chaos. Health Services Research. 1999;33(6):1683-717. 16 American Hospital Association. AHA Annual Survey Database Fiscal Year 2012. http://www.ahadataviewer.com/book-cd-products/AHA-Survey/. |
| Internet Citation: Statistical Brief #198. Healthcare Cost and Utilization Project (HCUP). April 2018. Agency for Healthcare Research and Quality, Rockville, MD. hcup-us.ahrq.gov/reports/statbriefs/sb198-Hospital-Stays-Medicare-Advantage-Versus-Traditional-Medicare.jsp. |
| Are you having problems viewing or printing pages on this website? |
| If you have comments, suggestions, and/or questions, please contact hcup@ahrq.gov. |
| If you are experiencing issues related to Section 508 accessibility of information on this website, please contact hcup@ahrq.gov. |
| Privacy Notice, Viewers & Players |
| Last modified 4/18/18 |