STATISTICAL BRIEF #194 |
July 2015
Anika L. Hines, Ph.D., M.P.H., Kevin C. Heslin, Ph.D., H. Joanna Jiang, Ph.D., and Rosanna Coffey, Ph.D. Introduction Monitoring and improving healthcare quality in the United States is a key priority for health policymakers, payers, providers, and patient advocates. Hospital inpatient mortality is one quality measure that can reflect both improvements in healthcare and shifts in where end-of-life care takes place over time. Previous trends in inpatient mortality suggest that rates have been decreasing for high-volume conditions, such as acute myocardial infarction (AMI), congestive heart failure (CHF), stroke, and pneumonia.1,2 These declines in mortality vary not only by condition but also by patient and hospital characteristics. Continued study of these trends can help researchers and policymakers assess the impact of healthcare quality efforts. Further, examining trends across patient and hospital subgroups may inform strategies for addressing disparities in healthcare quality by identifying groups that are leading and lagging in improvement. This Healthcare Cost and Utilization Project (HCUP) Statistical Brief examines trends in observed inpatient mortality rates for AMI, CHF, stroke, and pneumonia for adults aged 18 years and older, as well as changes in these rates for select patient subgroups. Death following discharge from a hospital is not reflected in these data. Observed trends in inpatient mortality from 2002 to 2012 are presented. Percentage changes between 2002 and 2012 are compared by age, sex, expected primary payer, community income level, urban or rural location of patient residence, and hospital region. All differences between estimates noted in the text are statistically significant at the .01 level or better. Findings Inpatient mortality rate trends for four high-volume conditions, 2002-2012 Figure 1 presents observed inpatient mortality rates among adults aged 18 years and older for AMI, CHF, stroke, and pneumonia from 2002 through 2012. The average annual percentage decrease displayed is that by which the rate decreased per year on average during this period. |
|
|
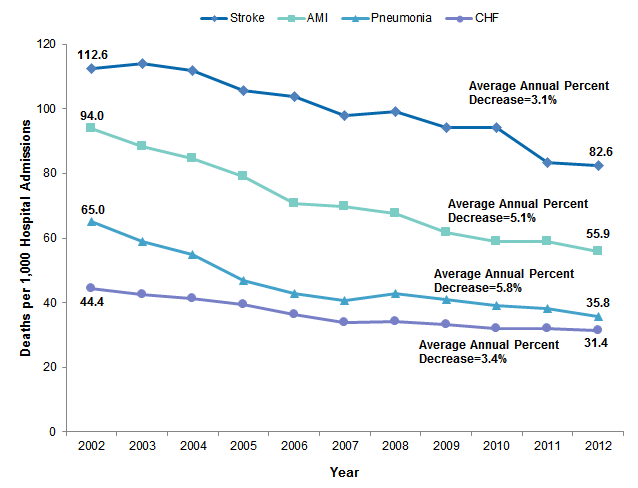
Figure 1. Trends in observed inpatient mortality rate per 1,000 hospital admissions for four high-volume conditions, 2002-2012
Abbreviations: AMI, acute myocardial infarction; CHF, congestive heart failure Figure 1 is a line graph that shows the number of deaths per 1,000 hospital admissions for acute myocardial infarction, congestive heart failure, stroke, and pneumonia for 2002-2012. Deaths per 1,000 hospital admissions for stroke were 112.6 in 2002, 114.0 in 2003, 111.8 in 2004, 105.7 in 2005, 104.0 in 2006, 97.9 in 2007, 99.2 in 2008, 94.1 in 2009, 94.2 in 2010, 83.4 in 2011, and 82.6 in 2012, for an average annual percentage decrease of 3.1%. Deaths per 1,000 hospital admissions for acute myocardial infarction were 94.0 in 2002, 88.4 in 2003, 84.6 in 2004, 78.9 in 2005, 70.7 in 2006, 69.9 in 2007, 67.6 in 2008, 61.7 in 2009, 59.0 in 2010, 58.8 in 2011, and 55.9 in 2012, for an average annual percentage decrease of 5.1%. Deaths per 1,000 hospital admissions for pneumonia were 65.0 in 2002, 58.9 in 2003, 54.9 in 2004, 46.7 in 2005, 42.9 in 2006, 40.8 in 2007, 42.7 in 2008, 41.0 in 2009, 39.2 in 2010, 38.1 in 2011, and 35.8 in 2012, for an average annual percentage decrease of 5.8%. Deaths per 1,000 hospital admissions for congestive heart failure were 44.4 in 2002, 42.5 in 2003, 41.3 in 2004, 39.5 in 2005, 36.5 in 2006, 33.8 in 2007, 34.2 in 2008, 33.3 in 2009, 31.9 in 2010, 32.0 in 2011, and 31.4 in 2012, for an average annual percentage decrease of 3.4%.
|
Inpatient mortality rates for four high-volume conditions by patient and hospital characteristics, 2002 and 2012 Table 1 presents observed inpatient mortality rates among adults aged 18 years and older for AMI, CHF, stroke, and pneumonia by patient and hospital characteristics in 2002 and 2012. |
| Table 1. Observed inpatient mortality rate per 1,000 hospital admissions for four high-volume conditions by subgroup, 2002 and 2012 | |||||||||
| Subgroup | Acute myocardial infarction | Congestive heart failure | Stroke | Pneumonia | |||||
|---|---|---|---|---|---|---|---|---|---|
| 2002 | 2012 | 2002 | 2012 | 2002 | 2012 | 2002 | 2012 | ||
| Overall total | 94.0 | 55.9 | 44.4 | 31.4 | 112.6 | 82.6 | 65.0 | 35.8 | |
| Patient characteristics | |||||||||
| Age group, years | 18-64 | 37.0 | 27.3 | 21.1 | 15.7 | 94.7 | 66.5 | 30.0 | 16.4 |
| 65+ | 129.6 | 77.6 | 51.9 | 37.3 | 119.4 | 90.8 | 81.4 | 46.7 | |
| Sex | Male | 79.2 | 49.9 | 46.8 | 32.1 | 110.7 | 76.1 | 70.6 | 37.7 |
| Female | 114.6 | 65.3 | 42.5 | 30.7 | 114.1 | 88.7 | 60.0 | 34.2 | |
| Hospital characteristics | |||||||||
| Hospital region | Northeast | 98.6 | 61.8 | 51.1 | 35.0 | 118.7 | 87.4 | 77.2 | 37.1 |
| Midwest | 95.4 | 51.1 | 40.4 | 27.4 | 107.7 | 79.8 | 55.4 | 31.7 | |
| South | 91.5 | 54.6 | 43.2 | 31.1 | 111.4 | 78.7 | 64.8 | 37.4 | |
| West | 91.9 | 59.0 | 44.6 | 33.4 | 115.0 | 89.3 | 66.0 | 36.5 | |
| Source: Agency for Healthcare Research and Quality (AHRQ), Center for Delivery, Organization, and Markets, Healthcare Cost and Utilization Project (HCUP), Nationwide Inpatient Sample (NIS), 2002, and State Inpatient Databases (SID), 2012, weighted to provide national estimates using the same methodology as the 2002 NIS; and the AHRQ Quality Indicators, version 4.4 | |||||||||
|
|
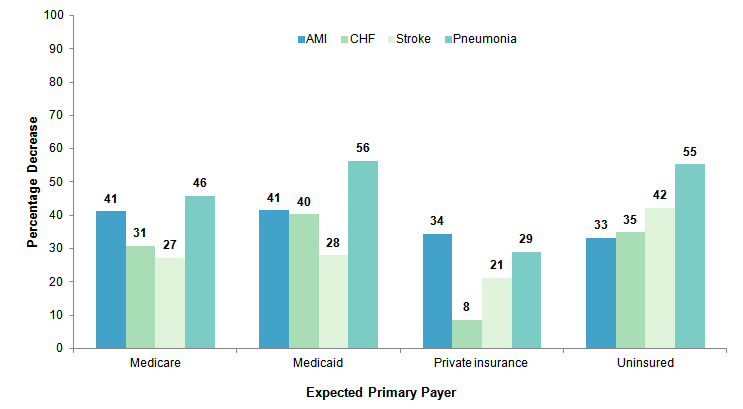
Figure 2. Percentage decrease in observed inpatient mortality rate per 1,000 hospital admissions for four high-volume conditions by expected primary payer, 2002-2012
Abbreviations: AMI, acute myocardial infarction; CHF, congestive heart failure Figure 2 is a bar chart that shows the percentage decrease in observed inpatient mortality rate per 1,000 hospital admissions for acute myocardial infarction, congestive heart failure, stroke, and pneumonia between 2002 and 2012 by expected primary payer. The percentage decrease in observed inpatient mortality rate per 1,000 hospital admissions covered by Medicare was 41% for acute myocardial infarction, 31% for congestive heart failure, 27% for stroke, and 46% for pneumonia. The percentage decrease in observed inpatient mortality rate per 1,000 hospital admissions covered by Medicaid was 41% for acute myocardial infarction, 40% for congestive heart failure, 28% for stroke, and 56% for pneumonia. The percentage decrease in observed inpatient mortality rate per 1,000 hospital admissions covered by private insurance was 34% for acute myocardial infarction, 8% for congestive heart failure, 21% for stroke, and 29% for pneumonia. The percentage decrease in observed inpatient mortality rate per 1,000 hospital admissions that were uninsured was 33% for acute myocardial infarction, 35% for congestive heart failure, 42% for stroke, and 55% for pneumonia. |
|
| Table 2. Observed inpatient mortality rate per 1,000 hospital admissions for four high-volume conditions by expected primary payer, 2002 and 2012 | ||||||||
| Expected primary payer | Acute myocardial infarction | Congestive heart failure | Stroke | Pneumonia | ||||
|---|---|---|---|---|---|---|---|---|
| 2002 | 2012 | 2002 | 2012 | 2002 | 2012 | 2002 | 2012 | |
| Medicare | 126.4 | 74.4 | 48.6 | 33.6 | 115.6 | 84.2 | 77.0 | 41.7 |
| Medicaid | 68.1 | 39.8 | 25.1 | 15.0 | 109.7 | 79.1 | 37.0 | 16.1 |
| Private insurance | 39.3 | 25.8 | 33.0 | 30.2 | 94.0 | 74.2 | 38.1 | 27.0 |
| Uninsured | 52.8 | 35.3 | 20.9 | 13.6 | 144.4 | 83.4 | 27.9 | 12.5 |
| Source: Agency for Healthcare Research and Quality (AHRQ), Center for Delivery, Organization, and Markets, Healthcare Cost and Utilization Project (HCUP), Nationwide Inpatient Sample (NIS), 2002, and State Inpatient Databases (SID), 2012, weighted to provide national estimates using the same methodology as the 2002 NIS; and the AHRQ Quality Indicators, version 4.4 | ||||||||
|
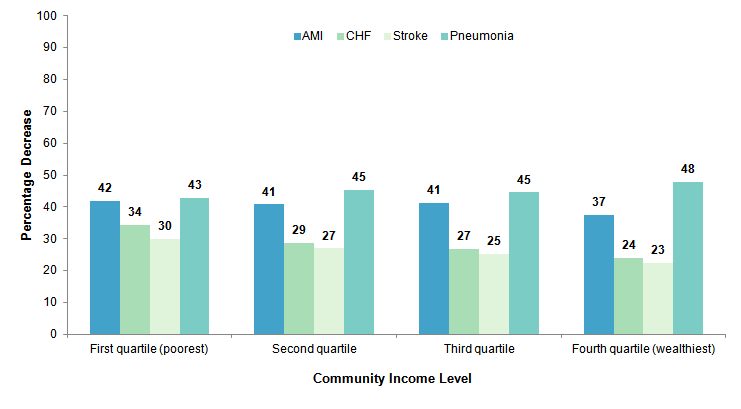
Figure 3. Percentage decrease in observed inpatient mortality rate per 1,000 hospital admissions for selected high-volume conditions by community-level income, 2002-2012
Abbreviations: AMI, acute myocardial infarction; CHF, congestive heart failure Figure 3 is a bar chart that shows the percentage decrease in observed inpatient mortality rate per 1,000 hospital admissions for acute myocardial infarction, congestive heart failure, stroke, and pneumonia by community-level income between 2002 and 2012. The percentage decrease in observed inpatient mortality rate per 1,000 hospital admissions for patients in the first, or poorest, quartile was 42% for acute myocardial infarction, 34% for congestive heart failure, 30% for stroke, and 43% for pneumonia. The percentage decrease in observed inpatient mortality rate per 1,000 hospital admissions for patients in the second quartile was 41% for acute myocardial infarction, 29% for congestive heart failure, 27% for stroke, and 45% for pneumonia. The percentage decrease in observed inpatient mortality rate per 1,000 hospital admissions for patients in the third quartile was 41% for acute myocardial infarction, 27% for congestive heart failure, 25% for stroke, and 45% for pneumonia. The percentage decrease in observed inpatient mortality rate per 1,000 hospital admissions for patients in the fourth, or wealthiest, quartile was 37% for acute myocardial infarction, 24% for congestive heart failure, 23% for stroke, and 48% for pneumonia.
|
|
| Table 3. Observed inpatient mortality rate per 1,000 hospital admissions for four high-volume conditions by community income level, 2002 and 2012 | ||||||||
| Community income level | Acute myocardial infarction | Congestive heart failure | Stroke | Pneumonia | ||||
|---|---|---|---|---|---|---|---|---|
| 2002 | 2012 | 2002 | 2012 | 2002 | 2012 | 2002 | 2012 | |
| First quartile (poorest) | 99.4 | 57.7 | 41.6 | 27.3 | 114.3 | 80.0 | 61.6 | 35.3 |
| Second quartile | 96.2 | 56.9 | 43.7 | 31.2 | 111.4 | 81.3 | 63.6 | 34.7 |
| Third quartile | 91.6 | 53.7 | 46.5 | 34.0 | 112.7 | 84.3 | 65.7 | 36.4 |
| Fourth quartile (wealthiest) | 86.5 | 54.0 | 48.3 | 36.7 | 111.3 | 86.2 | 73.0 | 37.9 |
| Source: Agency for Healthcare Research and Quality (AHRQ), Center for Delivery, Organization, and Markets, Healthcare Cost and Utilization Project (HCUP), Nationwide Inpatient Sample (NIS), 2002, and State Inpatient Databases (SID), 2012, weighted to provide national estimates using the same methodology as the 2002 NIS; and the AHRQ Quality Indicators, version 4.4 | ||||||||
|
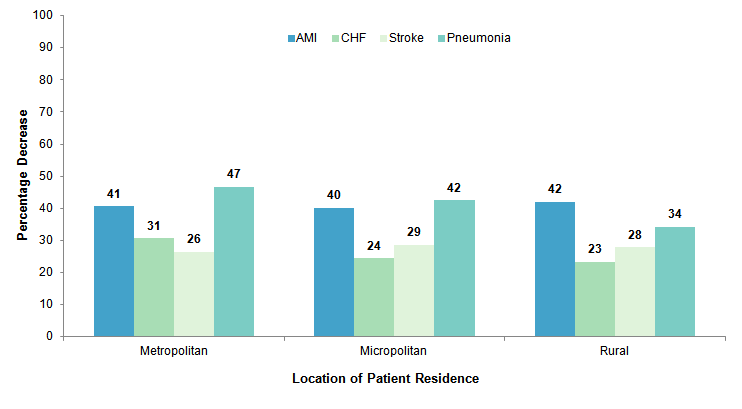
Figure 4. Percentage decrease in observed inpatient mortality rate per 1,000 hospital admissions for four high-volume conditions by location of patient residence, 2002-2012
Abbreviations: AMI, acute myocardial infarction; CHF, congestive heart failure Figure 4 is a bar chart that shows the percentage decrease in observed inpatient mortality rate per 1,000 hospital admissions for acute myocardial infarction, congestive heart failure, stroke, and pneumonia by location of patient residence between 2002 and 2012. The percentage decrease in observed inpatient mortality rate per 1,000 hospital admissions for patients residing in metropolitan areas was 41% for acute myocardial infarction, 31% for congestive heart failure, 26% for stroke, and 47% for pneumonia. The percentage decrease in observed inpatient mortality rate per 1,000 hospital admissions for patients residing in micropolitan areas was 40% for acute myocardial infarction, 24% for congestive heart failure, 29% for stroke, and 42% for pneumonia. The percentage decrease in observed inpatient mortality rate per 1,000 hospital admissions for patients residing in rural areas was 42% for acute myocardial infarction, 23% for congestive heart failure, 28% for stroke, and 34% for pneumonia.
|
|
| Table 4. Observed inpatient mortality rate per 1,000 hospital admissions for four high-volume conditions by location of patient residence, 2002 and 2012 | ||||||||
| Location of patient residence | Acute myocardial infarction | Congestive heart failure | Stroke | Pneumonia | ||||
|---|---|---|---|---|---|---|---|---|
| 2002 | 2012 | 2002 | 2012 | 2002 | 2012 | 2002 | 2012 | |
| Metropolitan | 93.2 | 55.4 | 44.3 | 30.8 | 110.9 | 81.8 | 66.5 | 35.4 |
| Micropolitan | 96.2 | 57.7 | 44.3 | 33.5 | 118.2 | 84.4 | 63.7 | 36.7 |
| Rural | 98.6 | 57.1 | 45.4 | 34.8 | 122.7 | 88.6 | 56.6 | 37.2 |
| Source: Agency for Healthcare Research and Quality (AHRQ), Center for Delivery, Organization, and Markets, Healthcare Cost and Utilization Project (HCUP), Nationwide Inpatient Sample (NIS), 2002, and State Inpatient Databases (SID), 2012, weighted to provide national estimates using the same methodology as the 2002 NIS; and the AHRQ Quality Indicators, version 4.4 | ||||||||
Data Source
The estimates in this Statistical Brief are based upon data from the Healthcare Cost and Utilization Project (HCUP) 2002-2011 Nationwide Inpatient Sample (NIS). For data year 2012, we used an analysis file derived from the HCUP State Inpatient Databases (SID) that was designed to provide national estimates using weighted records from a sample of hospitals from 44 States using the same methodology employed for the 2002-2011 NIS. We did not use the 2012 NIS because the sampling design and universe definition was revised. At the time of this analysis, NIS trend weights for making national estimates compatible between 2002-2011 and 2012 were unavailable. Numerous hypothesis tests were conducted for this Statistical Brief. Thus, to decrease the number of false-positive results, we reduced the significance to .01 for individual tests. Definitions Case definition The study population of adults aged 18 years and older who were hospitalized for AMI, CHF, stroke, and pneumonia was defined using the AHRQ Inpatient Quality Indicator definitions for these conditions (http://www.qualityindicators.ahrq.gov/Modules/iqi_resources.aspx). Mortality rates for these conditions reflect deaths that occurred while a patient was in a hospital and do not reflect any postdischarge deaths. Types of hospitals included in the HCUP Nationwide (National) Inpatient Sample The National (Nationwide) Inpatient Sample (NIS) is based on data from community hospitals, which are defined as short-term, non-Federal, general, and other hospitals, excluding hospital units of other institutions (e.g., prisons). The NIS includes obstetrics and gynecology, otolaryngology, orthopedic, cancer, pediatric, public, and academic medical hospitals. Excluded are long-term care facilities such as rehabilitation, psychiatric, and alcoholism and chemical dependency hospitals. Beginning in 2012, long-term acute care hospitals are also excluded. However, if a patient received long-term care, rehabilitation, or treatment for psychiatric or chemical dependency conditions in a community hospital, the discharge record for that stay will be included in the NIS. Types of hospitals included in HCUP State Inpatient Databases This analysis used State Inpatient Databases (SID) limited to data from community hospitals, which are defined as short-term, non-Federal, general, and other hospitals, excluding hospital units of other institutions (e.g., prisons). Community hospitals include obstetrics and gynecology, otolaryngology, orthopedic, cancer, pediatric, public, and academic medical hospitals. Excluded for this analysis are long-term care facilities such as rehabilitation, psychiatric, and alcoholism and chemical dependency hospitals. However, if a patient received long-term care, rehabilitation, or treatment for psychiatric or chemical dependency conditions in a community hospital, the discharge record for that stay was included in the analysis. Unit of analysis The unit of analysis is the hospital discharge (i.e., the hospital stay), not a person or patient. This means that a person who is admitted to the hospital multiple times in 1 year will be counted each time as a separate discharge from the hospital. Average annual percentage change Average annual percentage change was calculated using the following formula:
Place of residence is based on the urban-rural classification scheme for U.S. counties developed by the National Center for Health Statistics (NCHS):
Median community-level income Median community-level income is the median household income of the patient's ZIP Code of residence. The cut-offs for the quartile designation are determined using ZIP Code demographic data obtained from the Nielsen Company. The income quartile is missing for patients who are homeless or foreign. Payer Payer is the expected primary payer for the hospital stay. To make coding uniform across all HCUP data sources, payer combines detailed categories into general groups:
When more than one payer is listed for a hospital discharge, the first-listed payer is used. Region Region is one of the four regions defined by the U.S. Census Bureau:
About HCUP The Healthcare Cost and Utilization Project (HCUP, pronounced "H-Cup") is a family of healthcare databases and related software tools and products developed through a Federal-State-Industry partnership and sponsored by the Agency for Healthcare Research and Quality (AHRQ). HCUP databases bring together the data collection efforts of State data organizations, hospital associations, and private data organizations (HCUP Partners) and the Federal government to create a national information resource of encounter-level healthcare data. HCUP includes the largest collection of longitudinal hospital care data in the United States, with all-payer, encounter-level information beginning in 1988. These databases enable research on a broad range of health policy issues, including cost and quality of health services, medical practice patterns, access to healthcare programs, and outcomes of treatments at the national, State, and local market levels. HCUP would not be possible without the contributions of the following data collection Partners from across the United States: Alaska State Hospital and Nursing Home Association Arizona Department of Health Services Arkansas Department of Health California Office of Statewide Health Planning and Development Colorado Hospital Association Connecticut Hospital Association District of Columbia Hospital Association Florida Agency for Health Care Administration Georgia Hospital Association Hawaii Health Information Corporation Illinois Department of Public Health Indiana Hospital Association Iowa Hospital Association Kansas Hospital Association Kentucky Cabinet for Health and Family Services Louisiana Department of Health and Hospitals Maine Health Data Organization Maryland Health Services Cost Review Commission Massachusetts Center for Health Information and Analysis Michigan Health & Hospital Association Minnesota Hospital Association Mississippi Department of Health Missouri Hospital Industry Data Institute Montana MHA - An Association of Montana Health Care Providers Nebraska Hospital Association Nevada Department of Health and Human Services New Hampshire Department of Health & Human Services New Jersey Department of Health New Mexico Department of Health New York State Department of Health North Carolina Department of Health and Human Services North Dakota (data provided by the Minnesota Hospital Association) Ohio Hospital Association Oklahoma State Department of Health Oregon Association of Hospitals and Health Systems Oregon Office of Health Analytics Pennsylvania Health Care Cost Containment Council Rhode Island Department of Health South Carolina Revenue and Fiscal Affairs Office South Dakota Association of Healthcare Organizations Tennessee Hospital Association Texas Department of State Health Services Utah Department of Health Vermont Association of Hospitals and Health Systems Virginia Health Information Washington State Department of Health West Virginia Health Care Authority Wisconsin Department of Health Services Wyoming Hospital Association About Statistical Briefs HCUP Statistical Briefs are descriptive summary reports presenting statistics on hospital inpatient and emergency department use and costs, quality of care, access to care, medical conditions, procedures, patient populations, and other topics. The reports use HCUP administrative healthcare data. About the NIS The HCUP National (Nationwide) Inpatient Sample (NIS) is a national (nationwide) database of hospital inpatient stays. The NIS is nationally representative of all community hospitals (i.e., short-term, non-Federal, nonrehabilitation hospitals). The NIS includes all payers. It is drawn from a sampling frame that contains hospitals comprising more than 95 percent of all discharges in the United States. The vast size of the NIS allows the study of topics at the national and regional levels for specific subgroups of patients. In addition, NIS data are standardized across years to facilitate ease of use. Over time, the sampling frame for the NIS has changed; thus, the number of States contributing to the NIS varies from year to year. The NIS is intended for national estimates only; no State-level estimates can be produced. The 2012 NIS was redesigned to optimize national estimates. The redesign incorporates two critical changes:
The new sampling strategy is expected to result in more precise estimates than those that resulted from the previous NIS design by reducing sampling error: for many estimates, confidence intervals under the new design are about half the length of confidence intervals under the previous design. The change in sample design for 2012 necessitates recomputation of prior years' NIS data to enable analyses of trends that use the same definitions of discharges and hospitals. For More Information For more information about HCUP, visit http://www.hcup-us.ahrq.gov/. For additional HCUP statistics, visit HCUPnet, our interactive query system, at https://datatools.ahrq.gov/hcupnet. For information on other hospitalizations in the United States, refer to the following HCUP Statistical Briefs located at http://www.hcup-us.ahrq.gov/reports/statbriefs/statbriefs.jsp:
For a detailed description of HCUP and more information on the design of the National (Nationwide) Inpatient Sample (NIS) and State Inpatient Databases (SID), please refer to the following database documentation: Agency for Healthcare Research and Quality. Overview of the National (Nationwide) Inpatient Sample (NIS). Healthcare Cost and Utilization Project (HCUP). Rockville, MD: Agency for Healthcare Research and Quality. Updated November 2014. http://www.hcup-us.ahrq.gov/nisoverview.jsp. Accessed April 8, 2015. Agency for Healthcare Research and Quality. Overview of the State Inpatient Databases (SID). Healthcare Cost and Utilization Project (HCUP). Rockville, MD: Agency for Healthcare Research and Quality. Updated November 2014. http://www.hcup-us.ahrq.gov/sidoverview.jsp. Accessed January 7, 2015. Suggested Citation Hines AL (Truven Health Analytics), Heslin KC (AHRQ), Jiang HJ (AHRQ), Coffey R (Truven Health Analytics). Trends in Observed Adult Inpatient Mortality for High-Volume Conditions, 2002-2012. HCUP Statistical Brief #194. July 2015. Agency for Healthcare Research and Quality, Rockville, MD. http://www.hcup-us.ahrq.gov/reports/statbriefs/sb194-Inpatient-Mortality-High-Volume-Conditions.pdf. *** AHRQ welcomes questions and comments from readers of this publication who are interested in obtaining more information about access, cost, use, financing, and quality of healthcare in the United States. We also invite you to tell us how you are using this Statistical Brief and other HCUP data and tools, and to share suggestions on how HCUP products might be enhanced to further meet your needs. Please e-mail us at hcup@ahrq.gov or send a letter to the address below:Virginia Mackay-Smith, Acting Director Center for Delivery, Organization, and Markets Agency for Healthcare Research and Quality 540 Gaither Road Rockville, MD 20850 1 Hines A, Stranges E, Andrews RM. Trends in Hospital Risk-Adjusted Mortality for Select Diagnoses by Patient Subgroups, 2000-2007. HCUP Statistical Brief #98. October 2010. Agency for Healthcare Research and Quality, Rockville, MD. http://www.hcup-us.ahrq.gov/reports/statbriefs/sb98.pdf. Accessed February 17, 2015. 2 Stepanova M, Venkatesan C, Altaweel L, Mishra A, and Younossi ZM. Recent trends in inpatient mortality and resource utilization for patients with stroke in the United States: 2005-2009. Journal of Stroke and Cerebrovascular Disease. 2013;22(4):491—9. |