STATISTICAL BRIEF #193 |
July 2015
Kathryn R. Fingar, Ph.D., M.P.H., Carol Stocks, Ph.D., R.N., Audrey J. Weiss, Ph.D., and Pamela L. Owens, Ph.D. Introduction Substance abuse during pregnancy can have serious effects on the health of both mother and child. When newborns have been exposed to drugs in the womb, symptoms of withdrawal often occur within hours after birth and may include trouble feeding, seizures, sleep problems, and slow weight gain.1 In addition to these signs of withdrawal, drug use during pregnancy can increase the risk of birth defects, fetal growth restriction, low birth weight, premature birth, and abnormal neurodevelopment.2 Fetal alcohol syndrome due to alcohol use during pregnancy is associated with similar outcomes, including cognitive and functional disabilities.3 Neonatal (newborn) drug withdrawal has been attributed to the use of a variety of drugs during pregnancy. However, it is thought that many of these cases involve maternal use of prescription or illegal opiates, such as oxycodone, codeine, or heroin, which may cause withdrawal in over half of infants exposed prenatally.4 A recent study reported that neonatal drug withdrawal showed a substantial increase—from 1.2 per 1,000 births in 2000 to 3.4 per 1,000 births in 2009.5 This paralleled an overall 300 percent increase in sales of prescription painkillers in the general population.6 This Healthcare Cost and Utilization Project (HCUP) Statistical Brief used data from 38 States—those for which inpatient data were available each year between 2006 and 2012—to examine the prevalence and costs of newborn and maternal inpatient hospital stays associated with substance use, including abuse of prescription drugs or use of illicit drugs or alcohol. Neonatal stays related to substance use were categorized according to the type of substance or substance-related condition: neonatal drug withdrawal, fetal alcohol syndrome, hallucinogens, cocaine, or unspecified narcotics. Maternal stays related to substance use were categorized according to the following types of substances: opiates, cocaine, cannabis, alcohol, other specified substances, or unspecified drugs. Rates of each type of substance and substance-related condition among neonatal and maternal stays were examined over time. Patient and hospital characteristics for neonatal and maternal stays related to substance use in 2012 are presented compared with all other neonatal and maternal stays. Differences between substance-related stays and all other neonatal and maternal stays of greater than 10 percent are noted in the text. Findings Rate and costs of neonatal and maternal hospital stays related to substance use, 2006-2012 Figure 1 presents trends in the rate of neonatal and maternal hospital stays related to substance use from 2006 through 2012. |
|
|
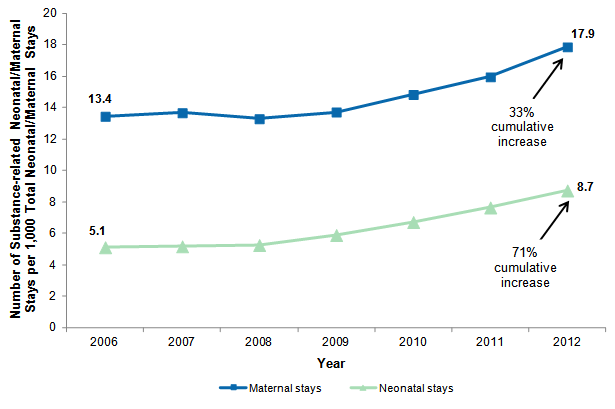
Figure 1. Rate of neonatal and maternal hospital stays related to substance use, 2006-2012
Note: Neonatal and maternal stays related to substance use were identified using all-listed conditions. Neonatal and maternal rates were calculated separately based on total neonatal or total maternal stays. Figure 1 is a line graph that shows the number of substance-related neonatal and maternal stays per 1,000 total neonatal and maternal stays between 2006 and 2012. The number of substance-related maternal stays per 1,000 maternal stays was 13.4 in 2006, 13.7 in 2007, 13.3 in 2008, 13.7 in 2009, 14.8 in 2010, 16.0 in 2011, and 17.9 in 2012, for a total cumulative increase of 33% over the 2006-2012 time period. The number of substance-related neonatal stays per 1,000 neonatal stays was 5.1 in 2006, 5.2 in 2007, 5.3 in 2008, 5.9 in 2009, 6.7 in 2010, 7.7 in 2011, and 8.7 in 2012, for a total cumulative increase of 71% over the 2006-2012 time period. |
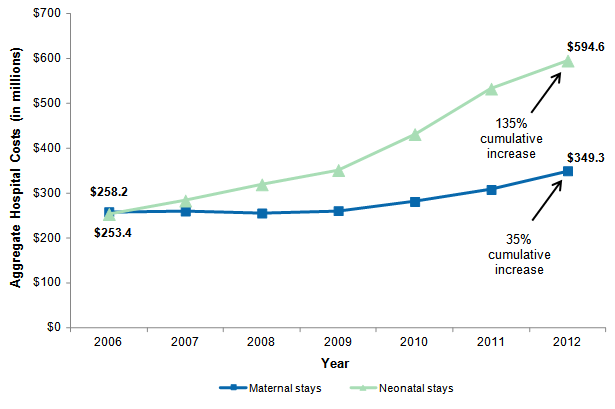
Figure 2 presents trends in aggregate hospital costs for neonatal and maternal stays related to substance use from 2006 through 2012. Costs are inflation adjusted and expressed in 2012 dollars. |
|
Figure 2. Inflation-adjusted aggregate hospital costs for neonatal and maternal stays related to substance use, 2006-2012
Notes: Neonatal and maternal stays related to substance use were identified using all-listed conditions. Inflation-adjusted costs are presented in 2012 dollars. Figure 2 is a line graph that shows inflation-adjusted aggregate hospital costs for substance-related neonatal and maternal stays between 2006 and 2012. Aggregate hospital costs for substance-related neonatal stays was $253.4 million in 2006, $283.2 million in 2007, $319.1 million in 2008, $351.2 million in 2009, $431.2 million in 2010, $532.1 million in 2011, and $594.6 million in 2012, for a total 135% cumulative increase over the 2006-2012 time period. Aggregate hospital costs for substance-related maternal stays was $258.2 million in 2006, $260.0 million in 2007, $255.2 million in 2008, $260.6 million in 2009, $281.2 million in 2010, $307.6 million in 2011, and $349.3 million in 2012, for a total 35% cumulative increase over the 2006-2012 time period.
|
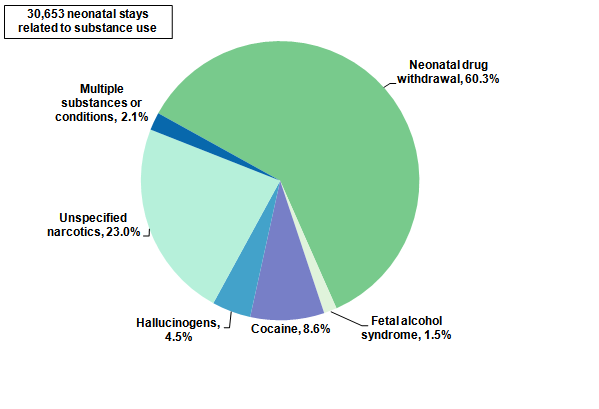
Types of substances and substance-related conditions among neonatal and maternal hospital stays, 2012 Figure 3 presents the distribution of neonatal hospital stays related to substance use in 2012 according to the type of substance or substance-related condition that was present. |
|
Figure 3. Neonatal hospital stays related to substance use by type of substance or substance-related condition, 2012
Note: Neonatal stays were assigned to mutually exclusive categories based on all-listed conditions using the following hierarchy: (1) "multiple substances or conditions" if more than one known substance or condition was indicated, (2) specific substance or condition (i.e., neonatal drug withdrawal, cocaine, hallucinogens, fetal alcohol syndrome) if only one known substance or condition was indicated, and (3) "unspecified narcotics" if only unspecified narcotics were indicated. Figure 3 is a pie chart that shows the percentage of neonatal hospital stays by type of substance or substance-related condition in 2012. Of the total of 30,653 neonatal stays in 2012 related to substance use, 60.3% were for neonatal drug withdrawal, 23.0% were for unspecified narcotics, 8.6% were for cocaine, 4.5% were for hallucinogens, 2.1% were for multiple substances or conditions, and 1.5% were for fetal alcohol syndrome.
|
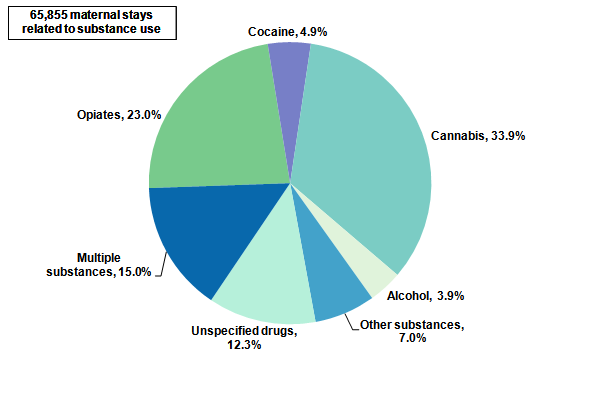
Figure 4 presents the distribution of maternal hospital stays related to substance use in 2012 according to the type of substance that was present. |
|
Figure 4. Maternal hospital stays related to substance use by type of substance, 2012
Notes: Maternal stays were assigned to mutually exclusive categories based on all-listed conditions using the following hierarchy: (1) "multiple substances" if more than one known substance was indicated, (2) specific substance (i.e., opiates, cocaine, cannabis, alcohol, other) if only one known substance was indicated, and (3) "unspecified drugs" if only unspecified drugs were indicated. "Other substances" includes hallucinogens, psychostimulants, sedatives, antidepressants, absinthe, glue, inhalants, and phencyclidine. Figure 4 is a pie chart that shows the percentage of maternal hospital stays by type of substance in 2012. Of the total of 65,855 maternal stays in 2012 related to substance use, 33.9% were for cannabis, 23.0% were for opiates, 15.0% were for multiple substances, 12.3% were for unspecified drugs, 7.0% were for other substances, 4.9% were for cocaine, and 3.9% were for alcohol.
|
Trends in the rate of neonatal and maternal hospital stays related to substance use, 2006-2012 Table 1 presents the number, rate, and cumulative percentage change in rate from 2006 to 2012 for neonatal and maternal hospital stays related to substance use by the type of substance or substance-related condition. |
| Table 1. Change in rate of neonatal and maternal hospital stays related to substance use by type of substance or substance-related condition, 2006-2012 | |||||
| Type of substance or substance-related condition | Stays, N | Rate per 1,000 neonatal or maternal stays | Cumulative % change in rate, 2006-2012 | ||
|---|---|---|---|---|---|
| 2006 | 2012 | 2006 | 2012 | ||
| Total substance-related neonatal stays | 19,670 | 30,653 | 5.1 | 8.7 | 70.5 |
| Neonatal drug withdrawal | 7,240 | 18,968 | 1.9 | 5.4 | 186.7 |
| Unspecified narcotics | 3,898 | 8,856 | 1.0 | 2.5 | 148.6 |
| Hallucinogens | 1,127 | 1,518 | 0.3 | 0.4 | 47.4 |
| Fetal alcohol syndrome | 675 | 595 | 0.2 | 0.2 | -3.6 |
| Cocaine | 8,627 | 3,175 | 2.2 | 0.9 | -59.7 |
| Total substance-related maternal stays | 55,115 | 65,855 | 13.4 | 17.9 | 32.9 |
| Opiates | 9,490 | 20,029 | 2.3 | 5.4 | 134.7 |
| Unspecified drugs | 15,971 | 24,130 | 3.9 | 6.5 | 68.0 |
| Cannabis | 21,041 | 28,626 | 5.1 | 7.8 | 51.3 |
| Other substances | 9,117 | 8,571 | 2.2 | 2.3 | 4.5 |
| Alcohol | 5,487 | 5,012 | 1.3 | 1.4 | 1.6 |
| Cocaine | 16,545 | 7,366 | 4.0 | 2.0 | -50.5 |
| Note: Substances were identified using all-listed conditions. If more than one type of substance was identified, the stay was counted in the row for each type of substance. Therefore, the numbers of stays for specific types of substances and substance-related conditions do not add up to the total number of substance-related stays. "Other substancesFigure 4 presents the distribution of maternal hospital stays related to substance use in 2012 according to the type of substance that was present. includes hallucinogens, psychostimulants, sedatives, antidepressants, absinthe, glue, inhalants, and phencyclidine. Cumulative percentage change was calculated from rates that were not rounded. Source: Agency for Healthcare Research and Quality (AHRQ), Center for Delivery, Organization, and Markets, Healthcare Cost and Utilization Project (HCUP), State Inpatient Databases (SID) from 38 States, 2006 and 2012 | |||||
Characteristics of neonatal and maternal hospital stays related to substance use, 2012 Table 2 presents characteristics of neonatal hospital stays related to substance use compared with all other neonatal stays that were not related to substance use in 2012. |
| Table 2. Characteristics of neonatal stays related to substance use compared with all other neonatal stays, 2012 | |||
| Variable | Neonatal stays related to substance use (N=30,653) | All other neonatal stays (N=3,479,654) | |
|---|---|---|---|
| Patient and hospital characteristics, % | |||
| Sex | Male | 53.2 | 51.3 |
| Female | 46.8 | 48.6 | |
| Primary expected payer | Medicaid | 79.9 | 46.2 |
| Private insurance | 11.8 | 46.4 | |
| Uninsured | 5.6 | 3.9 | |
| Medicare or other | 2.6 | 3.4 | |
| Median income | Quartile 1 (lowest income) | 39.0 | 26.8 |
| Quartile 2 | 25.7 | 23.9 | |
| Quartile 3 | 20.3 | 24.5 | |
| Quartile 4 (highest income) | 12.8 | 23.2 | |
| Patient's residence | Large metropolitan | 48.0 | 57.7 |
| Small metropolitan | 33.5 | 28.9 | |
| Micropolitan | 10.8 | 8.0 | |
| Not metro or micropolitan (rural) | 7.4 | 5.2 | |
| Hospital location (region) | Northeast | 15.5 | 14.0 |
| Midwest | 24.0 | 23.7 | |
| South | 39.0 | 37.0 | |
| West | 21.5 | 25.3 | |
| Co-occurring conditions | Low birth weight | 20.3 | 6.7 |
| Seizures | 1.4 | 0.3 | |
| Respiratory distress | 30.1 | 10.0 | |
| Difficulty feeding | 16.2 | 3.8 | |
| Hospital resource utilization | |||
| Stay and costs | Length of stay, days | 14.7 | 3.7 |
| Hospital costs, $ | 19,684 | 4,500 | |
| Source: Agency for Healthcare Research and Quality (AHRQ), Center for Delivery, Organization, and Markets, Healthcare Cost and Utilization Project (HCUP), State Inpatient Databases (SID) from 38 States, 2012 | |||
Table 3 presents characteristics of maternal hospital stays related to substance use compared with all other maternal stays that were not related to substance use in 2012. |
| Table 3. Characteristics of maternal stays related to substance use compared with all other maternal stays, 2012 | |||
| Variable | Maternal stays related to substance use (N=65,855) | All other maternal stays (N=3,621,974) | |
|---|---|---|---|
| Patient and hospital characteristics, % | |||
| Maternal age, years | <20 | 7.9 | 8.0 |
| 20-24 | 32.1 | 23.0 | |
| 25-34 | 50.6 | 53.6 | |
| 35+ | 9.3 | 15.3 | |
| Primary expected payer | Medicaid | 75.0 | 44.2 |
| Private insurance | 13.7 | 49.0 | |
| Uninsured | 5.4 | 2.8 | |
| Medicare or other | 5.9 | 3.9 | |
| Median income | Quartile 1 (lowest income) | 42.2 | 27.3 |
| Quartile 2 | 25.4 | 23.9 | |
| Quartile 3 | 18.8 | 24.3 | |
| Quartile 4 (highest income) | 11.1 | 22.8 | |
| Patient's residence | Large metropolitan | 51.1 | 58.0 |
| Small metropolitan | 32.0 | 28.7 | |
| Micropolitan | 10.1 | 7.9 | |
| Not metro or micropolitan (rural) | 6.3 | 5.1 | |
| Hospital location (region) | Northeast | 15.2 | 14.2 |
| Midwest | 26.6 | 23.3 | |
| South | 35.5 | 37.4 | |
| West | 22.7 | 25.2 | |
| Co-occurring conditions | Chronic pain | 2.1 | 0.1 |
| Mental disorders | 26.1 | 3.9 | |
| Hospital resource utilization | |||
| Stay and costs | Length of stay, days | 3.4 | 2.7 |
| Hospital costs, $ | 5,432 | 4,466 | |
| Source: Agency for Healthcare Research and Quality (AHRQ), Center for Delivery, Organization, and Markets, Healthcare Cost and Utilization Project (HCUP), State Inpatient Databases (SID) from 38 States, 2012 | |||
Data Source The estimates in this Statistical Brief are based upon data from the Healthcare Cost and Utilization Project (HCUP) 2006-2012 State Inpatient Databases (SID) from 38 States: Arizona, Arkansas, California, Colorado, Connecticut, Florida, Georgia, Hawaii, Illinois, Indiana, Iowa, Kansas, Kentucky, Maine, Maryland, Massachusetts, Michigan, Minnesota, Missouri, Nebraska, Nevada, New Jersey, New York, North Carolina, Ohio, Oklahoma, Oregon, Rhode Island, South Carolina, South Dakota, Tennessee, Texas, Utah, Vermont, Virginia, Washington, West Virginia, and Wisconsin. Combined, these States account for approximately 90 percent of all births in the United States.7 Definitions Diagnoses, procedures, ICD-9-CM, and Clinical Classifications Software (CCS) The principal diagnosis is that condition established after study to be chiefly responsible for the patient's admission to the hospital. Secondary diagnoses are concomitant conditions that coexist at the time of admission or develop during the stay. All-listed diagnoses include the principal diagnosis plus these additional secondary conditions. All-listed procedures include all procedures performed during the hospital stay, whether for definitive treatment or for diagnostic or exploratory purposes. The first-listed procedure is the procedure that is listed first on the discharge record. Inpatient data define this as the principal procedure—the procedure that is performed for definitive treatment rather than for diagnostic or exploratory purposes (i.e., the procedure that was necessary to take care of a complication). ICD-9-CM is the International Classification of Diseases, Ninth Revision, Clinical Modification, which assigns numeric codes to diagnoses and procedures. There are approximately 14,000 ICD-9-CM diagnosis codes and approximately 4,000 ICD-9-CM procedure codes. CCS categorizes ICD-9-CM diagnoses and procedures into a manageable number of clinically meaningful categories.8 This clinical grouper makes it easier to quickly understand patterns of diagnoses and procedures. CCS categories identified as Other typically are not reported; these categories include miscellaneous, otherwise unclassifiable diagnoses and procedures that may be difficult to interpret as a group. Neonatal and maternal stays were identified based on the following all-listed ICD-9-CM diagnosis and/or procedure codes, which include delivery records that resulted in a live birth or stillbirth at that stay, as well as pregnancy-related records that did not result in a delivery at that stay. If the same woman or neonate was hospitalized multiple times, each stay was counted separately:
Substance-related ICD-9-CM codes were selected that indicated alcohol or illicit drug use during pregnancy. Illicit drug use was defined as the use of illegal drugs or misuse of prescription drugs or other substances. Tobacco use was not examined. Codes were excluded if (1) it could not be determined that substance use occurred during pregnancy or (2) the code pertained to prescription drugs and it could not be determined whether the substance was misused or the effect was iatrogenic (i.e., induced inadvertently by medical treatment). Table 4 provides the ICD-9-CM diagnosis codes that were used to identify the substances and substance-related conditions among neonatal and maternal stays related to alcohol or illicit drug use during pregnancy. |
| Table 4. ICD-9-CM diagnosis codes used to identify substances or substance-related conditions among neonatal and maternal hospital stays | ||
| ICD-9-CM diagnosis code | ICD-9-CM code description | Type of substance or substance-related condition |
|---|---|---|
| Neonatal | ||
| 76071 | Alcohol affecting fetus or newborn via placenta or breast milk | Fetal alcohol syndrome |
| 76072 | Narcotics affecting fetus or newborn via placenta or breast milk | Unspecified narcotics |
| 76073 | Hallucinogenic agents affecting fetus or newborn via placenta or breast milk | Hallucinogens |
| 76075 | Cocaine affecting fetus or newborn via placenta or breast milk | Cocaine |
| 7795 | Drug withdrawal syndrome in newborn | Drug withdrawal |
| Maternal | ||
| 30300-30302 | Acute alcoholic intoxication in alcoholism, unspecified, continuous or episodic | Alcohol |
| 30390-30392 | Other and unspecified alcohol dependence, unspecified, continuous or episodic | Alcohol |
| 30400-30402 | Opioid type dependence, unspecified, continuous or episodic | Opiates |
| 30410-30412 | Sedative, hypnotic or anxiolytic dependence, unspecified, continuous or episodic | Other |
| 30420-30422 | Cocaine dependence, unspecified, continuous or episodic | Cocaine |
| 30430-30432 | Cannabis dependence, unspecified, continuous or episodic | Cannabis |
| 30440-30442 | Amphetamine and other psychostimulant dependence, unspecified, continuous or episodic | Other |
| 30450-30452 | Hallucinogen dependence, unspecified, continuous or episodic | Other |
| 30460-30462 | Other specified drug dependence (includes absinthe, glue, inhalants, phencyclidine), unspecified, continuous or episodic | Other |
| 30470-30472 | Combinations of opioid type drug with any other drug dependence, unspecified, continuous or episodic | Opiates |
| 30480-30482 | Combinations of drug dependence excluding opioid type drug, unspecified, continuous or episodic | Unspecified drugs |
| 30490-30492 | Unspecified drug dependence, unspecified, continuous or episodic | Unspecified drugs |
| 30500-30502 | Alcohol abuse, unspecified, continuous or episodic | Alcohol |
| 30520-30522 | Cannabis abuse, unspecified, continuous or episodic | Cannabis |
| 30530-30532 | Hallucinogen abuse, unspecified, continuous or episodic | Other |
| 30540-30542 | Sedative, hypnotic or anxiolytic abuse, unspecified, continuous or episodic | Other |
| 30550-30552 | Opioid abuse, unspecified, continuous or episodic | Opiates |
| 30560-30562 | Cocaine abuse, unspecified, continuous or episodic | Cocaine |
| 30570-30572 | Amphetamine or related acting sympathomimetic abuse, unspecified, continuous or episodic | Other |
| 30580-30582 | Antidepressant type abuse, unspecified, continuous or episodic | Other |
| 30590-30592 | Other, mixed, or unspecified drug abuse, unspecified, continuous or episodic | Unspecified drugs |
| 64830-64834 | Drug dependence of mother | Unspecified drugs |
| 96501 | Poisoning by heroin | Opiates |
| 96509 | Poisoning by other opiates and related narcotics | Opiates |
| 9696 | Poisoning by psychodysleptics (hallucinogens) | Other |
| 97081 | Poisoning by cocaine | Cocaine |
| 9800 | Toxic effect of ethyl alcohol | Alcohol |
| E8500 | Accidental poisoning by heroin | Opiates |
| E8541 | Accidental poisoning by psychodysleptics (hallucinogens) | Other |
| E8600 | Accidental poisoning by alcoholic beverages | Alcohol |
| E8608 | Accidental poisoning by other specified alcohols | Alcohol |
| E8609 | Accidental poisoning by unspecified alcohol | Alcohol |
Co-occurring diagnoses were identified using the following all-listed ICD-9-CM diagnosis codes and CCS categories:
Types of hospitals included in HCUP State Inpatient Databases This analysis used State Inpatient Databases (SID) limited to data from community hospitals, which are defined as short-term, non-Federal, general, and other hospitals, excluding hospital units of other institutions (e.g., prisons). Community hospitals include obstetrics and gynecology, otolaryngology, orthopedic, cancer, pediatric, public, and academic medical hospitals. Excluded for this analysis are long-term care facilities such as rehabilitation, psychiatric, and alcoholism and chemical dependency hospitals. However, if a patient received long-term care, rehabilitation, or treatment for psychiatric or chemical dependency conditions in a community hospital, the discharge record for that stay was included in the analysis. Unit of analysis The unit of analysis is the hospital discharge (i.e., the hospital stay), not a person or patient. This means that a person who is admitted to the hospital multiple times in 1 year will be counted each time as a separate discharge from the hospital. Costs and charges Total hospital charges were converted to costs using HCUP Cost-to-Charge Ratios based on hospital accounting reports from the Centers for Medicare & Medicaid Services (CMS).10 Costs reflect the actual expenses incurred in the production of hospital services, such as wages, supplies, and utility costs; charges represent the amount a hospital billed for the case. For each hospital, a hospital-wide cost-to-charge ratio is used. Hospital charges reflect the amount the hospital billed for the entire hospital stay and do not include professional (physician) fees. Aggregate hospital costs were inflation adjusted using the Gross Domestic Product (GDP) from the U.S. Department of Commerce, Bureau of Economic Analysis (BEA), with 2012 as the index base.11 How HCUP estimates of costs differ from National Health Expenditure Accounts There are a number of differences between the costs cited in this Statistical Brief and spending as measured in the National Health Expenditure Accounts (NHEA), which are produced annually by the Centers for Medicare & Medicaid Services (CMS).12 The largest source of difference comes from the HCUP coverage of inpatient treatment only in contrast to the NHEA inclusion of outpatient costs associated with emergency departments and other hospital-based outpatient clinics and departments as well. The outpatient portion of hospitals' activities has been growing steadily and may exceed half of all hospital revenue in recent years. On the basis of the American Hospital Association Annual Survey, 2012 outpatient gross revenues (or charges) were about 44 percent of total hospital gross revenues. 13 Smaller sources of differences come from the inclusion in the NHEA of hospitals that are excluded from HCUP. These include Federal hospitals (Department of Defense, Veterans Administration, Indian Health Services, and Department of Justice [prison] hospitals) as well as psychiatric, substance abuse, and long-term care hospitals. A third source of difference lies in the HCUP reliance on billed charges from hospitals to payers, adjusted to provide estimates of costs using hospital-wide cost-to-charge ratios, in contrast to the NHEA measurement of spending or revenue. HCUP costs estimate the amount of money required to produce hospital services, including expenses for wages, salaries, and benefits paid to staff as well as utilities, maintenance, and other similar expenses required to run a hospital. NHEA spending or revenue measures the amount of income received by the hospital for treatment and other services provided, including payments by insurers, patients, or government programs. The difference between revenues and costs include profit for for-profit hospitals or surpluses for nonprofit hospitals. Location of patients' residence Place of residence is based on the 2003 version of the Urban Influence Codes:
Median community-level income Median community-level income is the median household income of the patient's ZIP Code of residence. The cut-offs for the quartile designation are determined using ZIP Code demographic data obtained from the Nielsen Company. The income quartile is missing for patients who are homeless or foreign. Payer Payer is the expected primary payer for the hospital stay. To make coding uniform across all HCUP data sources, payer combines detailed categories into general groups:
Hospital stays billed to the State Children's Health Insurance Program (SCHIP) may be classified as Medicaid, Private Insurance, or Other, depending on the structure of the State program. Because most State data do not identify patients in SCHIP specifically, it is not possible to present this information separately When more than one payer is listed for a hospital discharge, the first-listed payer is used. Region Region is one of the four regions defined by the U.S. Census Bureau. Only those States included in this Statistical Brief are listed below for each region:
About HCUP The Healthcare Cost and Utilization Project (HCUP, pronounced "H-Cup") is a family of healthcare databases and related software tools and products developed through a Federal-State-Industry partnership and sponsored by the Agency for Healthcare Research and Quality (AHRQ). HCUP databases bring together the data collection efforts of State data organizations, hospital associations, and private data organizations (HCUP Partners) and the Federal government to create a national information resource of encounter-level healthcare data. HCUP includes the largest collection of longitudinal hospital care data in the United States, with all-payer, encounter-level information beginning in 1988. These databases enable research on a broad range of health policy issues, including cost and quality of health services, medical practice patterns, access to healthcare programs, and outcomes of treatments at the national, State, and local market levels. HCUP would not be possible without the contributions of the following data collection Partners from across the United States: Alaska State Hospital and Nursing Home Association Arizona Department of Health Services Arkansas Department of Health California Office of Statewide Health Planning and Development Colorado Hospital Association Connecticut Hospital Association District of Columbia Hospital Association Florida Agency for Health Care Administration Georgia Hospital Association Hawaii Health Information Corporation Illinois Department of Public Health Indiana Hospital Association Iowa Hospital Association Kansas Hospital Association Kentucky Cabinet for Health and Family Services Louisiana Department of Health and Hospitals Maine Health Data Organization Maryland Health Services Cost Review Commission Massachusetts Center for Health Information and Analysis Michigan Health & Hospital Association Minnesota Hospital Association Mississippi Department of Health Missouri Hospital Industry Data Institute Montana MHA - An Association of Montana Health Care Providers Nebraska Hospital Association Nevada Department of Health and Human Services New Hampshire Department of Health & Human Services New Jersey Department of Health New Mexico Department of Health New York State Department of Health North Carolina Department of Health and Human Services North Dakota (data provided by the Minnesota Hospital Association) Ohio Hospital Association Oklahoma State Department of Health Oregon Association of Hospitals and Health Systems Oregon Office of Health Analytics Pennsylvania Health Care Cost Containment Council Rhode Island Department of Health South Carolina Revenue and Fiscal Affairs Office South Dakota Association of Healthcare Organizations Tennessee Hospital Association Texas Department of State Health Services Utah Department of Health Vermont Association of Hospitals and Health Systems Virginia Health Information Washington State Department of Health West Virginia Health Care Authority Wisconsin Department of Health Services Wyoming Hospital Association About Statistical Briefs HCUP Statistical Briefs are descriptive summary reports presenting statistics on hospital inpatient and emergency department use and costs, quality of care, access to care, medical conditions, procedures, patient populations, and other topics. The reports use HCUP administrative healthcare data. About the SID The HCUP State Inpatient Databases (SID) are hospital inpatient databases from data organizations participating in HCUP. The SID contain the universe of the inpatient discharge abstracts in the participating HCUP States, translated into a uniform format to facilitate multistate comparisons and analyses. Together, the SID encompass more than 95 percent of all U.S. community hospital discharges. The SID can be used to investigate questions unique to one State, to compare data from two or more States, to conduct market-area variation analyses, and to identify State-specific trends in inpatient care utilization, access, charges, and outcomes. About HCUPnet HCUPnet is an online query system that offers instant access to the largest set of all-payer healthcare databases that are publicly available. HCUPnet has an easy step-by-step query system that creates tables and graphs of national and regional statistics as well as data trends for community hospitals in the United States. HCUPnet generates statistics using data from HCUP's National (Nationwide) Inpatient Sample (NIS), the Kids' Inpatient Database (KID), the Nationwide Emergency Department Sample (NEDS), the State Inpatient Databases (SID), and the State Emergency Department Databases (SEDD). For More Information For more information about HCUP, visit http://www.hcup-us.ahrq.gov/. For additional HCUP statistics, visit HCUPnet, our interactive query system, at https://datatools.ahrq.gov/hcupnet. For information on other hospitalizations in the United States, refer to the following HCUP Statistical Briefs located at http://www.hcup-us.ahrq.gov/reports/statbriefs/statbriefs.jsp:
For a detailed description of HCUP and more information on the design of the State Inpatient Databases (SID), please refer to the following database documentation: Agency for Healthcare Research and Quality. Overview of the State Inpatient Databases (SID). Healthcare Cost and Utilization Project (HCUP). Rockville, MD: Agency for Healthcare Research and Quality. Updated November 2014. http://www.hcup-us.ahrq.gov/sidoverview.jsp. Accessed January 7, 2015. Suggested Citation Fingar KR (Truven Health Analytics), Stocks C (AHRQ), Weiss AJ (Truven Health Analytics), Owens PL (AHRQ). Neonatal and Maternal Hospital Stays Related to Substance Use, 2006-2012. HCUP Statistical Brief #193. July 2015. Agency for Healthcare Research and Quality, Rockville, MD. http://www.hcup-us.ahrq.gov/reports/statbriefs/sb193-Neonatal-Maternal-Hospitalizations-Substance-Use.pdf. Acknowledgments The authors would like to acknowledge the contributions of Minya Sheng of Truven Health Analytics. *** AHRQ welcomes questions and comments from readers of this publication who are interested in obtaining more information about access, cost, use, financing, and quality of healthcare in the United States. We also invite you to tell us how you are using this Statistical Brief and other HCUP data and tools, and to share suggestions on how HCUP products might be enhanced to further meet your needs. Please e-mail us at hcup@ahrq.gov or send a letter to the address below:Virginia Mackay-Smith, Acting Director Center for Delivery, Organization, and Markets Agency for Healthcare Research and Quality 540 Gaither Road Rockville, MD 20850 1 Hudak ML, Tan RC, The Committee on Drugs, The Committee on Fetus and Newborn. Neonatal Drug Withdrawal. Clinical Report. Pediatrics. 2012;129(2);e540-60. http://pediatrics.aappublications.org/content/129/2/e540.full#T2. 2 Ibid. 3 Floyd RL, O'Connor MJ, Sokol RJ, Bertrand J, Cordero JF. Recognition and prevention of fetal alcohol syndrome. Obstetrics & Gynecology. 2005;106(5 Pt 1):1059-64. 4 Hudak et al., 2012. 5 Patrick SW, Schumachr RE, Benneworth BD, Krans EE, McAllister, JM, Davis MM. Neonatal abstinence syndrome and associated healthcare expenditures: United States, 2000-2009. JAMA. 2012;307(18):1934-40. 6 Centers for Disease Control and Prevention. Vital Signs: Overdoses of Prescription Opioid Pain Relievers—United States,1999-2008. Morbidity and Mortality Weekly Report (MMWR). 2011;60(43):1-6. 7 Hamilton BE, Martin JA, Ventura SJ. Births: Preliminary Data for 2012. National Vital Statistics Reports. 62(3). Hyattsville, MD: National Center for Health Statistics. 2013. http://www.cdc.gov/nchs/data/nvsr/nvsr62/nvsr62_03.pdf. Accessed November 11, 2014. 8 Agency for Healthcare Research and Quality. HCUP Clinical Classifications Software (CCS). Healthcare Cost and Utilization Project (HCUP). Rockville, MD: Agency for Healthcare Research and Quality, Rockville, MD. Updated November 2014. http://www.hcup-us.ahrq.gov/toolssoftware/ccs/ccs.jsp. Accessed January 7, 2015. 9 Agency for Healthcare Research and Quality. AHRQ QI, Prevention Quality Indicators #9, Technical Specifications, Low Birth. Weight Rate. Rockville, MD: Agency for Healthcare Research and Quality. August 2011. http://www.qualityindicators.ahrq.gov/Downloads/Modules/PQI/V43/TechSpecs/PQI%2009%20Low%20Birth%20Weight%20Rate.pdf. Accessed November 11, 2014. 10 Agency for Healthcare Research and Quality. HCUP Cost-to-Charge Ratio (CCR) Files. Healthcare Cost and Utilization Project (HCUP). 2001-2012. Rockville, MD: Agency for Healthcare Research and Quality. Updated August 2013. http://www.hcup-us.ahrq.gov/db/state/costtocharge.jsp. Accessed January 7, 2015. 11 U.S. Bureau of Economic Analysis. National Income and Product Account Tables, Table 1.1.4 Price Indexes for Gross Domestic Product. http://www.bea.gov/iTable/iTable.cfm?ReqID=9&step=1#reqid=9&step=1&isuri=1. Accessed August 25, 2014. 12 For additional information about the NHEA, see Centers for Medicare & Medicaid Services (CMS). National Health Expenditure Data. CMS website May 2014. http://www.cms.gov/Research-Statistics-Data-and-Systems/Statistics-Trends-and-Reports/NationalHealthExpendData/index.html?redirect=/NationalHealthExpendData/. Accessed January 7, 2015. 13 American Hospital Association. TrendWatch Chartbook, 2014. Table 4.2. Distribution of Inpatient vs. Outpatient Revenues, 1992-2012. Original source is no longer available on the Web; for related information refer to TrendWatch Chartbook, 2018. Table 4.2. Distribution of Inpatient vs. Outpatient Revenues, 1995-2016. www.aha.org/system/files/2018-05/2018-chartbook-table-4-2.pdf. |