STATISTICAL BRIEF #188 |
February 2015
Lauren M. Wier, M.P.H., Claudia A. Steiner, M.D., M.P.H., and Pamela L. Owens, Ph.D. Introduction From 1992 to 2012, the total number of surgeries at community hospitals in the United States increased by 17 percent to about 26.8 million surgeries. Outpatient surgeries represented a growing share (65 percent; 17.3 million) of all surgeries at community hospitals in the United States in 2012, up from 54 percent (12.3 million) in 1992.1 Ambulatory surgery (AS), or outpatient surgery, is a planned operation for which the patient is not expected to be admitted to the hospital. Comparison of ambulatory surgery with inpatient surgery is essential for understanding utilization patterns for specific surgical procedures. This Healthcare Cost and Utilization Project (HCUP) Statistical Brief compares surgeries performed at hospital-owned facilities in the ambulatory (outpatient) versus inpatient setting in 28 States that provide data for both types of settings. These 28 States represent about two-thirds of the U.S. population. Procedures performed in freestanding (nonhospital-owned) AS centers were not included because many State AS data sources do not include these types of centers. The analysis was limited to visits for adults aged 18 years and older who had an invasive surgery commonly performed for therapeutic purposes (i.e., to treat disease or injury); excluded were noninvasive surgeries and surgeries typically used for diagnostic or exploratory purposes (e.g., colonoscopy). The HCUP Surgery Flag software2 was used to identify invasive, therapeutic surgeries based on a narrow, targeted, and restrictive definition that includes surgical procedures that involve incision, excision, manipulation, or suturing of tissue that penetrates or breaks the skin; typically require use of an operating room; and also require regional anesthesia, general anesthesia, or sedation to control pain. This report presents the distribution of outpatient surgery compared with inpatient surgical procedures by body system, as well as the most common surgical procedures performed in an outpatient setting. In addition, ambulatory and inpatient volume and procedure rates are compared for each procedure. Unless otherwise noted, volumes and rates are based on all-listed procedure codes. |
|
Findings
Characteristics of surgeries performed in hospital-owned ambulatory versus inpatient settings, 2012 Table 1 presents characteristics of community hospital visits for invasive, therapeutic surgeries performed in the AS (outpatient) setting versus the hospital inpatient setting (admitted to the hospital) in 28 States in 2012. |
| Table 1. Characteristics of hospital visits or stays for surgery performed in ambulatory and inpatient settings in 28 States, 2012 | ||
| Characteristics | Ambulatory setting | Inpatient setting |
|---|---|---|
| Total visits or stays for surgeries, n | 7,655,600 | 6,762,300 |
| Percentage of all surgical visits or stays | 53.1 | 46.9 |
| Visits or stays per 100,000 populationa | 4,186 | 3,697 |
| Total number of surgeries, n | 9,322,200 | 9,730,300 |
| Percentage of all surgical procedures | 48.9 | 51.1 |
| Average number of surgeries per visit or stay | 1.2 | 1.4 |
| Average length of stay, days | 0.1 | 5.4 |
| Visits or stays by type of community hospitalb (%) | ||
| Large hospitals | 59.3 | 66.9 |
| Metropolitan hospitals | 86.8 | 92.4 |
| Teaching hospitals | 48.8 | 55.7 |
| Non-Federal government hospitals | 11.9 | 11.7 |
| Private not-for-profit hospitals | 74.3 | 73.3 |
| Private for-profit hospitals | 13.8 | 15.0 |
| a Based on State population estimates from the U.S. Census Bureau. b Hospital characteristics related to bed size, location, and teaching status are not mutually exclusive. Source: Agency for Healthcare Research and Quality (AHRQ), Center for Delivery, Organization, and Markets, Healthcare Cost and Utilization Project (HCUP), State Ambulatory Surgery and Services Databases (SASD) and State Inpatient Databases (SID), 2012, from 28 States | ||
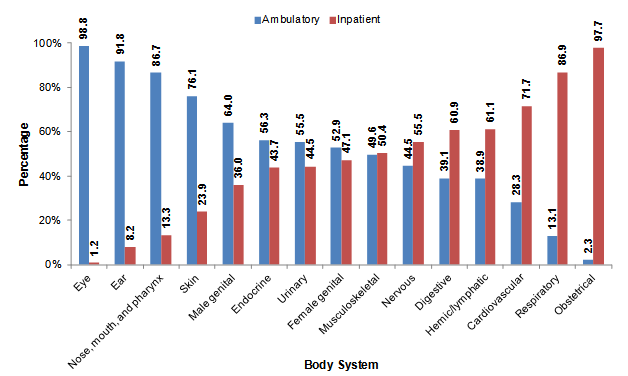
Comparison of surgeries by body system in hospital-owned ambulatory versus inpatient settings, 2012 Figure 1 shows the distribution of invasive, therapeutic surgeries by body system that were performed in AS and hospital inpatient settings in 2012. |
|
Figure 1. Ambulatory versus inpatient surgeries by body system, 2012
Note: Body systems are based on Clinical Classifications Software (CCS) and Clinical Classifications Software for Services and Procedures. Figure 1 shows the percentage of surgeries performed in 2012 that were ambulatory and that were inpatient, for 15 different body systems. Eye surgeries were 98.8% ambulatory and 1.2% inpatient. Ear surgeries were 91.8% ambulatory and 8.2% inpatient. Surgeries of the nose, mouth, and pharynx were 86.7% ambulatory and 13.3% inpatient. Skin surgeries were 76.1% ambulatory and 23.9% inpatient. Male genital surgeries were 64.0% ambulatory and 36.0% inpatient. Endocrine surgeries were 56.3% ambulatory and 43.7% inpatient. Urinary surgeries were 55.5% ambulatory and 44.5% inpatient. Female genital surgeries were 52.9% ambulatory and 47.1% inpatient. Musculoskeletal surgeries were 49.6% ambulatory and 50.4% inpatient. Surgeries of the nervous system were 44.5% ambulatory and 55.5% inpatient. Surgeries of the digestive system were 39.1% ambulatory and 60.9% inpatient. Surgeries of the hemic/lymphatic system were 38.9% ambulatory and 61.1% inpatient. Cardiovascular surgeries were 28.3% ambulatory and 71.1% inpatient. Respiratory surgeries were 13.1% ambulatory and 86.9% inpatient. Obstetrical surgeries were 2.3% ambulatory and 97.7% inpatient. |
The most common ambulatory surgeries performed, 2012 Table 2 lists the 25 most common, invasive, therapeutic clinically grouped surgeries that were performed in the AS setting in 2012, along with the percentage of these types of surgeries that were performed in the outpatient versus inpatient setting. Surgeries are ranked from most to least common in the AS setting. A comprehensive list of the distribution between the outpatient and inpatient settings for all specific, invasive, therapeutic surgeries is presented in the appendix. |
| Table 2. The 25 most common ambulatory surgeries performed in community hospitals, 2012 | ||||||
| All-listed CCS procedures | All ambulatory surgeries, % | Number of surgeries, thousands | Number of surgeries per 100,000 populationa | Surgeries performed in an ambulatory setting, % | ||
|---|---|---|---|---|---|---|
| Ambulatory setting | Inpatient setting | Ambulatory setting | Inpatient setting | |||
| Lens and cataract procedures | 9.3 | 865 | 1 | 473 | 0 | 99.9 |
| Other therapeutic procedures on muscles and tendons | 5.8 | 543 | 207 | 297 | 113 | 72.4 |
| Other OR therapeutic procedures on joints | 4.5 | 420 | 107 | 229 | 58 | 79.7 |
| Cholecystectomy and common duct exploration | 4.0 | 376 | 307 | 206 | 168 | 55.1 |
| Excision of semilunar cartilage of knee | 3.6 | 336 | 5 | 184 | 3 | 98.5 |
| Inguinal and femoral hernia repair | 2.8 | 260 | 28 | 142 | 15 | 90.2 |
| Other OR therapeutic procedures on skin and breast | 2.5 | 231 | 73 | 126 | 40 | 75.9 |
| Lumpectomy; quadrantectomy of breast | 2.4 | 225 | 8 | 123 | 4 | 96.5 |
| Decompression peripheral nerve | 2.4 | 224 | 11 | 123 | 6 | 95.2 |
| Other hernia repair | 2.3 | 218 | 180 | 119 | 98 | 54.8 |
| Other OR therapeutic procedures on nose; mouth and pharynx | 2.2 | 205 | 47 | 112 | 26 | 81.2 |
| Other OR procedures on vessels other than head and neck | 2.2 | 202 | 323 | 110 | 176 | 38.5 |
| Other excision of cervix and uterus | 2.2 | 201 | 33 | 110 | 18 | 85.9 |
| Partial excision bone | 2.0 | 190 | 245 | 104 | 134 | 43.7 |
| Other OR therapeutic procedures on bone | 1.9 | 180 | 96 | 98 | 52 | 65.3 |
| Transurethral excision; drainage; or removal urinary obstruction | 1.9 | 173 | 68 | 95 | 37 | 71.9 |
| Excision of skin lesion | 1.7 | 160 | 7 | 88 | 4 | 96.1 |
| Other OR therapeutic procedures; female organs | 1.7 | 160 | 73 | 87 | 40 | 68.6 |
| Insertion; revision; replacement; removal of cardiac pacemaker or cardioverter/defibrillator | 1.7 | 160 | 90 | 87 | 49 | 64.0 |
| Skin graft | 1.7 | 160 | 78 | 87 | 43 | 67.0 |
| Hysterectomy; abdominal and vaginal | 1.7 | 156 | 236 | 85 | 129 | 39.8 |
| Other intraocular therapeutic procedures | 1.7 | 155 | 3 | 85 | 2 | 98.1 |
| Debridement of wound; infection or burn | 1.7 | 154 | 116 | 84 | 63 | 57.1 |
| Bunionectomy or repair of toe deformities | 1.4 | 134 | 3 | 74 | 1 | 98.1 |
| Laminectomy; excision intervertebral disc | 1.3 | 122 | 345 | 67 | 189 | 26.1 |
| Abbreviation: OR, operating room. a Based on State population estimates from the U.S. Census Bureau. Note: Clinical Classifications Software (CCS) and Clinical Classifications Software for Services and Procedures. Source: Agency for Healthcare Research and Quality (AHRQ), Center for Delivery, Organization, and Markets, Healthcare Cost and Utilization Project (HCUP), State Ambulatory Surgery and Services Databases (SASD) and State Inpatient Databases (SID), 2012, from 28 States | ||||||
|
| Appendix. Invasive, therapeutic surgeries, listed by body system, performed in community hospitals by setting (ambulatory versus inpatient), 2012 | ||||||
| All-listed procedures (CCS number and description) | Number of surgeries, thousands | Number of surgeries per 100,000 population | Surgeries performed in an ambulatory setting, % | |||
|---|---|---|---|---|---|---|
| Ambulatory setting | Inpatient setting | Ambulatory setting | Inpatient setting | |||
| Operations on the nervous system | ||||||
| 3: Laminectomy; excision intervertebral disca | 122.2 | 345.5 | 66.8 | 188.9 | 26.1 | |
| 5: Insertion of catheter or spinal stimulator and injection into spinal canal | 30.6 | 5.2 | 16.8 | 2.9 | 85.4 | |
| 6: Decompression peripheral nervea | 224.2 | 11.2 | 122.6 | 6.1 | 95.2 | |
| 9: Other OR therapeutic nervous system procedures | 90.2 | 126.7 | 49.3 | 69.3 | 41.6 | |
| Operations on the endocrine system | ||||||
| 10: Thyroidectomy; partial or complete | 55.0 | 33.7 | 30.1 | 18.4 | 62.0 | |
| 12: Other therapeutic endocrine procedures | 27.2 | 30.1 | 14.9 | 16.4 | 47.5 | |
| Operations on the eye | ||||||
| 13: Corneal transplant | 14.4 | 0.2 | 7.9 | 0.1 | 98.4 | |
| 14: Glaucoma procedures | 50.4 | 0.3 | 27.5 | 0.2 | 99.4 | |
| 15: Lens and cataract proceduresa | 864.9 | 0.7 | 472.8 | 0.4 | 99.9 | |
| 16: Repair of retinal tear; detachment | 37.9 | 0.7 | 20.7 | 0.4 | 98.2 | |
| 19: Other therapeutic procedures on eyelids; conjunctiva; cornea | 106.8 | 5.7 | 58.4 | 3.1 | 95.0 | |
| 20: Other intraocular therapeutic proceduresa | 155.2 | 3.0 | 84.9 | 1.7 | 98.1 | |
| 21: Other extraocular muscle and orbit therapeutic procedures | 19.5 | 3.9 | 10.7 | 2.1 | 83.5 | |
| Operations on the ear | ||||||
| 22: Tympanoplasty | 17.6 | 0.5 | 9.6 | 0.3 | 97.0 | |
| 23: Myringotomy | 19.7 | 1.6 | 10.8 | 0.9 | 92.6 | |
| 24: Mastoidectomy | 9.8 | 1.5 | 5.3 | 0.8 | 86.8 | |
| 26: Other therapeutic ear procedures | 26.3 | 2.9 | 14.4 | 1.6 | 89.9 | |
| Operations on the nose, mouth, and pharynx | ||||||
| 27: Control of epistaxis | 17.6 | 1.2 | 9.6 | 0.7 | 93.6 | |
| 28: Plastic procedures on nose | 111.3 | 6.0 | 60.9 | 3.3 | 94.9 | |
| 29: Dental procedures | 6.7 | 2.2 | 3.6 | 1.2 | 75.0 | |
| 30: Tonsillectomy and/or adenoidectomy | 65.1 | 5.4 | 35.6 | 2.9 | 92.4 | |
| 33: Other OR therapeutic procedures on nose; mouth and pharynxa | 204.8 | 47.4 | 112.0 | 25.9 | 81.2 | |
| Operations on the respiratory system | ||||||
| 42: Other OR Rx procedures on respiratory system and mediastinum | 32.0 | 65.3 | 17.5 | 35.7 | 32.9 | |
| Operations on the cardiovascular system | ||||||
| 45: Percutaneous transluminal coronary angioplasty (PTCA) | 54.0 | 400.3 | 29.5 | 218.8 | 11.9 | |
| 48: Insertion; revision; replacement; removal of cardiac pacemaker or cardioverter/defibrillatora | 160.0 | 90.1 | 87.5 | 49.3 | 64.0 | |
| 49: Other OR heart procedures | 24.4 | 141.1 | 13.3 | 77.2 | 14.7 | |
| 53: Varicose vein stripping; lower limb | 24.8 | 0.5 | 13.5 | 0.3 | 98.0 | |
| 55: Peripheral vascular bypass | 3.0 | 49.3 | 1.7 | 26.9 | 5.8 | |
| 57: Creation; revision and removal of arteriovenous fistula or vessel-to-vessel cannula for dialysis | 95.0 | 35.9 | 51.9 | 19.6 | 72.6 | |
| 59: Other OR procedures on vessels of head and neck | 2.6 | 39.6 | 1.4 | 21.7 | 6.1 | |
| 61: Other OR procedures on vessels other than head and necka | 202.0 | 322.7 | 110.5 | 176.4 | 38.5 | |
| Operations on the hemic and lymphatic system | ||||||
| 64: Bone marrow transplant | 3.0 | 11.5 | 1.7 | 6.3 | 20.9 | |
| 67: Other therapeutic procedures; hemic and lymphatic system | 110.2 | 149.4 | 60.3 | 81.7 | 42.5 | |
| Operations on the digestive system | ||||||
| 78: Colorectal resection | 5.2 | 224.2 | 2.8 | 122.6 | 2.3 | |
| 80: Appendectomy | 65.4 | 172.7 | 35.8 | 94.4 | 27.5 | |
| 81: Hemorrhoid procedures | 66.5 | 6.3 | 36.3 | 3.4 | 91.4 | |
| 84: Cholecystectomy and common duct explorationa | 376.0 | 307.0 | 205.6 | 167.8 | 55.1 | |
| 85: Inguinal and femoral hernia repaira | 260.3 | 28.2 | 142.3 | 15.4 | 90.2 | |
| 86: Other hernia repaira | 218.5 | 180.1 | 119.4 | 98.5 | 54.8 | |
| 87: Laparoscopy (GI only) | 15.0 | 0.0 | 8.2 | 0.0 | 99.9 | |
| 90: Excision; lysis peritoneal adhesions | 29.5 | 252.3 | 16.1 | 137.9 | 10.5 | |
| 94: Other OR upper GI therapeutic procedures | 20.6 | 119.5 | 11.3 | 65.4 | 14.7 | |
| 96: Other OR lower GI therapeutic procedures | 80.8 | 188.2 | 44.2 | 102.9 | 30.0 | |
| 99: Other OR gastrointestinal therapeutic procedures | 40.8 | 166.6 | 22.3 | 91.1 | 19.7 | |
| Operations on the urinary system | ||||||
| 100: Endoscopy and endoscopic biopsy of the urinary tract | 9.0 | 0.0 | 4.9 | 0.0 | 100.0 | |
| 101: Transurethral excision; drainage; or removal urinary obstructiona | 172.9 | 67.6 | 94.5 | 37.0 | 71.9 | |
| 103: Nephrotomy and nephrostomy | 8.1 | 37.9 | 4.4 | 20.7 | 17.6 | |
| 106: Genitourinary incontinence procedures | 74.2 | 35.2 | 40.6 | 19.2 | 67.8 | |
| 108: Indwelling catheter | 25.9 | 8.7 | 14.2 | 4.8 | 74.8 | |
| 109: Procedures on the urethra | 32.7 | 7.4 | 17.9 | 4.0 | 81.6 | |
| 112: Other OR therapeutic procedures of urinary tract | 28.1 | 62.4 | 15.4 | 34.1 | 31.0 | |
| Operations on the male genital system | ||||||
| 113: Transurethral resection of prostate (TURP) | 42.5 | 31.6 | 23.2 | 17.3 | 57.3 | |
| 114: Open prostatectomy | 5.3 | 50.7 | 2.9 | 27.7 | 9.5 | |
| 115: Circumcision | 18.1 | 1.1 | 9.9 | 0.6 | 94.1 | |
| 118: Other OR therapeutic procedures; male genital | 99.0 | 15.7 | 54.1 | 8.6 | 86.3 | |
| Operations on the female genital system | ||||||
| 119: Oophorectomy; unilateral and bilateral | 98.0 | 169.4 | 53.6 | 92.6 | 36.7 | |
| 120: Other operations on ovary | 43.1 | 33.4 | 23.6 | 18.3 | 56.3 | |
| 121: Ligation or occlusion of fallopian tubes | 83.0 | 196.2 | 45.4 | 107.2 | 29.7 | |
| 122: Removal of ectopic pregnancy | 11.6 | 10.0 | 6.4 | 5.5 | 53.7 | |
| 123: Other operations on fallopian tubes | 29.1 | 26.2 | 15.9 | 14.3 | 52.6 | |
| 124: Hysterectomy; abdominal and vaginala | 155.7 | 235.9 | 85.1 | 129.0 | 39.8 | |
| 125: Other excision of cervix and uterusa | 201.3 | 33.1 | 110.0 | 18.1 | 85.9 | |
| 126: Abortion (termination of pregnancy) | 10.0 | 1.0 | 5.5 | 0.6 | 90.5 | |
| 127: Dilatation and curettage (D&C); aspiration after delivery or abortion | 110.7 | 25.0 | 60.5 | 13.7 | 81.6 | |
| 129: Repair of cystocele and rectocele; obliteration of vaginal vault | 45.3 | 44.4 | 24.8 | 24.3 | 50.5 | |
| 132: Other OR therapeutic procedures; female organsa | 160.0 | 73.3 | 87.5 | 40.1 | 68.6 | |
| 141: Other therapeutic obstetrical procedures | 12.1 | 5.2 | 6.6 | 2.9 | 69.8 | |
| Operations on the musculoskeletal system | ||||||
| 142: Partial excision bonea | 190.3 | 245.4 | 104.0 | 134.1 | 43.7 | |
| 143: Bunionectomy or repair of toe deformitiesa | 134.4 | 2.6 | 73.5 | 1.4 | 98.1 | |
| 144: Treatment; facial fracture or dislocation | 37.5 | 17.7 | 20.5 | 9.7 | 68.0 | |
| 145: Treatment; fracture or dislocation of radius and ulna | 73.9 | 37.4 | 40.4 | 20.4 | 66.4 | |
| 146: Treatment; fracture or dislocation of hip and femur | 3.4 | 195.0 | 1.9 | 106.6 | 1.7 | |
| 147: Treatment; fracture or dislocation of lower extremity (other than hip or femur) | 89.7 | 130.5 | 49.1 | 71.4 | 40.7 | |
| 148: Other fracture and dislocation procedure | 112.3 | 106.6 | 61.4 | 58.3 | 51.3 | |
| 149: Arthroscopy | 53.7 | 1.6 | 29.4 | 0.9 | 97.2 | |
| 150: Division of joint capsule; ligament or cartilage | 46.8 | 10.2 | 25.6 | 5.6 | 82.1 | |
| 151: Excision of semilunar cartilage of kneea | 336.5 | 5.2 | 183.9 | 2.8 | 98.5 | |
| 152: Arthroplasty knee | 46.4 | 513.6 | 25.4 | 280.8 | 8.3 | |
| 153: Hip replacement; total and partial | 7.9 | 345.9 | 4.3 | 189.1 | 2.2 | |
| 154: Arthroplasty other than hip or knee | 100.8 | 66.2 | 55.1 | 36.2 | 60.4 | |
| 155: Arthrocentesis | 20.6 | 0.1 | 11.3 | 0.0 | 99.7 | |
| 157: Amputation of lower extremity | 22.7 | 97.0 | 12.4 | 53.0 | 19.0 | |
| 158: Spinal fusion | 35.6 | 332.9 | 19.4 | 182.0 | 9.7 | |
| 160: Other therapeutic procedures on muscles and tendonsa | 543.0 | 207.3 | 296.9 | 113.3 | 72.4 | |
| 161: Other OR therapeutic procedures on bonea | 179.7 | 95.6 | 98.3 | 52.2 | 65.3 | |
| 162: Other OR therapeutic procedures on jointsa | 419.7 | 106.6 | 229.5 | 58.3 | 79.7 | |
| 164: Other OR therapeutic procedures on musculoskeletal system | 32.8 | 30.0 | 17.9 | 16.4 | 52.2 | |
| Operations on the integumentary system | ||||||
| 166: Lumpectomy; quadrantectomy of breasta | 224.9 | 8.1 | 123.0 | 4.4 | 96.5 | |
| 167: Mastectomy | 32.9 | 45.6 | 18.0 | 24.9 | 41.9 | |
| 168: Incision and drainage; skin and subcutaneous tissue | 35.0 | 0.4 | 19.1 | 0.2 | 98.8 | |
| 169: Debridement of wound; infection or burna | 154.5 | 115.8 | 84.5 | 63.3 | 57.1 | |
| 170: Excision of skin lesiona | 160.1 | 6.6 | 87.5 | 3.6 | 96.1 | |
| 171: Suture of skin and subcutaneous tissue | 32.1 | 0.8 | 17.6 | 0.5 | 97.5 | |
| 172: Skin grafta | 159.6 | 78.5 | 87.3 | 42.9 | 67.0 | |
| 175: Other OR therapeutic procedures on skin and breasta | 231.0 | 73.3 | 126.3 | 40.1 | 75.9 | |
| Miscellaneous diagnostic and therapeutic procedures | ||||||
| 211: Therapeutic radiology for cancer treatment | 5.6 | 3.1 | 3.1 | 1.7 | 64.3 | |
| 231: Other therapeutic procedures | 48.5 | 125.9 | 26.5 | 68.8 | 27.8 | |
| Abbreviation: CCS, Clinical Classifications Software. Notes: Statistics are based on the "narrow" definition of the HCUP Surgery Flag software. CCS procedure categories with fewer than 2,000 ambulatory surgery cases are excluded. a The top 25 surgical procedures also reported in Table 2 are highlighted. Source: Agency for Healthcare Research and Quality (AHRQ), Center for Delivery, Organization, and Markets, Healthcare Cost and Utilization Project (HCUP), State Ambulatory Surgery and Services Databases (SASD) and State Inpatient Databases (SID), 2012, from 28 States | ||||||
Data Source
The volumes and rates in this Statistical Brief are based upon data from the Healthcare Cost and Utilization Project (HCUP) 2012 State Ambulatory Surgery and Services Databases (SASD) and 2012 State Inpatient Databases (SID). This report evaluates both outpatient and inpatient surgery data from 28 States that contributed data to both the 2012 SASD and the 2012 SID: California, Colorado, Connecticut, Florida, Georgia, Illinois, Indiana, Iowa, Kansas, Kentucky, Maryland, Michigan, Minnesota, Missouri, Nebraska, Nevada, New Jersey, New York, North Carolina, Ohio, Oklahoma, Oregon, South Carolina, South Dakota, Tennessee, Texas, Vermont, and Wisconsin. Supplemental sources included population denominator data for use with HCUP databases, derived from information available from the Bureau of the Census.3 Definitions Procedures, ICD-9-CM, Current Procedural Terminology (CPT®), and Clinical Classifications Software (CCS) All-listed procedures include all procedures performed during the hospital inpatient stay or outpatient visit, whether for definitive treatment or for diagnostic or exploratory purposes. Procedures are deduplicated: if a particular CCS procedure occurs multiple times during the same surgical visit or hospital stay, it is counted only once. Procedures on inpatient hospitalization records are coded using the International Classification of Diseases, Ninth Revision, Clinical Modification (ICD-9-CM); procedures on ambulatory surgery and services records can be coded using either ICD-9-CM or the CPT. ICD-9-CM and CPT both assign numeric codes to procedures; ICD-9-CM is limited to procedures in the inpatient setting. There are approximately 4,000 ICD-9-CM procedure codes and 9,600 CPT procedure codes. CCS categorizes ICD-9-CM procedure codes into a manageable number of clinically meaningful, mutually exclusive categories.4 This clinical grouper makes it easier to quickly understand patterns of procedure use. When CPT was used on ambulatory surgery records, the CCS for Services and Procedures5 was used to classify procedures into groupings comparable to the CCS. Case definition For this report, records from the SASD meeting the following criteria were included:
In this report, records from the SID meeting the following criteria were included:
Types of hospitals included in HCUP State Inpatient Databases This analysis used State Inpatient Databases (SID) limited to data from community hospitals, which are defined as short-term, non-Federal, general, and other hospitals, excluding hospital units of other institutions (e.g., prisons). Community hospitals include obstetrics and gynecology, otolaryngology, orthopedic, cancer, pediatric, public, and academic medical hospitals. Excluded for this analysis are long-term care facilities such as rehabilitation, psychiatric, and alcoholism and chemical dependency hospitals. However, if a patient received long-term care, rehabilitation, or treatment for psychiatric or chemical dependency conditions in a community hospital, the discharge record for that stay was included in the analysis. We limited the analysis to hospitals with at least 200 inpatient surgical stays per year. Types of hospitals included in HCUP State Ambulatory Surgery and Services Databases This analysis used State Ambulatory Surgery and Services Databases (SASD) limited to data from hospital-owned ambulatory surgery facilities. Although some SASD include data from facilities not owned by a hospital, those facilities were excluded from this analysis. The designation of a facility as hospital-owned is specific to its financial relationship with a hospital that provides inpatient care and is not related to its physical location. Ambulatory surgery performed in hospital-owned facilities may be performed within the hospital, in a facility attached to the hospital, or in a facility physically separated from the hospital. The analysis was further limited to ambulatory surgeries performed at facilities owned by community hospitals. Community hospitals are defined as short-term, non-Federal, general, and other specialty hospitals, excluding hospital units of other institutions (e.g., prisons). We limited the analysis to community hospitals with at least 200 ambulatory surgery visits per year. Unit of analysis The unit of analysis is the ambulatory surgery visit or hospital discharge (i.e., the hospital stay), not a person or patient. For this report, any reference to visit or hospital stay indicates that the unit of analysis is the record, rather than the surgical procedure. Any reference to surgeries indicates that the unit of analysis is a procedure. About HCUP The Healthcare Cost and Utilization Project (HCUP, pronounced "H-Cup") is a family of databases and related software tools and products developed through a Federal-State-Industry partnership and sponsored by the Agency for Healthcare Research and Quality (AHRQ). HCUP databases bring together the data collection efforts of State data organizations, hospital associations, and private data organizations (HCUP Partners), and the Federal government to create a national information resource of encounter-level data. HCUP includes the largest collection of longitudinal hospital care data in the United States, with all-payer, encounter-level information beginning in 1988. These databases enable research on a broad range of health policy issues, including cost and quality of health services, medical practice patterns, access to programs, and outcomes of treatments at the national, State, and local market levels. HCUP would not be possible without the contributions of the following data collection Partners from across the United States: Alaska State Hospital and Nursing Home Association Arizona Department of Health Services Arkansas Department of Health California Office of Statewide Health Planning and Development Colorado Hospital Association Connecticut Hospital Association Florida Agency for Health Care Administration Georgia Hospital Association Hawaii Health Information Corporation Illinois Department of Public Health Indiana Hospital Association Iowa Hospital Association Kansas Hospital Association Kentucky Cabinet for Health and Family Services Louisiana Department of Health and Hospitals Maine Health Data Organization Maryland Health Services Cost Review Commission Massachusetts Center for Health Information and Analysis Michigan Health & Hospital Association Minnesota Hospital Association Mississippi Department of Health Missouri Hospital Industry Data Institute Montana MHA - An Association of Montana Health Care Providers Nebraska Hospital Association Nevada Department of Health and Human Services New Hampshire Department of Health & Human Services New Jersey Department of Health New Mexico Department of Health New York State Department of Health North Carolina Department of Health and Human Services North Dakota (data provided by the Minnesota Hospital Association) Ohio Hospital Association Oklahoma State Department of Health Oregon Association of Hospitals and Health Systems Oregon Health Policy and Research Pennsylvania Health Care Cost Containment Council Rhode Island Department of Health South Carolina Revenue and Fiscal Affairs Office South Dakota Association of Healthcare Organizations Tennessee Hospital Association Texas Department of State Health Services Utah Department of Health Vermont Association of Hospitals and Health Systems Virginia Health Information Washington State Department of Health West Virginia Health Care Authority Wisconsin Department of Health Services Wyoming Hospital Association About Statistical Briefs HCUP Statistical Briefs are descriptive summary reports presenting statistics on hospital inpatient and emergency department use and costs, quality of care, access to care, medical conditions, procedures, patient populations, and other topics. The reports use HCUP administrative data. About the SASD The HCUP State Ambulatory Surgery and Services Databases (SASD) include encounter-level data for ambulatory surgeries and may also include various types of outpatient services such as observation stays, lithotripsy, radiation therapy, imaging, chemotherapy, and labor and delivery. The specific types of ambulatory surgery and outpatient services included in each SASD vary by State and data year. All SASD include data from hospital-owned ambulatory surgery facilities. In addition, some States include data from facilities not owned by a hospital. The designation of a facility as hospital-owned is specific to its financial relationship with a hospital that provides inpatient care and is not related to its physical location. Hospital-owned ambulatory surgery and other outpatient care facilities may be contained within the hospital, physically attached to the hospital, or located in a different geographic area. In order to provide information that is comparable across all States, analysis was restricted to hospital-owned ambulatory surgery. About the SID The HCUP State Inpatient Databases (SID) are hospital inpatient databases from data organizations participating in HCUP. The SID contain the universe of the inpatient discharge abstracts in the participating HCUP States, translated into a uniform format to facilitate multistate comparisons and analyses. Together, the SID encompass more than 95 percent of all U.S. community hospital discharges in 2012. The SID can be used to investigate questions unique to one State, to compare data from two or more States, to conduct market-area variation analyses, and to identify State-specific trends in inpatient care utilization, access, charges, and outcomes. For More Information For more information about HCUP, visit http://www.hcup-us.ahrq.gov/. For additional HCUP statistics, visit HCUPnet, our interactive query system, at https://datatools.ahrq.gov/hcupnet. For information on other hospitalizations in the United States, refer to the following HCUP Statistical Briefs located at http://www.hcup-us.ahrq.gov/reports/statbriefs/statbriefs.jsp:
For a detailed description of HCUP and more information on the design of the State Ambulatory Surgery and Services Databases (SASD) and State Inpatient Databases (SID), please refer to the following database documentation: Agency for Healthcare Research and Quality. Overview of the State Ambulatory Surgery and Services Databases (SASD). Healthcare Cost and Utilization Project (HCUP). Rockville, MD: Agency for Healthcare Research and Quality. Updated November 2014. http://www.hcup-us.ahrq.gov/sasdoverview.jsp. Accessed December 15, 2014. Agency for Healthcare Research and Quality. Overview of the State Inpatient Databases (SID). Healthcare Cost and Utilization Project (HCUP). Rockville, MD: Agency for Healthcare Research and Quality. Updated September 2014. http://www.hcup-us.ahrq.gov/sidoverview.jsp. Accessed September 11, 2014. Suggested Citation Wier LM (Truven Health Analytics), Steiner CA (AHRQ), Owens PL (AHRQ). Surgeries in Hospital-Owned Outpatient Facilities, 2012. HCUP Statistical Brief #188. February 2015. Agency for Healthcare Research and Quality, Rockville, MD. http://www.hcup-us.ahrq.gov/reports/statbriefs/sb188-Surgeries-Hospital-Outpatient-Facilities-2012.pdf. Acknowledgments The authors would like to acknowledge the contributions of Nils Nordstrand of Truven Health Analytics. *** AHRQ welcomes questions and comments from readers of this publication who are interested in obtaining more information about access, cost, use, financing, and quality of in the United States. We also invite you to tell us how you are using this Statistical Brief and other HCUP data and tools, and to share suggestions on how HCUP products might be enhanced to further meet your needs. Please e-mail us at hcup@ahrq.gov or send a letter to the address below:Irene Fraser, Ph.D., Director Center for Delivery, Organization, and Markets Agency for Healthcare Research and Quality 540 Gaither Road Rockville, MD 20850 1 American Hospital Association. Utilization and volume. In: Trends Affecting Hospitals and Health Systems, chapter 3. www.aha.org/system/files/2018-01/2014-chartbook.pdf. 2 Agency for Healthcare Research and Quality. HCUP Surgery Flag Software. Healthcare Cost and Utilization Project (HCUP). Rockville, MD: Agency for Healthcare Research and Quality. Updated May 2013. http://www.hcup-us.ahrq.gov/toolssoftware/surgflags/surgeryflags.jsp. Accessed August 13, 2014. 3 Barrett M, Lopez-Gonzalez L, Coffey R, Levit K. Population Denominator Data for Use with the HCUP Databases (Updated with 2013 Population Data). HCUP Methods Series Report #2014-02. August 18, 2014. U.S. Agency for Healthcare Research and Quality. https://www.hcup-us.ahrq.gov/reports/methods/2014-02.pdf. Accessed September 11, 2014. 4 Agency for Healthcare Research and Quality. HCUP Clinical Classifications Software (CCS). Healthcare Cost and Utilization Project (HCUP). Rockville, MD: Agency for Healthcare Research and Quality. Updated July 2014. http://www.hcup-us.ahrq.gov/toolssoftware/ccs/ccs.jsp. Accessed August 13, 2014. 5 Agency for Healthcare Research and Quality. HCUP Clinical Classifications Software for Services and Procedures. Healthcare Cost and Utilization Project (HCUP). Rockville, MD: Agency for Healthcare Research and Quality. Updated May 2014. www.hcup-us.ahrq.gov/toolssoftware/ccs_svcsproc/ccssvcproc.jsp. Accessed August 13, 2014. 6 Agency for Healthcare Research and Quality. HCUP Surgery Flag Software. Healthcare Cost and Utilization Project (HCUP). Rockville, MD: Agency for Healthcare Research and Quality. Updated May 2013. http://www.hcup-us.ahrq.gov/toolssoftware/surgflags/surgeryflags.jsp. Accessed August 13, 2014. 7 An invasive therapeutic surgical procedure involving incision, excision, manipulation, or suturing of tissue that penetrates or breaks the skin; typically requires use of an operating room; and also requires regional anesthesia, general anesthesia, or sedation to control pain. Guiding key terms include invasive (does not go through an existing orifice); therapeutic; pacemakers; robotic-assisted procedures; laparoscopy; layer closure; complex repair; extensive, complicated; penetrating wound; deep; complicated; and tissue transfer. |
| Internet Citation: Statistical Brief #188. Healthcare Cost and Utilization Project (HCUP). May 2016. Agency for Healthcare Research and Quality, Rockville, MD. hcup-us.ahrq.gov/reports/statbriefs/sb188-Surgeries-Hospital-Outpatient-Facilities-2012.jsp. |
| Are you having problems viewing or printing pages on this website? |
| If you have comments, suggestions, and/or questions, please contact hcup@ahrq.gov. |
| If you are experiencing issues related to Section 508 accessibility of information on this website, please contact hcup@ahrq.gov. |
| Privacy Notice, Viewers & Players |
| Last modified 5/16/16 |