STATISTICAL BRIEF #169 |
January 2014
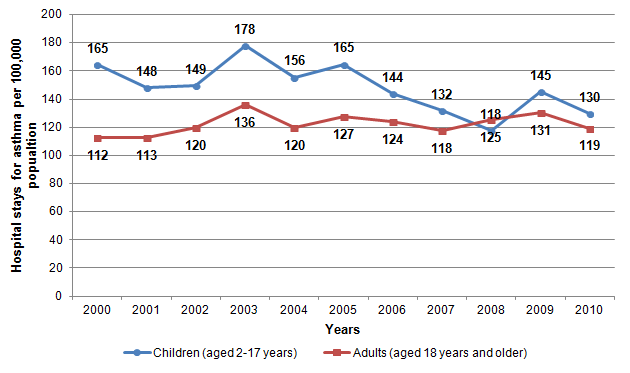
Marguerite L. Barrett, M.S., Lauren M. Wier, M.P.H., and Raynard Washington, Ph.D., M.P.H. Introduction Asthma is a chronic disease characterized by inflammation of the airways. It restricts the passage of air into the lungs and leads to episodes of wheezing, coughing, chest tightness, and shortness of breath. Severe asthmatic episodes can close off airways completely and, in some cases, may be life-threatening.1 In 2010, approximately 7.0 million children aged 0—17 years and 18.7 million adults aged 18 years and older had a diagnosis of asthma. The prevalence of asthma in the United States has increased from 7.3 percent of the population in 2001 to 8.4 percent in 2010.2 Asthma is largely controllable with proper primary care, and the need for hospitalization can usually be prevented. However, differences in rates of hospitalization for asthma suggest that there is significant room for improvement in caring for the condition. This Statistical Brief presents data from the Healthcare Cost and Utilization Project (HCUP) on trends in pediatric and adult inpatient hospital stays for asthma at U.S. community hospitals from 2000 through 2010. In addition, we present patient characteristics of pediatric and adult hospital stays for asthma in 2010. Differences that are noted in the text exhibit at least a 10 percent difference between estimates and are statistically significant at 0.05 or better. Findings Rate of pediatric and adult hospital stays for asthma, 2000—2010 Figure 1 displays the age- and sex-adjusted rates of hospital stays for asthma from 2000 through 2010 for children (aged 2—17 years) and adults (aged 18 years and older).3 The rate of pediatric asthma-related hospital stays declined from about 165 per 100,000 population in 2000 to 130 per 100,000 population in 2010. Although there was some variation across years, the rate of adult asthma-related hospital stays remained relatively unchanged between 2000 and 2010 at about 119 hospital stays per 100,000 population. The rate of pediatric hospital stays was higher than the rate of adult hospital stays for asthma from 2000 through 2005; pediatric and adult rates were similar from 2006 through 2010. |
|
|
Figure 1. Trends in the rate of hospital stays for asthma per 100,000 population for children and adults, 2000—2010
Note: Rates are adjusted for age and sex. Figure 1 is a line graph showing the number of hospital stays for asthma per 100,000 population by year for children and adults. Children aged 2—17 years: 2000: 165, 2001: 148, 2002: 149, 2003: 178, 2004: 156, 2005: 165, 2006: 144, 2007: 132, 2008: 118, 2009: 145, 2010: 130. Adults aged 18 years and older: 2000: 112, 2001: 113, 2002: 120, 2003: 136, 2004: 120, 2005: 127, 2006: 124, 2007: 118, 2008: 125, 2009: 131. 2010: 119. |
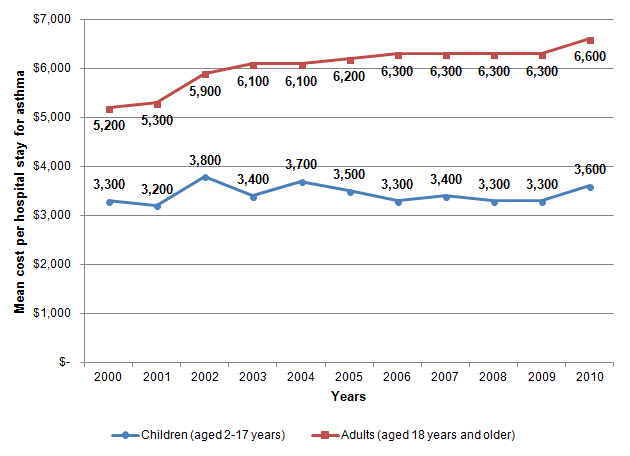
Average cost of pediatric and adult hospital stays for asthma, 2000—2010 Figure 2 displays the average inflation-adjusted cost of hospital stays for asthma from 2000 through 2010 for children (aged 2—17 years) and adults (aged 18 years and older). The average cost per hospital stay for children with asthma remained relatively stable at about $3,600 from 2000 to 2010. During this same period, the average cost per adult asthma-related hospital stay increased from $5,200 to $6,600. The average cost per hospital stay for asthma was consistently higher for adults than children across all years. |
|
Figure 2. Trends in the average cost of hospital stays for asthma for children and adults, 2000—2010
Note: Costs were adjusted for inflation to 2010 using the price index for the gross domestic product. Figure 2 is a line graph showing the mean cost per hospital stay for asthma by year for children and adults. Children aged 2—17 years: 2000: 3,300, 2001: 3,200, 2002: 3,800, 2003: 3,400, 2004: 3,700, 2005: 3,500, 2006: 3,300, 2007: 3,400 , 2008: 3,300, 2009: 3,300, 2010: 3,600. Adults aged 18 years and older: 2000: 5,200, 2001: 5,300, 2002: 5,900, 2003: 6,100, 2004: 6,100, 2005: 6,200, 2006: 6,300, 2007: 6,300, 2008: 6,300, 2009: 6,300, 2010: 6,600. |
Rate of pediatric and adult hospital stays for asthma by patient characteristics, 2010 Table 1 displays the rate of asthma-related hospital stays for children and adults by patient characteristics. In 2010, the rate of hospital stays for asthma was similar for children (129.7 per 100,000 population) and adults (119.3 per 100,000 population). Among children, the rate of hospital stays for asthma was 54 percent higher for males than females (156.5 versus 101.7 stays per 100,000 population). This pattern was reversed among adults: females had a 129 percent higher rate of hospital stays than males (163.0 versus 71.2 hospital stays per 100,000 population). Across both age groups, African American and Hispanic patients had higher rates of asthma relative to White and Asian and Pacific Islander patients in 2010. Notably, hospitalization rates were more than three times higher for African American children and two times higher for African American adults compared with White and with Asian and Pacific Islander patients. Pediatric and adult patients in the lowest income communities had higher rates of hospital stays for asthma than those in the highest income communities. |
| Table 1. Adjusted rate of hospital stays for asthma per 100,000 population for children and adults, 2010 | ||
| Patient characteristic | Hospital stays for asthma per 100,000 population | |
|---|---|---|
| Children (aged 2—17 years) | Adults (aged 18 years and older) | |
| Total U.S. | 129.7 | 119.3 |
| Sex | ||
| Male | 156.5 | 71.2 |
| Female | 101.7 | 163.0 |
| Race/ethnicity | ||
| Non-Hispanic | ||
| White | 83.8 | 90.5 |
| African American | 363.9 | 297.9 |
| Asian and Pacific Islander | 78.2 | 65.4 |
| Hispanic (of any race) | 128.8 | 144.6 |
| Community-level income | ||
| First quartile (lowest income) | 182.8 | 194.3 |
| Second quartile | 123.7 | 117.4 |
| Third quartile | 113.9 | 100.0 |
| Fourth quartile (highest income) | 95.2 | 72.6 |
| Location of patient residence | ||
| Large metropolitan | 140.6 | 139.1 |
| Small metropolitan | 124.9 | 94.5 |
| Micropolitan | 97.6 | 99.2 |
| Not metropolitan or micropolitan | 104.0 | 110.0 |
| Location of inpatient treatment | ||
| Northeast | 176.8 | 167.6 |
| Midwest | 104.6 | 120.5 |
| South | 130.3 | 120.8 |
| West | 119.7 | 76.5 |
| Note: Rates are adjusted for age and sex. Source: Agency for Healthcare Research and Quality (AHRQ), Center for Delivery, Organization, and Markets, Healthcare Cost and Utilization Project (HCUP), Nationwide Inpatient Sample (NIS) and State Inpatient Databases (SID) disparities analytic file, 2010, and AHRQ Prevention Quality Indicators (PQIs) |
||
Adults residing in large metropolitan areas had a higher rate of hospital stays for asthma (139.1 per 100,000 population) than adults residing in other areas. Children residing in large metropolitan areas had a higher rate of hospital stays for asthma (140.6 per 100,000 population) than children residing in micropolitan areas only (97.6 per 100,000 population). Adults treated in the Northeast had a higher rate of hospital stays for asthma (167.6 per 100,000 population) than adults in other Census regions. Children treated in the Northeast had a significantly higher rate of hospital stays for asthma (176.8 per 100,000 population) than children treated in the Midwest only (104.6 per 100,000 population).
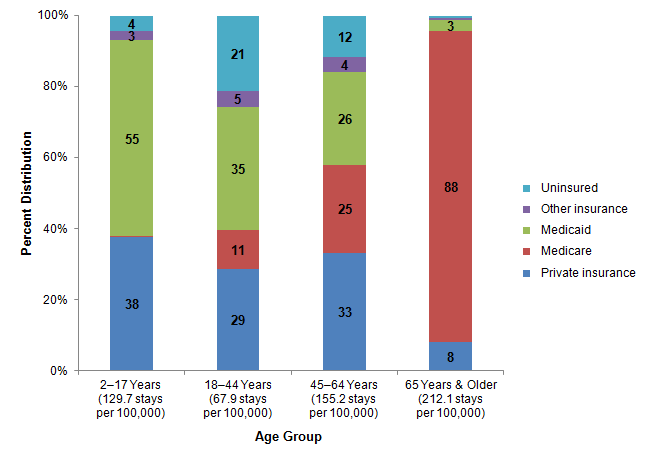
Distribution of stays by age group and expected primary payer, 2010 Figure 3 shows that Medicaid was the largest expected primary payer of hospital stays for asthma among children aged 2—17 years (55 percent) and adults aged 18—44 years (35 percent). Private insurance was the second largest primary payer of hospital stays for asthma among these same two age groups (children, 38 percent; adults aged 18—44 years, 29 percent). Among adults aged 45—64 years, private insurance was the payer for one-third of all asthma-related hospital stays, and Medicaid and Medicare each were payers for about one-fourth of these stays. Among patients aged 65 years and older, nearly 9 out of 10 hospital stays for asthma were billed to Medicare. The proportion of asthma-related hospital stays that were uninsured was highest among patients aged 18—44 years (21 percent), followed by patients aged 45—64 years (12 percent). |
|
Figure 3. Distribution of hospital stays for asthma by age group and primary expected payer, 2010
Note: Percentages less than 2 percent are not labeled. The Medicare percentage for children aged 2—17 years is not visible because it is only 0.2 percent. Figure 3 is a stacked bar graph showing the percent distribution by age group. Age group 2—17 years (129.7 stays per 100,000): Private insurance, 38, Medicare, less than 2, Medicaid, 55, Other insurance, 3, Uninsured, 4. Age group 18—44 years (67.9 stays per 100,000): Private insurance, 29, Medicare, 11, Medicaid, 35, Other insurance, 5, Uninsured, 21. Age group 45—64 years (155.2 stays per 100,000): Private insurance, 33, Medicare, 25, Medicaid, 26, Other insurance, 4, Uninsured, 12. Age group 65 years and older (212.1 stays per 100,000): Private insurance, 8m, Medicare, 88, Medicaid, 3, Other insurance, less than 2, Uninsured, less than 2. |
Data Source
The estimates in this Statistical Brief are based upon data from the Healthcare Cost and Utilization Project (HCUP) 2000—2010 Nationwide Inpatient Sample (NIS) and a 2010 disparities analysis file (see description below) created from the State Inpatient Databases (SID). The disparities analysis file is designed to provide national estimates on racial disparities using weighted records from a sample of hospitals in the SID. Differences that are noted in the text exhibit at least a 10 percent difference between estimates and achieved a level of statistical significance of 0.05 or better. State Inpatient Databases disparities analysis file Measures of race and ethnicity can be problematic in hospital discharge databases. Some States do not collect information on race and ethnicity from hospitals and, within States that collect the information, some hospitals do not code race and ethnicity reliably. A disparities analysis file designed to provide national estimates by race and ethnicity was constructed using the HCUP SID from participating States that report patient race and ethnicity. This file was created using a stratified, weighted sample of hospitals with good reporting of these measures. It contains data from about 2,000 hospitals and is a 40-percent sample of community, nonrehabilitation hospitals in the United States. For 2010, SID data from the following 37 States were used: Alaska, Arizona, Arkansas, California, Colorado, Connecticut, Florida, Georgia, Hawaii, Illinois, Indiana, Iowa, Kansas, Kentucky, Maryland, Massachusetts, Michigan, Montana, Mississippi, Nevada, New Jersey, New Mexico, New York, North Carolina, Oklahoma, Oregon, Pennsylvania, Rhode Island, South Carolina, South Dakota, Tennessee, Texas, Utah, Virginia, Vermont, Wisconsin, and Wyoming. Definitions Diagnoses and ICD-9-CM The principal diagnosis is that condition established after study to be chiefly responsible for the patient's admission to the hospital. Secondary diagnoses are concomitant conditions that coexist at the time of admission or develop during the stay. ICD-9-CM is the International Classification of Diseases, Ninth Revision, Clinical Modification, which assigns numeric codes to diagnoses. There are approximately 14,000 ICD-9-CM diagnosis codes. Case definition: asthma Rates of asthma hospital stays for adults and children were based on the AHRQ Prevention Quality Indicators (PQIs) for asthma (PQI #15 for adults and PDI #14 for children), version 4.1. Rates were adjusted by age and sex using the 2000 United States population as the standard.4 The numerator (outcome of interest) of the rate included the following:
Prevention Quality Indicators The Prevention Quality Indicators (PQIs; version 4.1), a component of the AHRQ Quality Indicators (QIs), are a set of measures that can be used with hospital inpatient hospital stay data to identify access to and quality of care for ambulatory care-sensitive conditions. These are conditions for which good outpatient care can potentially prevent the need for hospitalization or for which early intervention can prevent complications or more severe disease. PQI rates can also be affected by other factors such as disease prevalence. The PQIs are adjusted for age and sex. Further information on the AHRQ QIs, including documentation and free software downloads, is available at http://www.qualityindicators.ahrq.gov/. It also includes information on the Pediatric Quality Indicators (PDIs, formerly referred to as PedQIs). The PDIs contain measures of potentially preventable hospitalizations for children for asthma, gastroenteritis, diabetes short-term complications, and perforated appendix. Additional information on how the QI software was applied to the HCUP data for the statistics reported in this Statistical Brief is available in Coffey et al., 2012.5 Types of hospitals included in HCUP HCUP is based on data from community hospitals, which are defined as short-term, non-Federal, general, and other hospitals, excluding hospital units of other institutions (e.g., prisons). HCUP data include obstetrics and gynecology, otolaryngology, orthopedic, cancer, pediatric, public, and academic medical hospitals. Excluded are long-term care, rehabilitation, psychiatric, and alcoholism and chemical dependency hospitals. However, if a patient received long-term care, rehabilitation, or treatment for psychiatric or chemical dependency conditions in a community hospital, the hospital stay record for that stay will be included in the Nationwide Inpatient Sample (NIS) and the SID disparities analysis file. Unit of analysis The unit of analysis is the hospital hospital stay (i.e., the hospital stay), not a person or patient. This means that a person who is admitted to the hospital multiple times in one year will be counted each time as a separate "hospital stay" from the hospital. Costs and charges Total hospital charges were converted to costs using HCUP Cost-to-Charge Ratios based on hospital accounting reports from the Centers for Medicare & Medicaid Services (CMS).6 Costs will reflect the actual expenses incurred in the production of hospital services, such as wages, supplies, and utility costs; charges represent the amount a hospital billed for the case. For each hospital, a hospital-wide cost-to-charge ratio is used. Hospital charges reflect the amount the hospital billed for the entire hospital stay and do not include professional (physician) fees. For the purposes of this Statistical Brief, costs are reported to the nearest hundred. Costs were deflated to 2010 using the price index for the gross domestic product.7 Patients' race and ethnicity HCUP uniform coding includes race and ethnicity in one data element (RACE). Because of variability in the collection of race and ethnicity information in the State data provided to HCUP, HCUP maintains a uniform set of categories based on race definitions used in the 1977 Office of Management and Budget (OMB) Directive 15. It uses the combined race-ethnicity format (separate categories for Hispanic and five non-Hispanic racial groups—White, Black, Asian and Pacific Islander, American Indian or Alaska Native, and Other). When a State and its hospitals collect Hispanic ethnicity separately from race, HCUP assigns the data to the combined race and ethnicity categorization and uses Hispanic ethnicity to override any other race category to create uniform coding across States. There is limited reporting of American Indian or Alaska Native (AIAN) in the HCUP data, so statistics for this group were not presented. This Statistical Brief reports race and ethnicity for the following categories: White non-Hispanic, African American non-Hispanic, Asian or Pacific Islander non-Hispanic, and Hispanic (of any race). Median community-level income Median community-level income is the median household income of the patient's ZIP Code of residence. The cut-offs for the quartile designation are determined yearly using ZIP Code demographic data obtained from the Nielsen Company. The income quartile is set to the lowest income for homeless patients. Location of patients' residence Place of residence is based on a simplified adaptation of the 2003 version of the Urban Influence Codes (UIC). The 12 categories of the UIC are combined into four broader categories that differentiate between large metropolitan areas with a population of 1 million or more residents, small metropolitan areas with a population less than 1 million residents, micropolitan areas, and nonurban residual areas that are neither metropolitan or micropolitan. Location of inpatient treatment Location is based on the region of the treatment hospital and is one of the four regions defined by the U.S. Census Bureau:
Payer is the expected primary payer for the hospital stay. To make coding uniform across all HCUP data sources, payer combines detailed categories into general groups:
When more than one payer is listed for a hospital stay, the first-listed payer is used. About HCUP HCUP is a family of powerful healthcare databases, software tools, and products for advancing research. Sponsored by the Agency for Healthcare Research and Quality (AHRQ), HCUP includes the largest all-payer encounter-level collection of longitudinal healthcare data (inpatient, ambulatory surgery, and emergency department) in the United States, beginning in 1988. HCUP is a Federal-State-Industry Partnership that brings together the data collection efforts of many organizations—such as State data organizations, hospital associations, private data organizations, and the Federal government—to create a national information resource. HCUP would not be possible without the contributions of the following data collection Partners from across the United States: Alaska State Hospital and Nursing Home Association Arizona Department of Health Services Arkansas Department of Health California Office of Statewide Health Planning and Development Colorado Hospital Association Connecticut Hospital Association Florida Agency for Health Care Administration Georgia Hospital Association Hawaii Health Information Corporation Illinois Department of Public Health Indiana Hospital Association Iowa Hospital Association Kansas Hospital Association Kentucky Cabinet for Health and Family Services Louisiana Department of Health and Hospitals Maine Health Data Organization Maryland Health Services Cost Review Commission Massachusetts Center for Health Information and Analysis Michigan Health & Hospital Association Minnesota Hospital Association Mississippi Department of Health Missouri Hospital Industry Data Institute Montana MHA - An Association of Montana Health Care Providers Nebraska Hospital Association Nevada Department of Health and Human Services New Hampshire Department of Health & Human Services New Jersey Department of Health New Mexico Department of Health New York State Department of Health North Carolina Department of Health and Human Services North Dakota (data provided by the Minnesota Hospital Association) Ohio Hospital Association Oklahoma State Department of Health Oregon Association of Hospitals and Health Systems Oregon Health Policy and Research Pennsylvania Health Care Cost Containment Council Rhode Island Department of Health South Carolina Budget & Control Board South Dakota Association of Healthcare Organizations Tennessee Hospital Association Texas Department of State Health Services Utah Department of Health Vermont Association of Hospitals and Health Systems Virginia Health Information Washington State Department of Health West Virginia Health Care Authority Wisconsin Department of Health Services Wyoming Hospital Association About the NIS The HCUP Nationwide Inpatient Sample (NIS) is a nationwide database of hospital inpatient stays. The NIS is nationally representative of all community hospitals (i.e., short-term, non-Federal, nonrehabilitation hospitals). The NIS is a sample of hospitals and includes all patients from each hospital, regardless of payer. It is drawn from a sampling frame that contains hospitals comprising more than 95 percent of all discharges in the United States. The vast size of the NIS allows the study of topics at both the national and regional levels for specific subgroups of patients. In addition, NIS data are standardized across years to facilitate ease of use. About the SID The HCUP State Inpatient Databases (SID) are hospital inpatient databases from data organizations participating in HCUP. The SID contain the universe of the inpatient discharge abstracts in the participating HCUP States, translated into a uniform format to facilitate multistate comparisons and analyses. Together, the SID encompass more than 95 of all U.S. community hospital discharges in 2011. The SID can be used to investigate questions unique to one State, to compare data from two or more States, to conduct market area variation analyses, and to identify State-specific trends in inpatient care utilization, access, charges, and outcomes. About HCUPnet HCUPnet is an online query system that offers instant access to the largest set of all-payer healthcare databases publicly available. HCUPnet has an easy step-by-step query system, allowing for tables and graphs to be generated on national and regional statistics as well as trends for community hospitals in the United States. HCUPnet generates statistics using data from HCUP's Nationwide Inpatient Sample (NIS), the Kids' Inpatient Database (KID), the Nationwide Emergency Department Sample (NEDS), the State Inpatient Databases (SID), and the State Emergency Department Databases (SEDD). For More Information For more information about HCUP, visit http://www.hcup-us.ahrq.gov/. For additional HCUP statistics, visit HCUPnet, our interactive query system, at https://datatools.ahrq.gov/hcupnet. For information on other hospitalizations in the United States, refer to the following HCUP Statistical Briefs located at http://www.hcup-us.ahrq.gov/reports/statbriefs/statbriefs.jsp:
Introduction to the HCUP Nationwide Inpatient Sample, 2011. Online. June 2013. U.S. Agency for Healthcare Research and Quality. https://www.hcup-us.ahrq.gov/db/nation/nis/NIS_Introduction_2011.pdf. Accessed December 4, 2013. Introduction to the HCUP State Inpatient Databases, 2011. Online. August 2013. U.S. Agency for Healthcare Research and Quality. http://www.hcup-us.ahrq.gov/db/state/siddist/Introduction_to_SID.pdf. Accessed December 4, 2013. Houchens R, Elixhauser A. Final Report on Calculating Nationwide Inpatient Sample (NIS) Variances, 2001. HCUP Methods Series Report #2003-2. Online. June 2005 (revised June 6, 2005). U.S. Agency for Healthcare Research and Quality. http://www.hcup-us.ahrq.gov/reports/methods/2003_02.pdf. Accessed December 4, 2013. Houchens RL, Elixhauser A. Using the HCUP Nationwide Inpatient Sample to Estimate Trends. (Updated for 1988–2004). HCUP Methods Series Report #2006–05. Online. August 18, 2006. U.S. Agency for Healthcare Research and Quality. http://www.hcup-us.ahrq.gov/reports/methods/2006_05_NISTrendsReport_1988-2004.pdf. Accessed December 4, 2013. Suggested Citation Barrett ML (ML Barrett, Inc), Wier LM (Truven Health Analytics), and Washington R (AHRQ). Trends in Pediatric and Adult Hospital Stays for Asthma, 2000-2010. HCUP Statistical Brief #169. January 2014. Agency for Healthcare Research and Quality, Rockville, MD. http://www.hcup-us.ahrq.gov/reports/statbriefs/sb169-Asthma-Trends-Hospital-Stays.pdf. *** AHRQ welcomes questions and comments from readers of this publication who are interested in obtaining more information about access, cost, use, financing, and quality of healthcare in the United States. We also invite you to tell us how you are using this Statistical Brief and other HCUP data and tools, and to share suggestions on how HCUP products might be enhanced to further meet your needs. Please e-mail us at hcup@ahrq.gov or send a letter to the address below:Irene Fraser, Ph.D., Director Center for Delivery, Organization, and Markets Agency for Healthcare Research and Quality 540 Gaither Road Rockville, MD 20850 1 U.S. Department of Health and Human Services (HHS). Expert Panel Report 3: Guidelines for the Diagnosis and Management of Asthma. Publication No. 07—4051. Bethesda, MD: HHS, National Heart, Lung and Blood Institute, National Institutes of Health; 2007. 2 Akinbami LJ, Moorman JE, Bailey C, Zahran HS, King M, Johnson CA, et al. Trends in Asthma Prevalence, Health Care Use, and Mortality in the United States, 2001—2010. NCHS Data Brief No. 94. Hyattsville, MD: National Center for Health Statistics; May 2012. 3 Consistent with the AHRQ Quality Indicator for pediatric asthma, hospital stays for patients younger than 2 years were excluded because an asthma diagnosis in younger children may be difficult to distinguish from bronchospasm. 4 U.S. Census Bureau, Population Division. Intercensal Estimates of the Resident Population by Single Year of Age, Sex, Race,and Hispanic Origin for the United States: April 1, 2000 to July 1, 2010. September 2011. https://www.census.gov/data/datasets/time-series/demo/popest/intercensal-2000-2010-national.html. Coffey R, Barrett M, Houchens R, Moy E, Andrews R, Coenen N. Methods Applying AHRQ Quality Indicators to Healthcare Cost and Utilization Project (HCUP) Data for the Eleventh (2013) National Healthcare Quality Report (NHQR) and National Healthcare Disparities Report (NHDR). HCUP Methods Series Report #2012-03. Online. November 12, 2012. U.S. Agency for Healthcare Research and Quality. http://www.hcup-us.ahrq.gov/reports/methods/2012_03.pdf. Accessed December 4, 2013. 5 Coffey R, Barrett M, Houchens R, Moy E, Andrews R, Coenen N. Methods Applying AHRQ Quality Indicators to Healthcare Cost and Utilization Project (HCUP) Data for the Eleventh (2013) National Healthcare Quality Report (NHQR) and National Healthcare Disparities Report (NHDR). HCUP Methods Series Report #2012-03. Online. November 12, 2012. U.S. Agency for Healthcare Research and Quality. http://www.hcup-us.ahrq.gov/reports/methods/2012_03.pdf. Accessed December 4, 2013. 6 HCUP Cost-to-Charge Ratio Files (CCR). Healthcare Cost and Utilization Project (HCUP). 2001-2009. U.S. Agency for Healthcare Research and Quality, Rockville, MD. Updated August 2013. http://www.hcup-us.ahrq.gov/db/state/costtocharge.jsp. Accessed December 17, 2013. 7 U.S. Department of Commerce Bureau of Economic Analysis. National Income and Product Accounts Tables. Section 1, Domestic Product and Income. http://www.bea.gov/iTable/iTable.cfm?ReqID=9&step=1#. Accessed December 4, 2013. |
| Internet Citation: Statistical Brief #169. Healthcare Cost and Utilization Project (HCUP). September 2025. Agency for Healthcare Research and Quality, Rockville, MD. hcup-us.ahrq.gov/reports/statbriefs/sb169-Asthma-Trends-Hospital-Stays.jsp. |
| Are you having problems viewing or printing pages on this website? |
| If you have comments, suggestions, and/or questions, please contact hcup@ahrq.gov. |
| If you are experiencing issues related to Section 508 accessibility of information on this website, please contact hcup@ahrq.gov. |
| Privacy Notice, Viewers & Players |
| Last modified 9/3/25 |