STATISTICAL BRIEF #167 |
November 2013
Raynard E. Washington, Ph.D., Roxanne M. Andrews, Ph.D., and Ryan Mutter, Ph.D. Introduction Diabetes is a critical public health concern in the United States. It is estimated that diabetes affects approximately 25.8 million Americans (8.9 percent of the population), and its incidence continues to rise annually.1 Diabetes and its associated complications are significant sources of hospitalization and medical expenditures.1,2 Patients with poor blood glucose control and overall diabetes management have significantly greater risk of acute and chronic complications, including cardiovascular, kidney, eye, and nerve diseases.3 Emergency department (ED) utilization among patients with diabetes is likely affected by several factors, including lack of primary care, poor adherence to care plans and lifestyle modifications, and presence of complications. This Statistical Brief presents data from the Healthcare Cost and Utilization Project (HCUP) on ED visits among patients aged 18 years and older with diabetes in 2010. Variations in ED visit rates for patients with diabetes overall, ED visits resulting in treatment and release, and ED visits resulting in subsequent admission to the hospital are presented across patient demographics. The most common diagnoses for ED visits by patients with uncomplicated and complicated diabetes are shown, as is the variation in disposition from the ED by presence of diabetic complications. All differences between estimates noted in the text are statistically significant at the 0.05 level or better. Findings General Findings In 2010, there were approximately 12.1 million diabetes-related ED visits for adults (defined as having a diabetes diagnosis documented in the patient's discharge record), or about 9.4 percent of all ED visits for adults. This translates to approximately 515 visits per 10,000 U.S. population. Most of these visits were ED treatment and release (57.9 percent); the remaining (42.1 percent) resulted in a hospitalization at the same facility. In comparison, only 15.3 percent of all adult ED visits (for patients with and without diabetes) resulted in a hospitalization. Characteristics of patients with diabetes who were seen in the ED are presented in Table 1 for all ED visits and by discharge status (i.e., admitted versus treated and released). Adults aged 65 years and older accounted for the largest proportion of diabetes-related ED visits (43.6 percent) and had the highest rate of diabetes-related ED visits (1,307 per 10,000 U.S. population). This older population also represented a greater proportion of diabetes-related ED visits that resulted in hospitalization, whereas treat-and-release ED visits were more common among individuals aged 45-64 years. Females constituted approximately 55 percent of diabetes-related ED visits. Diabetes-related ED visit rates were highest from lower income (526 per 10,000 U.S. population) and rural communities (455 per 10,000). The West had the lowest rate of diabetes-related ED visits (299 per 10,000 U.S. population) compared with the other regions. The rate of diabetes-related ED visits that resulted in a hospital admission was similar across the metropolitan and rural areas; however, the rate of diabetes-related ED visits that were treated and released was higher for patients from rural areas (296 per 10,000 U.S. population) compared with large (184 per 10,000 U.S. population) and small (263 per 10,000 U.S. population) metropolitan regions. |
|
| Table 1. Diabetes-relateda emergency department (ED) visits for patients aged 18 years and older, 2010 | ||||||
| Characteristic | All diabetes-related ED visits N=12,128,000 |
Diabetes-related ED visits resulting in hospitalization n=5,110,000 |
Diabetes-related ED visits resulting in treatment and release n=7,018,000 |
|||
|---|---|---|---|---|---|---|
| Percent Distribution | Rate (per 10,000) | Percent Distribution | Rate (per 10,000) | Percent Distribution | Rate (per 10,000) | |
| Ageb | ||||||
| 18-44 | 17.0 | 183 | 9.9 | 45 | 22.1 | 137 |
| 45-64 | 39.4 | 584 | 34.8 | 218 | 42.8 | 367 |
| ≥65 | 43.6 | 1,307 | 55.2 | 698 | 35.1 | 609 |
| Sexb | ||||||
| Male | 44.7 | 475 | 47.3 | 212 | 42.8 | 263 |
| Female | 55.3 | 554 | 52.7 | 223 | 57.2 | 332 |
| Community Income | ||||||
| 1st Quartile (Low) | 34.9 | 526 | 32.3 | 204 | 36.8 | 321 |
| 2nd Quartile | 28.1 | 440 | 26.8 | 176 | 29.1 | 264 |
| 3rd Quartile | 21.4 | 330 | 22.7 | 147 | 20.5 | 183 |
| 4th Quartile (High) | 15.6 | 236 | 18.2 | 116 | 13.7 | 120 |
| Patient Residenceb | ||||||
| Large Metro | 47.9 | 348 | 53.5 | 164 | 43.7 | 184 |
| Small Metro | 33.1 | 432 | 30.6 | 168 | 34.8 | 263 |
| Rural | 19.1 | 455 | 15.9 | 160 | 21.4 | 296 |
| Region | ||||||
| Northeast | 16.7 | 366 | 20.0 | 185 | 14.3 | 181 |
| Midwest | 23.2 | 421 | 22.2 | 170 | 23.9 | 251 |
| South | 42.3 | 447 | 40.3 | 179 | 43.8 | 268 |
| West | 17.8 | 299 | 17.5 | 124 | 18.0 | 175 |
| a Diabetes mellitus appears as a diagnosis on the discharge record. b p<0.05 (Chi-square comparing proportion of admitted versus treat-and-release visits) Source: Agency for Healthcare Research and Quality (AHRQ), Center for Delivery, Organization, and Markets, Healthcare Cost and Utilization Project (HCUP), Nationwide Emergency Department Sample (NEDS), 2010 |
||||||
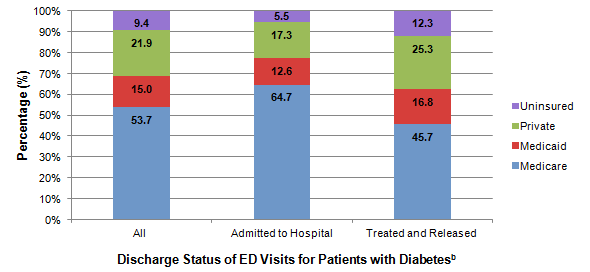
Figure 1 shows the expected primary payer for diabetes-related ED visits among adults. The payer distribution is different between the two types of ED visits—those resulting in a hospital admission and those being treated and released. Although Medicare was the most common expected primary payer (53.7 percent) for diabetes-related ED visits in general, this payer accounted for a larger proportion of ED visits that resulted in admission (64.7 percent) compared with treat-and-release ED visits (45.7 percent). The opposite pattern was observed for the uninsured, which accounted for only 5.5 percent of diabetes-related ED visits resulting in a hospital admission compared with 12.3 percent of treat-and-release visits. Similarly, private insurers were the primary expected payer for a larger share of the treat-and-release ED visits (25.3 percent) compared to ED visits resulting in a hospital admission (17.3 percent).
|
|
Figure 1. Percentage of diabetes-relateda emergency department (ED) visits for patients aged 18 years and older by expected primary payer, 2010
a Diabetes mellitus appears as a diagnosis on the discharge record. This is a stacked bar chart showing the percentage for each expected primary payer by the discharge status of ED visits for patients with diabetes. All Discharges: Medicare, 53.7%; Medicaid, 15%; Private, 21.9%; Uninsured, 9.4%. Admitted to Hospital: Medicare, 64.7%; Medicaid, 12.6%; Private, 17.3%; Uninsured, 5.5%. Treated and Released: Medicare, 45.7%; Medicaid, 16.8%; Private, 25.3%; Uninsured, 12.3%. |
Types of diabetes-related diagnoses for ED visits among adults Patients with diabetes often experience short-term (acute) and long-term complications as a result of their condition. Table 2 lists the specific diabetes diagnoses seen in the ED. The majority of diabetes-related ED encounters included no mention of complications associated with diabetes (84.7 percent). Treat-and-release diabetes-related ED encounters were more frequently listed without any diabetes complications (91.7 percent) than visits that resulted in admission (75.1 percent). Among patients who are treated and released, the higher proportion of ED visits with no complications may reflect utilization of EDs for diabetes care and management, initial diagnosis of diabetes in the ED, or incomplete coding. These findings also suggest that ED visits involving diabetes complications are more likely to result in admission to the hospital than those without complications. Diabetes can affect several different body systems. Table 2 also includes information about different types of complications. The most common complication listed was other or unspecified complications (6.0 percent of all diabetes-related ED visits), followed by neurological (5.6 percent) and renal (3.4 percent) complications. Among ED visits that resulted in hospitalization, neurological complications were the most common (10.2 percent of diabetes-related ED visits). |
| Table 2. Types of diabetes-relateda diagnoses (all-listed) during emergency department (ED) visits for patients aged 18 years and older | ||||||
| All-listed condition (ICD-9-CM code) | All diabetes-related ED visits | Diabetes-related ED visits resulting in hospitalization | Diabetes-related ED visits resulting in treatment and release | |||
|---|---|---|---|---|---|---|
| Number of visits in thousands | Percent Distribution | Number of visits in thousands | Percent Distribution | Number of visits in thousands | Percent Distribution | |
| All diabetes | 12,128 | 100 | 5,110 | 100 | 7,018 | 100 |
| Diabetes with no mention of complicationsb | 10,273 | 84.7 | 3,839 | 75.1 | 6,434 | 91.7 |
| Diabetes with complicationsb,c | 1,855 | 15.3 | 1,271 | 24.9 | 584 | 8.3 |
| Other or unspecified complications | 723 | 6.0 | 371 | 7.3 | 352 | 5.0 |
| Neurological complications | 675 | 5.6 | 521 | 10.2 | 154 | 2.2 |
| Renal complications | 410 | 3.4 | 345 | 6.7 | 65 | 0.9 |
| Acute complications | 223 | 1.8 | 199 | 3.9 | 24 | 0.3 |
| Eye complications | 186 | 1.5 | 148 | 2.9 | 38 | 0.5 |
| Peripheral circulatory complications | 94 | 0.8 | 78 | 1.5 | 16 | 0.2 |
| Abbreviation: ICD-9-CM, International Classification of Diseases, Ninth Revision, Clinical Modification a Diabetes mellitus appears as a diagnosis on the discharge record b p<0.05 (Chi-square comparing proportion of admitted versus treat-and-release visits) c Not mutually exclusive (i.e., visits may involve more than one complication) Note: Patients seen in the ED may not have diabetes complications documented in their discharge record if the information on complication status was not collected during the visit. These proportions reflect only those ED visits with complications recorded in the discharge record and do not suggest that patients with no mention of complications have no complications. Source: Agency for Healthcare Research and Quality (AHRQ), Center for Delivery, Organization, and Markets, Healthcare Cost and Utilization Project (HCUP), Nationwide Emergency Department Sample (NEDS), 2010 |
||||||
Most frequent primary reason for ED visits among adults with diabetes It is likely that patients with diabetes present to the ED for conditions unrelated to diabetes. Table 3 shows the most frequent first-listed conditions for ED visits for adults with diabetes. The first-listed condition may be interpreted as the primary reason for the ED visit. For patients admitted to the hospital, the first-listed condition is the principal diagnosis, which is defined as the chief reason for the hospital stay. The principal diagnosis is determined after evaluation during this stay. Diabetes with complications was the most common first-listed condition for diabetes-related ED visits among adults, accounting for 6.4 percent of diabetes-related ED visits (771,181) in 2010. Nonspecific chest pain was the second most common first-listed condition for diabetes-related ED visits (5.6 percent) and the most common first-listed condition for diabetes-related ED visits resulting in treatment and release. For treat-and-release diabetes-related ED visits, diabetes with complications (3.0 percent), abdominal pain (2.9 percent), and superficial injury/contusion (2.3 percent) were also top-ranking first-listed conditions. For admitted patients, other chronic conditions—particularly circulatory and respiratory-related conditions—accounted for the most frequent first-listed conditions. Notably, the top 10 first-listed conditions for all ED visits account for one-third of the ED visits. |
| Table 3. Most frequent first-listed conditions for diabetes-relateda emergency department (ED) visits for patients aged 18 years and older, 2010 | |||||||||
| First-listed condition | All diabetes-related ED visits | Diabetes-related ED visits resulting in hospitalization | Diabetes-related ED visits resulting in treatment and release | ||||||
|---|---|---|---|---|---|---|---|---|---|
| Number of visits in thousands | % | Rank | Number of visits in thousands | % | Rank | Number of visits in thousands | % | Rank | |
| Diabetes with complications | 771 | 6.4 | 1 | 413 | 3.4 | 1 | 358 | 3.0 | 2 |
| Nonspecific chest pain | 681 | 5.6 | 2 | 180 | 1.5 | 5 | 501 | 4.1 | 1 |
| Congestive heart failure | 395 | 3.3 | 3 | 338 | 2.8 | 2 | 58 | 0.5 | - |
| Abdominal pain | 384 | 3.2 | 4 | 30 | 0.2 | - | 355 | 2.9 | 3 |
| Urinary tract infection | 345 | 2.8 | 5 | 148 | 1.2 | 9 | 197 | 1.6 | 9 |
| Skin and subcutaneous tissue infection | 342 | 2.8 | 6 | 134 | 1.1 | - | 208 | 1.7 | 8 |
| Chronic obstructive pulmonary disease and bronchiectasis | 295 | 2.4 | 7 | 166 | 1.5 | 6 | 129 | 1.1 | - |
| Superficial injury; contusion | 284 | 2.4 | 8 | 8 | <0.1 | - | 277 | 2.3 | 4 |
| Diabetes without complications | 278 | 2.3 | 9 | 12 | 0.1 | - | 266 | 2.2 | 5 |
| Spondylosis/intervertebral disc disorders; other back problems | 274 | 2.3 | 10 | 33 | 0.3 | - | 241 | 2.0 | 7 |
| Septicemia | 242 | 2.0 | - | 237 | 2.0 | 3 | 5 | <0.1 | - |
| Pneumonia | 273 | 2.2 | - | 216 | 1.8 | 4 | 57 | 0.5 | - |
| Acute cerebrovascular disease | 176 | 1.5 | - | 155 | 1.3 | 7 | 22 | 0.2 | - |
| Acute myocardial infarction | 169 | 1.4 | - | 151 | 1.2 | 8 | 18 | 0.1 | - |
| Acute and unspecified renal failure | 145 | 1.2 | - | 135 | 1.1 | 10 | 9 | 0.1 | - |
| Sprains and strains | 266 | 2.2 | - | 4 | <0.1 | - | 262 | 2.2 | 6 |
| Other disconnective tissue disease | 201 | 1.7 | - | 25 | 0.2 | - | 176 | 1.5 | 10 |
| a Diabetes mellitus appears as a diagnosis on the discharge record. Note: Percent of all ED visits among patients with diabetes Source: Agency for Healthcare Research and Quality (AHRQ), Center for Delivery, Organization, and Markets, Healthcare Cost and Utilization Project (HCUP), Nationwide Emergency Department Sample (NEDS), 2010 |
|||||||||
Data Source
The estimates in this Statistical Brief are based upon data from the Healthcare Cost and Utilization Project (HCUP) 2010 Nationwide Emergency Department Sample (NEDS). Supplemental sources included population denominator data for use with HCUP database4 Definitions Diagnoses, ICD-9-CM, and Clinical Classifications Software (CCS) ICD-9-CM is the International Classification of Diseases, Ninth Revision, Clinical Modification, which assigns numeric codes to diagnoses. There are approximately 14,000 ICD-9-CM diagnosis codes. The following ICD-9-CM codes were used to identify patients with diabetes. "All-listed" refers to the occurrence of one or more of these codes in any diagnosis field, and "first-listed" refers to the occurrence of one or more of these codes in the first diagnosis field. |
| Description | ICD-9-CM Code |
|---|---|
| Uncontrolled diabetes without mention of complications | 250.0x |
| Diabetes with acute complications | 250.1x-250.3x |
| Diabetes with renal complications | 250.4x |
| Diabetes with eye complications | 250.5x |
| Diabetes with neurological complications | 250.6x |
| Diabetes with peripheral circulatory complications | 250.7x |
| Diabetes with other or unspecified complications | 250.8x-250.9x |
CCS categorizes ICD-9-CM diagnoses into a manageable number of clinically meaningful categories.5 This "clinical grouper" makes it easier to quickly understand patterns of diagnoses. CCS categories identified as "Other" typically are not reported; these categories include miscellaneous, otherwise unclassifiable diagnoses that may be difficult to interpret as a group. CCS categories were used in this Statistical Brief to identify the most common first-listed diagnoses for patients with diabetes. The corresponding CCS codes and descriptions are shown below.
|
| CCS Code | CCS Description |
|---|---|
| 2 | Septicemia |
| 49 | Diabetes without complications |
| 50 | Diabetes with complications |
| 100 | Acute myocardial infarction |
| 102 | Nonspecific chest pain |
| 108 | Congestive heart failure |
| 109 | Acute cerebrovascular disease |
| 122 | Pneumonia |
| 127 | Chronic obstructive pulmonary disease and bronchiectasis |
| 157 | Acute and unspecified renal failure |
| 159 | Urinary tract infection |
| 197 | Skin and subcutaneous tissue infection |
| 205 | Spondylosis/intervertebral disc disorders; other back problems |
| 211 | Other disconnective tissue disease |
| 232 | Sprains and strains |
| 239 | Superficial injury; contusion |
| 251 | Abdominal pain |
Types of hospitals included in HCUP HCUP is based on data from community hospitals, which are defined as short-term, non-Federal, general, and other hospitals, excluding hospital units of other institutions (e.g., prisons). HCUP data include obstetrics and gynecology, otolaryngology, orthopedic, cancer, pediatric, public, and academic medical hospitals. Excluded are long-term care, rehabilitation, psychiatric, and alcoholism and chemical dependency hospitals. Community hospitals included in the Nationwide Emergency Department Sample (NEDS) have hospital-based emergency departments and no more than 90 percent of their ED visits resulting in admission. Unit of analysis The unit of analysis is the emergency department (ED) encounter, not a person or patient. This means that a person who is seen in the ED multiple times in one year will be counted each time as a separate "encounter" in the ED. Location of patients' residence Place of residence is based on the urban-rural classification scheme for U.S. counties developed by the National Center for Health Statistics (NCHS). For this Statistical Brief, we collapsed the NCHS categories into either large metropolitan, small metropolitan, or rural according to the following:
Median community-level income is the median household income of the patient's ZIP Code of residence. The cut-offs for the quartile designation are determined using ZIP Code demographic data obtained from the Nielsen Company. The income quartile is missing for homeless and foreign patients. Payer Payer is the expected primary payer for the ED visit or hospital discharge. To make coding uniform across all HCUP data sources, payer combines detailed categories into general groups:
Region Region is one of the four regions defined by the U.S. Census Bureau—
HCUP is a family of powerful healthcare databases, software tools, and products for advancing research. Sponsored by the Agency for Healthcare Research and Quality (AHRQ), HCUP includes the largest all-payer encounter-level collection of longitudinal healthcare data (inpatient, ambulatory surgery, and emergency department) in the United States, beginning in 1988. HCUP is a Federal-State-Industry Partnership that brings together the data collection efforts of many organizations—such as State data organizations, hospital associations, private data organizations, and the Federal government—to create a national information resource. HCUP would not be possible without the contributions of the following data collection Partners from across the United States: Alaska State Hospital and Nursing Home Association Arizona Department of Health Services Arkansas Department of Health California Office of Statewide Health Planning and Development Colorado Hospital Association Connecticut Hospital Association Florida Agency for Health Care Administration Georgia Hospital Association Hawaii Health Information Corporation Illinois Department of Public Health Indiana Hospital Association Iowa Hospital Association Kansas Hospital Association Kentucky Cabinet for Health and Family Services Louisiana Department of Health and Hospitals Maine Health Data Organization Maryland Health Services Cost Review Commission Massachusetts Center for Health Information and Analysis Michigan Health & Hospital Association Minnesota Hospital Association Mississippi Department of Health Missouri Hospital Industry Data Institute Montana MHA - An Association of Montana Health Care Providers Nebraska Hospital Association Nevada Department of Health and Human Services New Hampshire Department of Health & Human Services New Jersey Department of Health New Mexico Department of Health New York State Department of Health North Carolina Department of Health and Human Services North Dakota (data provided by the Minnesota Hospital Association) Ohio Hospital Association Oklahoma State Department of Health Oregon Association of Hospitals and Health Systems Oregon Health Policy and Research Pennsylvania Health Care Cost Containment Council Rhode Island Department of Health South Carolina Budget & Control Board South Dakota Association of Healthcare Organizations Tennessee Hospital Association Texas Department of State Health Services Utah Department of Health Vermont Association of Hospitals and Health Systems Virginia Health Information Washington State Department of Health West Virginia Health Care Authority Wisconsin Department of Health Services Wyoming Hospital Association About the NEDS The HCUP Nationwide Emergency Department Database (NEDS) is a unique and powerful database that yields national estimates of emergency department (ED) visits. The NEDS was constructed using records from both the HCUP State Emergency Department Databases (SEDD) and the State Inpatient Databases (SID). The SEDD capture information on ED visits that do not result in an admission (i.e., treat-and-release visits and transfers to another hospital); the SID contain information on patients initially seen in the emergency room and then admitted to the same hospital. The NEDS was created to enable analyses of ED utilization patterns and support public health professionals, administrators, policymakers, and clinicians in their decision making regarding this critical source of care. The NEDS is produced annually beginning in 2006. About HCUPnet HCUPnet is an online query system that offers instant access to the largest set of all-payer healthcare databases publicly available. HCUPnet has an easy step-by-step query system, allowing for tables and graphs to be generated on national and regional statistics as well as trends for community hospitals in the United States. HCUPnet generates statistics using data from HCUP's Nationwide Inpatient Sample (NIS), the Kids' Inpatient Database (KID), the Nationwide Emergency Department Sample (NEDS), the State Inpatient Databases (SID), and the State Emergency Department Databases (SEDD). For More Information For more information about HCUP, visit http://www.hcup-us.ahrq.gov/. For additional HCUP statistics, visit HCUPnet, our interactive query system, at https://datatools.ahrq.gov/hcupnet. For information on other hospitalizations in the United States, refer to the following HCUP Statistical Briefs located at http://www.hcup-us.ahrq.gov/reports/statbriefs/statbriefs.jsp: .
Introduction to the HCUP Nationwide Emergency Department Sample, 2010. Online. November 2012. U.S. Agency for Healthcare Research and Quality. http://hcup-us.ahrq.gov/db/nation/neds/NEDS2010Introductionv3.pdf. Accessed October 9, 2013. Introduction to the HCUP State Emergency Department Databases. Online. December 2012. U.S. Agency for Healthcare Research and Quality. http://hcup-us.ahrq.gov/db/state/sedddist/Introduction_to_SEDD.pdf. Accessed October 9, 2013. Suggested Citation Washington RE (AHRQ), Andrews RM (AHRQ), Mutter RL (AHRQ). Emergency Department Visits for Adults with Diabetes, 2010. HCUP Statistical Brief #167. November 2013. Agency for Healthcare Research and Quality, Rockville, MD. http://www.hcup-us.ahrq.gov/reports/statbriefs/sb167.pdf. *** AHRQ welcomes questions and comments from readers of this publication who are interested in obtaining more information about access, cost, use, financing, and quality of healthcare in the United States. We also invite you to tell us how you are using this Statistical Brief and other HCUP data and tools, and to share suggestions on how HCUP products might be enhanced to further meet your needs. Please e-mail us at hcup@ahrq.gov or send a letter to the address below:Irene Fraser, Ph.D., Director Center for Delivery, Organization, and Markets Agency for Healthcare Research and Quality 540 Gaither Road Rockville, MD 20850 1 Centers for Disease Control and Prevention. National Diabetes Fact Sheet: National Estimates and General Information on Diabetes and Prediabetes in the United States, 2011. Atlanta, GA: U.S. Department of Health and Human Services, Centers for Disease Control and Prevention; 2011. 2 Fraze TK, Jiang HJ, Burgess J. Hospital Stays for Patients with Diabetes, 2008. HCUP Statistical Brief #93. August 2010. Agency for Healthcare Research and Quality, Rockville, MD. http://www.hcup-us.ahrq.gov/reports/statbriefs/sb93.pdf. 3 Diabetes Control and Complications Trial Research Group. The effect of intensive treatment of diabetes on the development and progression of long-term complications in insulin-dependent diabetes mellitus. New England Journal of Medicine. 1993;329(14):977—86. 4 Barrett M, Lopez-Gonzalez L, Coffey R, Levit K. Population Denominator Data for use with the HCUP Databases (Updated with 2012 Population data). HCUP Methods Series Report #2013-01. Online. March 8, 2013. U.S. Agency for Healthcare Research and Quality. http://www.hcup-us.ahrq.gov/reports/methods/2013_01.pdf. Accessed October 31, 2013. 5 HCUP Clinical Classifications Software (CCS). Healthcare Cost and Utilization Project (HCUP). U.S. Agency for Healthcare Research and Quality, Rockville, MD. Updated September 2013. http://www.hcup-us.ahrq.gov/toolssoftware/ccs/ccs.jsp. Accessed October 31, 2013. |