STATISTICAL BRIEF #164 |
October 2013
Audrey J. Weiss, Ph.D. and Anne Elixhauser, Ph.D. Introduction An adverse drug event (ADE) involves patient injury resulting from medication use. These events pose a serious patient safety concern. Some ADEs are known side effects that may arise even when a medication is taken correctly. Other ADEs, however, are the result of medication errors that may occur when a drug is prescribed or administered improperly. In 2007, the Institute of Medicine estimated that approximately 1.5 million preventable ADEs occur each year in the United States. 1 Many preventable ADEs occur during patient hospitalizations. Indeed, conservative estimates are that hospitalized patients experience 380,000 to 450,000 preventable ADEs each year.2 Overall, ADEs are the most common nonsurgical adverse events that occur in hospitals.3 ADEs are associated with an increased length of stay in the hospital (by 1.7 days), increased hospital cost (an additional $2,000), and increased risk of death (1.9 times higher than those not experiencing an ADE).4 This Statistical Brief presents hospital inpatient data on the four most common specifically identified ADEs from 32 States participating in the Healthcare Cost and Utilization Project (HCUP) that included a designation of whether ADE-related diagnoses were present on admission (POA) or originated during the hospital stay. In particular, patient and hospital characteristics of the most frequent specific causes of ADEs originating in the hospital are presented. Differences in rates of 20 percent or greater are described in the text. All numbers noted in the text and included in the tables are actual values, not estimates, because the data include a census of discharges rather than a sample of discharges. In other words, we count the actual number of hospital stays with ADEs originating during the stay in the 32 States. Because we analyze numbers for the actual population rather than a sample, there is no need to estimate how well the sample represents an underlying population. As a result, there is no sampling error associated with the calculated values presented, and significance testing is not necessary.5 Findings Table 1 presents adverse drug event rates for the four most common causes of ADEs originating during the hospital stay, at an overall rate of 50.4 per 10,000 discharges. The most common specific ADE causes were steroids (19.7 per 10,000 discharges), antibiotics (12.9 per 10,000 discharges), opiates and narcotics (11.2 per 10,000 discharges), and anticoagulants (6.7 per 10,000 discharges).6 The remaining analyses focus on these four causes. The highest ADE rates overall were among individuals aged 65 and older (75.3 per 10,000 discharges), those with a primary expected payer of Medicare (75.3 per 10,000 discharges), and those treated in hospitals in the Midwest (75.7 per 10,000 discharges). The findings in Table 1 are further explored in subsequent figures. |
|
| Table 1. Characteristics of the most frequent specific causes of adverse drug events originating during the hospital stay, selected States, 2011 | |||||||
| Hospital and Patient Characteristics | Denominator (all discharges in 32 states) | Rate of adverse drug events (ADEs) originating during the hospital stay per 10,000 discharges by ADE cause | |||||
|---|---|---|---|---|---|---|---|
| Top 4 ADEs | Steroids | Antibiotics | Opiates and Narcotics | Anti-coagulants | |||
| Overall Total | 20,172,966 | 50.4 | 19.7 | 12.9 | 11.2 | 6.7 | |
| Patient Characteristics | |||||||
| Age group, years | < 1 | 2,527,746 | 2.6 | 0.4 | 1.7 | 0.4 | 0.0 |
| 1-17 | 878,870 | 34.3 | 8.7 | 17.7 | 7.6 | 0.2 | |
| 18-44 | 5,169,613 | 30.2 | 11.1 | 9.9 | 7.8 | 1.4 | |
| 45-64 | 4,865,559 | 65.4 | 28.7 | 16.2 | 14.5 | 6.0 | |
| 65+ | 6,728,562 | 75.3 | 28.4 | 16.4 | 15.9 | 14.6 | |
| Sex | Male | 8,454,431 | 50.8 | 20.2 | 13.1 | 9.9 | 7.6 |
| Female | 11,717,024 | 50.2 | 19.3 | 12.7 | 12.2 | 6.0 | |
| Primary expected payer | Medicare | 7,452,761 | 75.3 | 29.1 | 16.8 | 15.7 | 13.6 |
| Medicaid | 4,508,434 | 27.5 | 11.3 | 8.8 | 5.5 | 1.9 | |
| Private insurance | 6,440,664 | 40.7 | 15.3 | 11.5 | 10.7 | 3.1 | |
| Uninsured | 1,045,853 | 39.6 | 18.4 | 12.0 | 16.9 | 2.3 | |
| Hospital Characteristics | |||||||
| Hospital teaching status | Rural | 1,708,380 | 52.4 | 20.5 | 14.2 | 10.7 | 7.0 |
| Urban nonteaching | 8,951,567 | 47.4 | 19.2 | 11.2 | 9.8 | 7.1 | |
| Urban teaching | 9,381,378 | 53.5 | 20.1 | 14.4 | 12.7 | 6.3 | |
| Hospital ownership | Government | 2,054,904 | 35.6 | 13.5 | 10.1 | 7.7 | 4.4 |
| Private, not-for-profit | 14,484,079 | 54.5 | 21.0 | 14.1 | 12.4 | 7.0 | |
| Private, for-profit | 3,502,342 | 43.7 | 18.3 | 9.9 | 8.5 | 7.0 | |
| Hospital bed size | Small | 2,079,286 | 43.8 | 16.8 | 11.7 | 9.8 | 5.5 |
| Medium | 4,886,452 | 50.4 | 19.6 | 12.9 | 11.3 | 6.6 | |
| Large | 13,075,587 | 51.9 | 20.3 | 13.2 | 11.5 | 6.9 | |
| Hospital region | Northeast | 4,782,797 | 53.0 | 19.5 | 15.0 | 11.8 | 6.7 |
| Midwest | 3,229,751 | 75.7 | 29.3 | 19.4 | 17.8 | 9.2 | |
| South | 6,970,740 | 42.2 | 17.9 | 9.9 | 7.4 | 6.9 | |
| West | 5,058,037 | 44.2 | 16.5 | 11.1 | 11.9 | 4.8 | |
| Source: Agency for Healthcare Research and Quality (AHRQ), Center for Delivery, Organization, and Markets, Healthcare Cost and Utilization Project (HCUP), State Inpatient Databases (SID) for 32 States, 2011 | |||||||
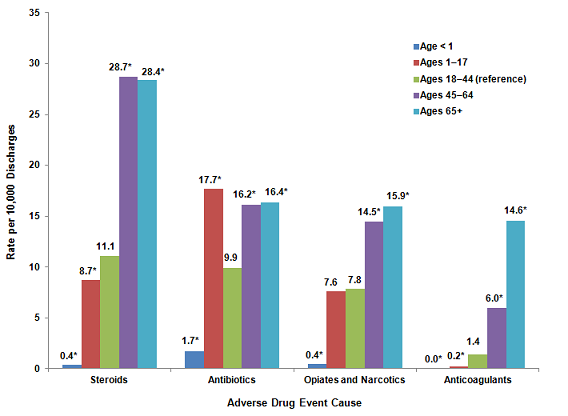
Patient characteristics of adverse drug events originating during the hospital stay, 2011 Figures 1-3 provide the rates of ADEs for each of the three patient characteristics from Table 1 and identify where differences among subgroups are noteworthy (i.e., differences between rates of at least 20 percent). The highest overall rate of ADEs originating during the stay was for steroids among patients aged 45 years and older—over 28 events per 10,000 discharges (Figure 1). Across all ADE causes, infants younger than 1 year had rates that were 83 to 97 percent lower than those for adults aged 18-44. Compared to adults aged 18-44, children aged 1-17 had a 79 percent higher rate of ADEs involving antibiotics, a 21 percent lower rate of ADEs involving steroids, and an 84 percent lower rate of ADEs involving anticoagulants; however, they had a similar rate of ADEs involving opiates and narcotics. Adults in the two oldest age groups (45-64 and 65+) had ADE rates that were 63 to 947 percent higher than adults aged 18-44. |
|
Figure 1. Rates of common adverse drug events originating during the hospital stay by age group, 2011
*Denotes differences in rates of 20 percent or greater between the reference group (adults aged 18-44) and other age groups. This is a column bar chart showing the rate per 10,000 discharges by the cause of the adverse drug event for various age groups. Adults aged 18 through 44 is the reference group. An asterisk denotes differences in rates of 20 percent or greater between the reference group and other age groups. Steroids: Age less than 1 year: 0.4*, Ages 1 through 17 years: 8.7*, Ages 18 through 44 years: 11.1, Ages 45 through 64 years: 28.7*, Ages 65 and older: 28.4*. Antibiotics: Age less than 1 year: 1.7*. Ages 1 through 17 years: 17.7*, Ages 18 through 44 years: 9.9, Ages 45 through 64 years: 16.2*, Ages 65 and older: 16.4*. Opiates and narcotics: Age less than 1 year: 0.4*, Ages 1 through 17 years: 7.6, Ages 18 through 44 years: 7.8, Ages 45 through 64 years: 14.5*, Ages 65 and older: 15.9*. Anticoagulants: Age less than 1 year: 0.0*, Ages 1 through 17 years: 0.2*, Ages 18 through 44 years: 1.4, Ages 45 through 64 years: 6.0*, Ages 65 and older: 14.6*. Source: Agency for Healthcare Research and Quality (AHRQ), Center for Delivery, Organization, and Markets, Healthcare Cost and Utilization Project (HCUP), State Inpatient Databases (SID) for 32 States, 2011. |
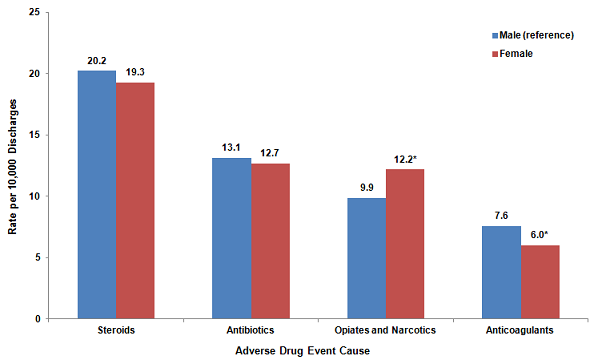
Two of the four ADE causes showed sex differences in the rates of ADEs originating during the hospital stay (Figure 2). In particular, females had a 20 percent lower rate of ADEs involving anticoagulants than males, but females had a 24 percent higher rate of ADEs involving opiates and narcotics compared to males.
|
|
Figure 2. Rates of common adverse drug events originating during the hospital stay by sex, 2011
*Denotes differences in rates of 20 percent or greater between the reference group (males) and females. This is a column bar chart showing the rate per 10,000 discharges by the cause of the adverse drug event for males and females. Males are the reference group. An asterisk denotes differences in rates of 20 percent or greater between the reference group and females. Steroids: Males: 20.2, Females: 19.3. Antibiotics: Males: 13.1, Females: 12.7. Opiates and narcotics: Males: 9.9, Females: 12.2*. Anticoagulants: Males: 7.6, Females: 6.0*. Source: Agency for Healthcare Research and Quality (AHRQ), Center for Delivery, Organization, and Markets, Healthcare Cost and Utilization Project (HCUP), State Inpatient Databases (SID) for 32 States, 2011. |
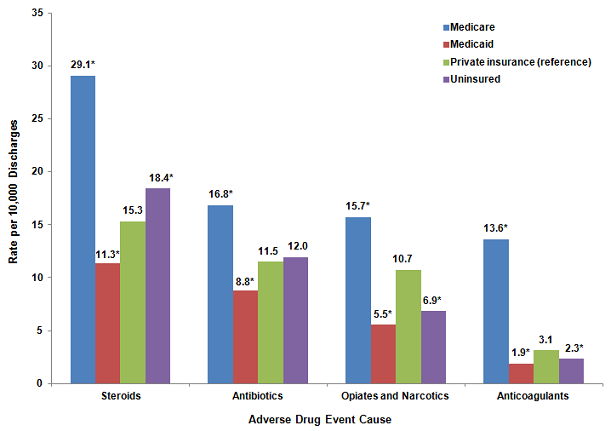
Figure 3 presents the rates of ADEs originating during the stay by expected primary payer. Across all ADE causes, Medicare-covered patients had 46 to 335 percent higher rates compared to privately insured patients. Medicaid-covered patients had 24 to 48 percent lower rates of ADEs than did privately insured patients for all causes. Compared to privately insured patients, uninsured patients had a 26 percent lower rate of ADEs involving anticoagulants and a 36 percent lower rate involving opiates and narcotics, but uninsured patients had a 20 percent higher rate of ADEs involving steroids.
|
|
Figure 3. Rates of common adverse drug events originating during the hospital stay by payer, 2011
*Denotes differences in rates of 20 percent or greater between the reference group (private insurance) and other payer groups. This is a column bar chart showing the rate per 10,000 discharges by the cause of the adverse drug event for various payers. Private insurance is the reference group. An asterisk denotes differences in rates of 20 percent or greater between the reference group and other types of payers. Steroids: Medicare: 29.1*, Medicaid: 11.3*, Private insurance: 15.3, Uninsured: 18.4*. Antibiotics: Medicare: 16.8*, Medicaid: .8*, Private insurance: 11.5, Uninsured: 12.0. Opiates and narcotics: Medicare: 15.7*, Medicaid: 5.5*, Private insurance: 10.7, Uninsured: 6.9*, Anticoagulants: Medicare: 13.6*, Medicaid: 1.9*, Private insurance: 3.1, Uninsured: 2.3*. Source: Agency for Healthcare Research and Quality (AHRQ), Center for Delivery, Organization, and Markets, Healthcare Cost and Utilization Project (HCUP), State Inpatient Databases (SID) for 32 States, 2011. |
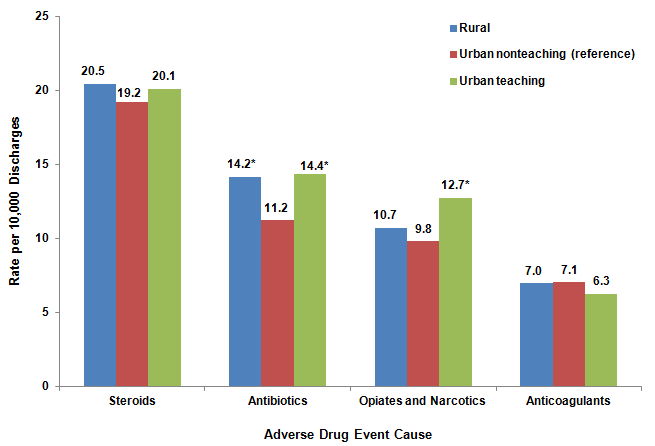
Hospital characteristics of adverse drug events originating during the hospital stay, 2011 Figures 4-6 provide the rates of ADEs for hospital characteristics from Table 1, identifying where differences among subgroups are noteworthy (i.e., rate differences of at least 20 percent). Differences in the rates of ADEs by hospital bed size were unremarkable (data not shown). As shown in Figure 4, patients treated in urban teaching hospitals had a 28 percent higher rate of ADEs involving antibiotics and a 30 percent higher rate involving opiates and narcotics, compared with patients treated in urban nonteaching hospitals. Patients treated in rural hospitals had a 26 percent higher rate of ADEs involving antibiotics than those treated in urban nonteaching hospitals. |
|
Figure 4. Rates of common adverse drug events originating during the hospital stay by hospital teaching status, 2011
*Denotes differences in rates of 20 percent or greater between the reference group (urban nonteaching hospitals) and other hospitals. This is a column bar chart showing the rate per 10,000 discharges by the cause of the adverse drug event for various types of hospitals. Urban nonteaching hospital is the reference group. An asterisk denotes differences in rates of 20 percent or greater between the reference group and other types of hospitals. Steroids: Rural hospital: 20.5, Urban nonteaching hospital: 19.2, Urban teaching hospital: 20.1. Antibiotics: Rural hospital: 14.2*, Urban nonteaching hospital: 11.2, Urban teaching hospital: 14.4*. Opiates and narcotics: Rural hospital: 10.7, Urban nonteaching hospital: 9.8, Urban teaching hospital: 12.7*. Anticoagulants: Rural hospital: 7.0, Urban nonteaching hospital: 7.1, Urban teaching hospital: 6.3. Source: Agency for Healthcare Research and Quality (AHRQ), Center for Delivery, Organization, and Markets, Healthcare Cost and Utilization Project (HCUP), State Inpatient Databases (SID) for 32 States, 2011. |
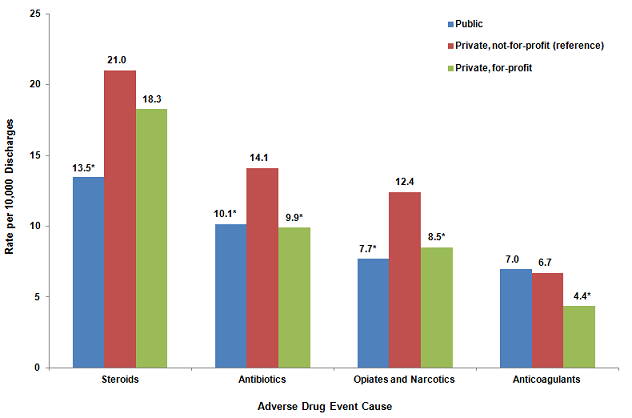
Figure 5 presents rates of ADEs originating during the hospital stay by hospital ownership. Patients treated in public hospitals had 28 to 38 percent lower rates of ADEs compared to those treated in private, not-for-profit hospitals for three of the four ADE causes—steroids, antibiotics, and opiates and narcotics. Similarly, patients treated in private, for-profit hospitals had 30 to 35 percent lower rates of ADEs versus those treated in private, not-for-profit hospitals for three of the four ADE causes—antibiotics, opiates and narcotics, and anticoagulants. |
|
Figure 5. Rates of common adverse drug events originating during the hospital stay by hospital ownership, 2011
*Denotes differences in rates of 20 percent or greater between the reference group (private, not-for-profit hospitals) and other hospitals. This is a column bar chart showing the rate per 10,000 discharges by the cause of the adverse drug event for various types of hospital ownership. Private, not-for-profit hospital is the reference group. An asterisk denotes differences in rates of 20 percent or greater between the reference group and other types of hospital ownership. Steroids: Public hospital: 13.5*, Private, not-for-profit hospital: 21.0, Private, for-profit hospital: 18.3. Antibiotics: Public hospital: 10.1*, Private, not-for-profit hospital: 14.1, Private, for-profit hospital: 9.9*. Opiates and narcotics: Public hospital: 7.7*, Private, not-for-profit hospital: 12.4, Private, for-profit hospital: 8.5*. Anticoagulants: Public hospital: 7.0, Private, not-for-profit hospital: 6.7, Private, for-profit hospital: 4.4*. Source: Agency for Healthcare Research and Quality (AHRQ), Center for Delivery, Organization, and Markets, Healthcare Cost and Utilization Project (HCUP), State Inpatient Databases (SID) for 32 States, 2011. |
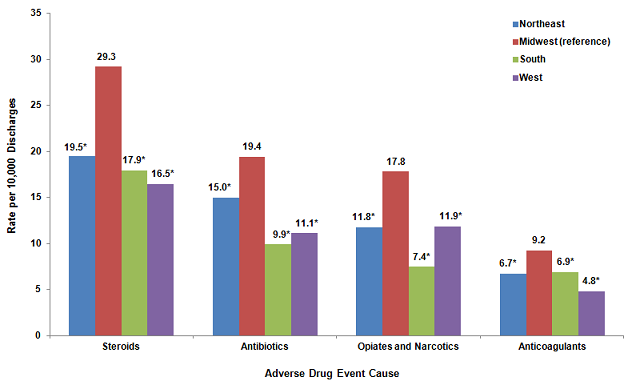
By hospital region, patients treated in hospitals in the West had 34 to 48 percent lower rates across all ADE causes compared to patients treated in hospitals in the Midwest (Figure 6). Patients treated in hospitals in the Northeast also had 23 to 34 percent lower rates across all ADE causes compared to patients treated in hospitals in the Midwest. Finally, patients treated in hospitals in the South had 25 to 58 percent lower rates across all ADE causes compared to patients treated in hospitals in the Midwest.
|
|
Figure 6. Rates of common adverse drug events originating during the hospital stay by hospital region,† 2011
†Northeast: Massachusetts, New Jersey, New York, Pennsylvania, Vermont This is a column bar chart showing the rate per 10,000 discharges by the cause of the adverse drug event for various hospital regions. Hospitals in the Midwest is the reference group. An asterisk denotes differences in rates of 20 percent or greater between the reference group and other hospital regions. The hospital regions are: Northeast: Massachusetts, New Jersey, New York, Pennsylvania, Vermont. Midwest: Iowa, Illinois, Indiana, Kansas, Michigan, Minnesota, Nebraska, South Dakota, Wisconsin. outh: Arkansas, Florida, Georgia, Kentucky, Maryland, Oklahoma, South Carolina, Tennessee, Texas, Virginia. West: Arizona, California, Colorado, Hawaii, Montana, Nevada, Oregon, Washington. Steroids: Northwest: 19.5*, Midwest: 29.3, South: 17.9*, West: 16.5*. Antibiotics: Northwest: 15.0*, Midwest: 19.4, South: 9.9*, West: 11.1*. Opiates and narcotics: Northwest: 11.8*, Midwest: 17.8, South: 7.4*, West: 11.9*. Anticoagulants: Northwest: 6.7*, Midwest: 9.2, South: 6.9*, West: 4.8*. Source: Agency for Healthcare Research and Quality (AHRQ), Center for Delivery, Organization, and Markets, Healthcare Cost and Utilization Project (HCUP), State Inpatient Databases (SID) for 32 States, 2011. |
These differences by hospital characteristics should be examined further using multivariate analysis to account for potential differences in patient populations by type of hospital.
Data Source The estimates in this Statistical Brief are based upon data from the Healthcare Cost and Utilization Project (HCUP) 2011 State Inpatient Databases (SID) from 32 States that include data elements designating whether adverse drug event (ADE) diagnoses were present on admission or originated during the stay. The States are Arkansas, Arizona, California, Colorado, Florida, Georgia, Hawaii, Iowa, Illinois, Indiana, Kansas, Kentucky, Massachusetts, Maryland, Michigan, Minnesota, Montana, Nebraska, New Jersey, Nevada, New York, Oklahoma, Oregon, Pennsylvania, South Carolina, South Dakota, Tennessee, Texas, Virginia, Vermont, Washington, and Wisconsin. Definitions The specific causes of ADEs presented in this Statistical Brief were based on a review of International Classification of Diseases, Ninth Revision, Clinical Modification (ICD-9-CM) diagnosis codes and external cause of injury codes (E codes). The specific ICD-9-CM codes used for each ADE cause are provided in Table 2. |
| Table 2. Adverse drug event causes and associated ICD-9-CM diagnosis codes | |
| Adverse drug event cause | ICD-9-CM diagnosis codes |
|---|---|
| Steroids | 365.31 Corticosteroid-induced glaucoma, glaucomatous stage 365.32 Corticosteroid-induced glaucoma, residual stage 962.0 Poisoning by adrenal cortical steroids E932.0 Adrenal cortical steroids causing adverse effects in therapeutic use |
| Antibiotics | 760.74 Anti-infectives affecting fetus or newborn via placenta or breast milk 960.0 Poisoning by penicillins 960.1 Poisoning by antifungal antibiotics 960.2 Poisoning by chloramphenicol group 960.3 Poisoning by erythromycin and other macrolides 960.4 Poisoning by tetracycline group 960.5 Poisoning of cephalosporin group 960.6 Poisoning of antimycobacterial antibiotics 960.8 Poisoning by other specified antibiotics 960.9 Poisoning by unspecified antibiotic E856 Accidental poisoning by antibiotics E930.0 Penicillins causing adverse effects in therapeutic use E930.1 Antifungal antibiotics causing adverse effects in therapeutic use E930.2 Chloramphenicol group causing adverse effects in therapeutic use E930.3 Erythromycin and other macrolides causing adverse effects in therapeutic use E930.4 Tetracycline group causing adverse effects in therapeutic use E930.5 Cephalosporin group causing adverse effects in therapeutic use E930.6 Antimycobacterial antibiotics causing sdverse effects in therapeutic use E930.8 Other specified antibiotics causing adverse effects in therapeutic use E930.9 Unspecified antibiotic causing adverse effects in therapeutic use |
| Opiates and Narcotics | 965.09 Poisoning by other opiates and related narcotics E850.2 Accidental poisoning by other opiates and related narcotics E935.2 Other opiates and related narcotics causing adverse effects in therapeutic use |
| Anticoagulants | 964.2 Poisoning by anticoagulants E934.2 Anticoagulants causing adverse effects in therapeutic use |
Present on admission was determined for each discharge diagnosis based on two types of present on admission indicator flags in the SID: (1) a diagnosis-specific flag that indicates whether each diagnosis was present on admission, and (2) an E code flag that indicates whether each external cause of injury was present on admission.
A total of 4,554 hospitals and 30,149,145 discharges were in the original SID for the 32 States in this study. Hospitals and individual discharge records with missing or incomplete present-on-admission information were excluded from the analysis, as shown in Table 3. |
| Table 3. Exclusion criteria and the number of hospitals and discharges excluded | ||||
| Exclusion Criteria | Hospitals Excluded* | Discharges Excluded* | ||
|---|---|---|---|---|
| Number | Percent | Number | Percent | |
| Hospitals that reported all diagnoses and E codes as being present on admission | 48 | 1.1 | 47,104 | 0.2 |
| Hospitals with 20 percent or more discharges with a missing present on admission indicator for nonmissing diagnoses or E codes | 1,768 | 38.8 | 8,619,776 | 28.6 |
| Hospitals that only coded present on admission for Medicare patients | 5 | 0.1 | 3,140 | 0.0 |
| Discharges with missing present on admission information for nonmissing diagnoses or E codes | n/a | n/a | 1,309,298 | 4.3 |
| *Some excluded hospitals and discharges are counted more than once, as a function of meeting more than one exclusion criteria. | ||||
The final analysis file for this Statistical Brief included 2,737 hospitals (60.1 percent) and 20,172,966 discharges (66.9 percent) across the 32 States.
Unit of analysis The unit of analysis is the hospital discharge (i.e., the hospital stay), not a person or patient. This means that a person who is admitted to the hospital multiple times in one year will be counted each time as a separate "discharge" from the hospital. About HCUP HCUP is a family of powerful healthcare databases, software tools, and products for advancing research. Sponsored by the Agency for Healthcare Research and Quality (AHRQ), HCUP includes the largest all-payer encounter-level collection of longitudinal healthcare data (inpatient, ambulatory surgery, and emergency department) in the United States, beginning in 1988. HCUP is a Federal-State-Industry Partnership that brings together the data collection efforts of many organizations—such as State data organizations, hospital associations, private data organizations, and the Federal government—to create a national information resource. HCUP would not be possible without the contributions of the following data collection Partners from across the United States: Alaska State Hospital and Nursing Home Association Arizona Department of Health Services Arkansas Department of Health California Office of Statewide Health Planning and Development Colorado Hospital Association Connecticut Hospital Association Florida Agency for Health Care Administration Georgia Hospital Association Hawaii Health Information Corporation Illinois Department of Public Health Indiana Hospital Association Iowa Hospital Association Kansas Hospital Association Kentucky Cabinet for Health and Family Services Louisiana Department of Health and Hospitals Maine Health Data Organization Maryland Health Services Cost Review Commission Massachusetts Center for Health Information and Analysis Michigan Health & Hospital Association Minnesota Hospital Association Mississippi Department of Health Missouri Hospital Industry Data Institute Montana MHA - An Association of Montana Health Care Providers Nebraska Hospital Association Nevada Department of Health and Human Services New Hampshire Department of Health & Human Services New Jersey Department of Health New Mexico Department of Health New York State Department of Health North Carolina Department of Health and Human Services North Dakota (data provided by the Minnesota Hospital Association) Ohio Hospital Association Oklahoma State Department of Health Oregon Association of Hospitals and Health Systems Oregon Health Policy and Research Pennsylvania Health Care Cost Containment Council Rhode Island Department of Health South Carolina Budget & Control Board South Dakota Association of Healthcare Organizations Tennessee Hospital Association Texas Department of State Health Services Utah Department of Health Vermont Association of Hospitals and Health Systems Virginia Health Information Washington State Department of Health West Virginia Health Care Authority Wisconsin Department of Health Services Wyoming Hospital Association About the SID The HCUP State Inpatient Databases (SID) are hospital inpatient databases from data organizations participating in HCUP. The SID contain the universe of the inpatient discharge abstracts in the participating HCUP States, translated into a uniform format to facilitate multistate comparisons and analyses. Together, the SID encompass more than 95 percent of all U.S. community hospital discharges in 2009. The SID can be used to investigate questions unique to one State, to compare data from two or more States, to conduct market area variation analyses, and to identify State-specific trends in inpatient care utilization, access, charges, and outcomes. For this Statistical Briefs, the SID from a subset of HCUP States was used—those 32 States for which present on admission indicator information was available: Arkansas, Arizona, California, Colorado, Florida, Georgia, Hawaii, Iowa, Illinois, Indiana, Kansas, Kentucky, Massachusetts, Maryland, Michigan, Minnesota, Montana, Nebraska, New Jersey, Nevada, New York, Oklahoma, Oregon, Pennsylvania, South Carolina, South Dakota, Tennessee, Texas, Virginia, Vermont, Washington, Wisconsin. For More Information For more information about HCUP, visit http://www.hcup-us.ahrq.gov/. For additional HCUP statistics, visit HCUPnet, our interactive query system, at https://datatools.ahrq.gov/hcupnet. For information on other hospitalizations in the United States, download HCUP Facts and Figures: Statistics on Hospital-Based Care in the United States in 2009, located at http://www.hcup-us.ahrq.gov/reports.jsp. For a detailed description of HCUP, more information on the design of the State Inpatient Databases (SID), please refer to the following publications: Introduction to the HCUP State Inpatient Databases. Online. December 2012. U.S. Agency for Healthcare Research and Quality. http://hcup-us.ahrq.gov/db/state/siddist/Introduction_to_SID.pdf. Accessed March 13, 2013. Suggested Citation Weiss AJ (Truven Health Analytics), Elixhauser A (AHRQ). Characteristics of Adverse Drug Events Originating During the Hospital Stay, 2011. HCUP Statistical Brief #164. October 2013. Agency for Healthcare Research and Quality, Rockville, MD. http://www.hcup-us.ahrq.gov/reports/statbriefs/sb164.pdf. Acknowledgments The authors would like to acknowledge the contributions of Devi Katikineni and Valeriy Bakaushin of Social & Scientific Systems, Inc. *** AHRQ welcomes questions and comments from readers of this publication who are interested in obtaining more information about access, cost, use, financing, and quality of healthcare in the United States. We also invite you to tell us how you are using this Statistical Brief and other HCUP data and tools, and to share suggestions on how HCUP products might be enhanced to further meet your needs. Please e-mail us at hcup@ahrq.gov or send a letter to the address below:Irene Fraser, Ph.D., Director Center for Delivery, Organization, and Markets Agency for Healthcare Research and Quality 540 Gaither Road Rockville, MD 20850 1 Committee on Identifing and Preventing Medication Errors, Board on Health Care Services, Institute of Medicine. Aspden P, Wolcott JA, Bootman JL, Cronenwett LR, Eds. Preventing Medication Errors: Quality Chasm Series. Washington, D.C.: National Academic Press; 2007. 2 Ibid. 3 Classen DC, Pestotnik SL, Evans RS, Lloyd JF, Burke JP. Adverse drug events in hospitalized patients. Excess length of stay, extra costs, and attributable mortality. Journal of the American Medical Association. 1997 Jan 22;277(4):301-6. 4 Ibid. 5 Houchens R. Inferences with HCUP State Databases. Final Report. HCUP Methods Series Report # 2010-05. Online October 12, 2010. U.S. Agency for Healthcare Research and Quality. http://www.hcup-us.ahrq.gov/reports/methods/2010_05.pdf. Accessed May 24, 2013. 6 ADEs involving antineoplastic drugs occurred at a rate of 7.8 per 10,000 discharges. However, we did not include antineoplastic drugs (cancer chemotherapy) in our analysis because these drugs have a well-known set of expected and serious side effects that are considered worth the risk, given the nature of the disease being treated. |
| Internet Citation: Statistical Brief #164. Healthcare Cost and Utilization Project (HCUP). September 2025. Agency for Healthcare Research and Quality, Rockville, MD. hcup-us.ahrq.gov/reports/statbriefs/sb164.jsp. |
| Are you having problems viewing or printing pages on this website? |
| If you have comments, suggestions, and/or questions, please contact hcup@ahrq.gov. |
| If you are experiencing issues related to Section 508 accessibility of information on this website, please contact hcup@ahrq.gov. |
| Privacy Notice, Viewers & Players |
| Last modified 9/3/25 |