STATISTICAL BRIEF #163 |
October 2013
Niranjana M. Kowlessar, Ph.D., H. Joanna Jiang, Ph.D., and Claudia Steiner, M.D., M.P.H. Introduction Almost 99 percent of births in the United States take place in hospitals.1 Live births account for about 10 percent of all hospital discharges, and birth is the most frequent reason for hospital stays. Tracking the numbers and clinical conditions of newborns as well as demographic characteristics such as their sex, health insurance coverage, and geographic region can provide insight into trends and variations in their health. These characteristics can also indicate areas in which to target interventions to improve birth outcomes. Although a majority of newborns are healthy babies, some are born prematurely and/or with low birth weight. Premature birth is a birth that takes place before 37 weeks of gestation have passed, and low birth weight refers to weight at birth of less than 2500 grams. Premature babies have higher rates of mortality and a higher likelihood of adverse health outcomes, including developmental delays. Premature birth is also one of the leading causes of low birth weight in newborns. Babies with low birth weight are more likely than babies with normal weight to have complications such as respiratory distress syndrome—a disorder that causes babies to need extra oxygen or help for breathing.2 Preterm births also impose a heavy financial burden on the U.S. healthcare system, costing more than $26 billion annually.3 This Statistical Brief presents data from the Healthcare Cost and Utilization Project (HCUP) on characteristics of live hospital births (i.e., newborns excluding stillbirths) in the United States in 2011. Demographic characteristics of newborns in 2008 are compared to data from 2011. Hospital utilization and costs are compared for selected birth outcomes and clinical conditions for 2011. All differences between estimates noted in the text are statistically significant at the .001 or better probability level. Findings Demographic characteristics of all live hospital births, 2008 and 2011 In 2011, there were 3,800,000 live births in hospitals, which was 436,000 less or a decrease of 10.3 percent compared to 2008. Table 1 shows that for both data years, newborns were more likely to be covered by Medicaid or private insurance, live in a large metropolitan area with more than 1 million residents, and live in communities with lower median income. In 2008 and 2011, more than half (51.3 and 51.1 percent, respectively) of newborns were male. In 2008, Medicaid covered 40.5 percent of hospital stays for newborns, which increased to 44.7 percent in 2011. |
|
| Table 1. Demographic characteristics of live hospital births, 2008 and 2011 | ||||
| Characteristics | 2008 | 2011 | ||
|---|---|---|---|---|
| Count (thousands) | Percent | Count (thousands) | Percent | |
| Overall | 4,236 | 100 | 3,800 | 100 |
| Sex | ||||
| Male | 2,171 | 51.3 | 1,943 | 51.1 |
| Female | 2,064 | 48.7 | 1,856 | 48.9 |
| Insurance | ||||
| Medicaid | 1,715 | 40.5 | 1,694 | 44.7 |
| Private | 2,161 | 51.1 | 1,848 | 48.7 |
| Uninsured | 239 | 5.6 | 136 | 3.6 |
| Other | 117 | 2.8 | 115 | 3.0 |
| Urbanicity | ||||
| Large metropolitan areas with at least 1M residents | 2,448 | 57.9 | 2,184 | 57.6 |
| Small metropolitan areas with less than 1M residents | 1,156 | 27.3 | 1,042 | 27.5 |
| Micropolitan areas | 392 | 9.3 | 349 | 9.2 |
| Not metropolitan or micropolitan | 235 | 5.6 | 219 | 5.8 |
| Income at ZIP Code, U.S. $ | ||||
| 1–40,999 | 1,099 | 26.3 | 984 | 26.3 |
| 41,000–50,999 | 1,114 | 26.6 | 909 | 24.3 |
| 51,000–66,999 | 1,002 | 24.0 | 1,013 | 27.0 |
| 67,000 and above | 969 | 23.2 | 840 | 22.4 |
| Source: Agency for Healthcare Research and Quality (AHRQ), Healthcare Cost and Utilization Project (HCUP), Nationwide Inpatient Sample (NIS) | ||||
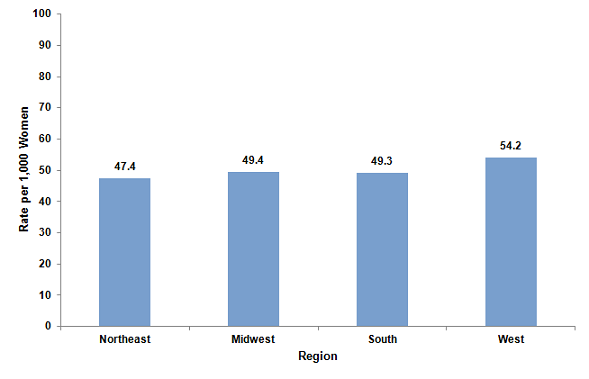
The number of newborns per 1,000 women aged 15 to 50 years was the highest in the West (54.2 per 1,000 women) and the lowest in the Northeast (47.4 per 1,000 women) (Figure 1).
|
|
Figure 1. Number of live hospital births per 1,000 women aged 15–50 years by region, 2011
Source: The number of births is based on the Agency for Healthcare Research and Quality (AHRQ), Healthcare Cost and Utilization Project (HCUP), Nationwide Inpatient Sample (NIS). The population count for women aged 15 to 50 years is based on the U.S. Census Bureau, American Community Survey. This figure is a bar graph showing the rate per 1,000 women by region. Northeast, 47.4, Midwest, 49.4, South, 49.3, West, 54.2. Source: The number of births is based on the Agency for Healthcare Research and Quality, Healthcare Cost and Utilization Project, Nationwide Inpatient Sample. The population count for women aged 15 to 50 years is based on the U.S. Census Bureau, American Community Survey. |
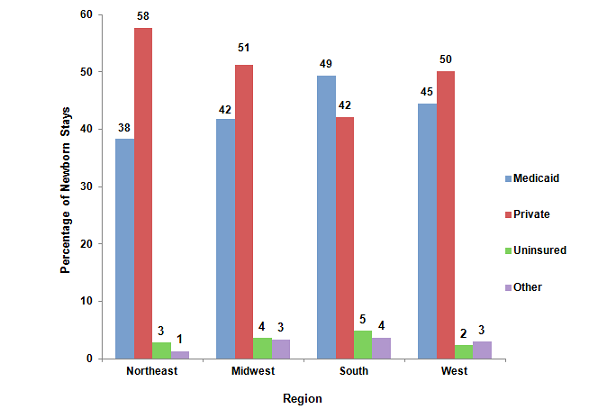
Health insurance for hospital newborns by region, 2011 Figure 2 shows the type of health insurance for hospital newborns by region in 2011. Medicaid had the largest share in the South, accounting for nearly half of the hospital stays for newborns. In the Northeast, Midwest, and West, private insurance covered half or more of newborn hospital stays. Across all regions, the share covered by other insurance types or the uninsured was less than 10 percent. |
|
Figure 2. Distribution of major insurance types for hospital newborns by region, 2011
Source: Agency for Healthcare Research and Quality (AHRQ), Center for Delivery, Organizations, and Markets, Healthcare Cost and Utilization Project (HCUP), Nationwide Inpatient Sample (NIS) This is a bar graph showing the percentage of newborn hospital stays by the payer and region. Northeast: Medicaid, 38; private, 58; uninsured, 3 ; other, 1. Midwest: Medicaid, 42; private, 51; uninsured, 4; other, 3. South: Medicaid, 49; private, 42; uninsured, 5; other, 4. West: Medicaid, 45; private, 50; uninsured, 2; other, 3. Source: Agency for Healthcare Research and Quality, Center for Delivery, Organizations, and Markets, Healthcare Cost and Utilization Project, Nationwide Inpatient Sample. |
Hospital costs and length of stay by selected clinical outcomes, 2011 Table 2 provides information on average length of stay and costs for all newborns and for newborns with complications such as prematurity, low birth weight, and respiratory distress syndrome. On average, newborns stayed in the hospital for 3.4 days and incurred average hospital costs of $3,200. Newborns that were preterm or had low birth weight or respiratory distress syndrome had higher average lengths of stay and higher average costs compared to all newborns. Preterm newborns had hospital stays averaging 14.3 days with mean costs of $21,500. Among newborns with low birth weight, those who weighed less than 1500 grams had hospital stays averaging 42.6 days with mean costs of $76,700 compared to 10.9 days and $14,000 for those weighing 1500 grams or more. Newborns with respiratory distress syndrome had hospital stays averaging 31.3 days and average costs of $55,000. Newborns that died after birth had hospital stays averaging 7.4 days and average costs of $28,600. |
| Table 2. Average length of newborn hospital stays and hospital costs by selected clinical outcomes, 2011 | |||||
| Outcomes | Count | Percent | Average length of stay (days) | Average hospital costs (U.S. $) | Aggregated hospital costs (millions U.S. $) |
|---|---|---|---|---|---|
| All live hospital births | 3,800,000 | 100.0 | 3.4 | 3,200 | 12,200 |
| Preterm | 321,900 | 8.5 | 14.3 | 21,500 | 6,900 |
| Low birth weight | 231,900 | 6.1 | 17.7 | 27,200 | 6,200 |
| Weight less than 1500g | 49,300 | 1.3 | 42.6 | 76,700 | 3,700 |
| Weight greater than or equal to 1500g | 181,500 | 4.8 | 10.9 | 14,000 | 2,500 |
| Respiratory distress syndrome | 75,100 | 2.0 | 31.3 | 55,000 | 4,100 |
| Died after birth | 10,900 | 0.3 | 7.4 | 28,600 | 300 |
| Note: The categories for preterm, low birth weight, and respiratory distress syndrome overlap and are not mutually exclusive. Source: Agency for Healthcare Research and Quality (AHRQ), Healthcare Cost and Utilization Project (HCUP), Nationwide Inpatient Sample (NIS) |
|||||
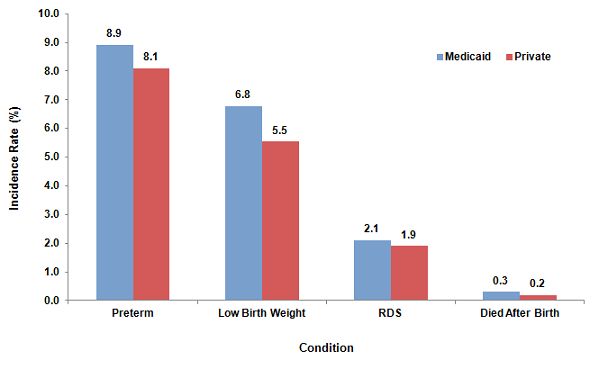
Incidence of selected birth outcomes and average hospital costs by insurance category, 2011 Figures 3 and 4 show the incidence of select outcomes among live hospital births and the average hospital costs associated with these birth outcomes by insurance category. Hospital newborns covered by Medicaid had higher incidence rates of preterm (8.9 percent) and low birth weight (6.8 percent), compared with those covered by private insurance (8.1 percent and 5.5 percent, respectively). Mortality rate after birth was also higher for newborns covered by Medicaid than for the privately insured (0.3 versus 0.2 percent). However, the incidence rate of respiratory distress syndrome was similar for newborns covered by these two insurance categories (2.1 percent for Medicaid and 1.9 percent for private insurance). |
|
Figure 3. Incidence of select conditions among live hospital births by insurance category, 2011
Abbreviation: RDS, respiratory distress syndrome This is a bar graph, showing the incidence rate (percentage) and the payer for selected birth outcomes. Preterm: Medicaid, 8.9; private, 8.1. Low Birth Weight: Medicaid, 6.8; private, 5.5. Respiratory Distress Syndrome (RDS): Medicaid, 2.1; private, 1.9. Died After Birth: Medicaid, 0.3; private, 0.2. Source: Agency for Healthcare Research and Quality, Center for Delivery, Organizations, and Markets, Healthcare Cost and Utilization Project, Nationwide Inpatient Sample. Note: The categories for preterm, low birth weight, and respiratory distress syndrome overlap and are not mutually exclusive. |
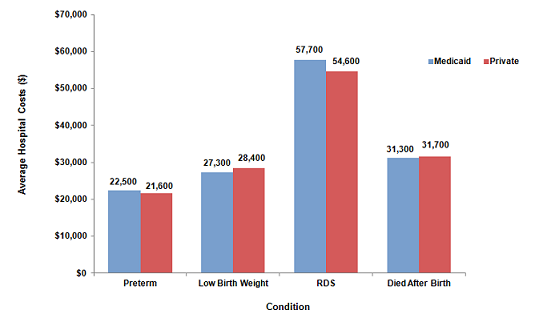
Average hospital costs were similar among Medicaid and private payers for newborns with preterm, low birth weight, and respiratory distress syndrome, and for those who died after birth. Average costs for Medicaid ranged from $22,500 (preterm) to $57,700 (respiratory distress syndrome) and average costs for private payers ranged from $21,600 (preterm) to $54,600 (respiratory distress syndrome).
|
|
Figure 4. Average hospital costs for select conditions among live hospital births by insurance category, 2011
Abbreviation: RDS, respiratory distress syndrome This is a bar graph, showing the average hospital costs in dollars and the payer for selected birth outcomes. Preterm: Medicaid, 22,500; private, 21,600. Low Birth Weight: Medicaid, 27,300; private, 28,400. Respiratory Distress Syndrome (RDS): Medicaid, 57,700; private, 54,600. Died After Birth: Medicaid, 31,300; private, 31,700. Source: Agency for Healthcare Research and Quality, Center for Delivery, Organizations, and Markets, Healthcare Cost and Utilization Project, Nationwide Inpatient Sample. Note: The categories for preterm, low birth weight, and respiratory distress syndrome overlap and are not mutually exclusive. |
Data Source
The estimates in this Statistical Brief are based on data from the Healthcare Cost and Utilization Project (HCUP) 2008 and 2011 National Inpatient Sample (NIS). Many hypothesis tests were conducted for this Statistical Brief. Thus, to decrease the number of false-positive results, we reduced the significance level to .001 for individual tests. Definitions Diagnoses, ICD-9-CM, and Clinical Classifications Software (CCS) The principal diagnosis is that condition established after study to be chiefly responsible for the patient's admission to the hospital. Secondary diagnoses are concomitant conditions that coexist at the time of admission or that develop during the stay. ICD-9-CM is the International Classification of Diseases, Ninth Revision, Clinical Modification, which assigns numeric codes to diagnoses. There are approximately 14,000 ICD-9-CM diagnosis codes. Case definition The ICD-9-CM codes defining all newborns, stillbirths, preterm birth, low birth weight, and respiratory distress syndrome include diagnosis codes in the following range.
Types of hospitals included in HCUP HCUP is based on data from community hospitals, which are defined as short-term, non-Federal, general, and other hospitals, excluding hospital units of other institutions (e.g., prisons). HCUP data include obstetrics and gynecology, otolaryngology, orthopedic, cancer, pediatric, public, and academic medical hospitals. Excluded are long-term care, rehabilitation, psychiatric, and alcoholism and chemical dependency hospitals. However, if a patient received long-term care, rehabilitation, or treatment for psychiatric or chemical dependency conditions in a community hospital, the discharge record for that stay will be included in the Nationwide Inpatient Sample (NIS). Unit of analysis The unit of analysis is the hospital discharge (i.e., the hospital stay), not a person or patient. This means that a person who is admitted to the hospital multiple times in one year will be counted each time as a separate "discharge" from the hospital. Costs and charges Total hospital charges were converted to costs using HCUP Cost-to-Charge Ratios based on hospital accounting reports from the Centers for Medicare & Medicaid Services (CMS).4 Costs will reflect the actual expenses incurred in the production of hospital services, such as wages, supplies, and utility costs; charges represent the amount a hospital billed for the case. For each hospital, a hospital-wide cost-to-charge ratio is used. Hospital charges reflect the amount the hospital billed for the entire hospital stay and do not include professional (physician) fees. For the purposes of this Statistical Brief, average costs are reported to the nearest hundred. Location of patients' residence Place of residence is based on the urban-rural classification scheme for U.S. counties developed by the National Center for Health Statistics (NCHS):
Median community-level income is the median household income of the patient's ZIP Code of residence. The cut-offs for the quartile designation are determined using ZIP Code demographic data obtained from the Nielsen Company. The income quartile is missing for homeless and foreign patients. Insurance Insurance coverage is defined by the expected primary payer for the hospital stay. To make coding uniform across all HCUP data sources, detailed payers were combined into general categories:
When more than one payer is listed for a hospital discharge, the first-listed payer is used. Region Region is one of the four regions defined by the U.S. Census Bureau:
HCUP is a family of powerful healthcare databases, software tools, and products for advancing research. Sponsored by the Agency for Healthcare Research and Quality (AHRQ), HCUP includes the largest all-payer encounter-level collection of longitudinal healthcare data (inpatient, ambulatory surgery, and emergency department) in the United States, beginning in 1988. HCUP is a Federal-State-Industry Partnership that brings together the data collection efforts of many organizations—such as State data organizations, hospital associations, private data organizations, and the Federal government—to create a national information resource. HCUP would not be possible without the contributions of the following data collection Partners from across the United States: Alaska State Hospital and Nursing Home Association Arizona Department of Health Services Arkansas Department of Health California Office of Statewide Health Planning and Development Colorado Hospital Association Connecticut Hospital Association Florida Agency for Health Care Administration Georgia Hospital Association Hawaii Health Information Corporation Illinois Department of Public Health Indiana Hospital Association Iowa Hospital Association Kansas Hospital Association Kentucky Cabinet for Health and Family Services Louisiana Department of Health and Hospitals Maine Health Data Organization Maryland Health Services Cost Review Commission Massachusetts Center for Health Information and Analysis Michigan Health & Hospital Association Minnesota Hospital Association Mississippi Department of Health Missouri Hospital Industry Data Institute Montana MHA - An Association of Montana Health Care Providers Nebraska Hospital Association Nevada Department of Health and Human Services New Hampshire Department of Health & Human Services New Jersey Department of Health New Mexico Department of Health New York State Department of Health North Carolina Department of Health and Human Services North Dakota (data provided by the Minnesota Hospital Association) Ohio Hospital Association Oklahoma State Department of Health Oregon Association of Hospitals and Health Systems Oregon Health Policy and Research Pennsylvania Health Care Cost Containment Council Rhode Island Department of Health South Carolina Budget & Control Board South Dakota Association of Healthcare Organizations Tennessee Hospital Association Texas Department of State Health Services Utah Department of Health Vermont Association of Hospitals and Health Systems Virginia Health Information Washington State Department of Health West Virginia Health Care Authority Wisconsin Department of Health Services Wyoming Hospital Association About the NIS The HCUP Nationwide Inpatient Sample (NIS) is a nationwide database of hospital inpatient stays. The NIS is nationally representative of all community hospitals (i.e., short-term, non-Federal, nonrehabilitation hospitals). The NIS is a sample of hospitals and includes all patients from each hospital, regardless of payer. It is drawn from a sampling frame that contains hospitals comprising more than 95 percent of all discharges in the United States. The vast size of the NIS allows the study of topics at both the national and regional levels for specific subgroups of patients. In addition, NIS data are standardized across years to facilitate ease of use. For More Information For more information about HCUP, visit http://www.hcup-us.ahrq.gov/. For additional HCUP statistics, visit HCUPnet, our interactive query system, at https://datatools.ahrq.gov/hcupnet. For information on other hospitalizations in the United States, download HCUP Facts and Figures: Statistics on Hospital-Based Care in the United States in 2009, located at http://www.hcup-us.ahrq.gov/reports.jsp. For a detailed description of HCUP, more information on the design of the NIS, and methods to calculate estimates, please refer to the following publications: Introduction to the HCUP Nationwide Inpatient Sample, 2009. Online. May 2011. U.S. Agency for Healthcare Research and Quality. http://hcup-us.ahrq.gov/db/nation/nis/NIS_2009_INTRODUCTION.pdf. Accessed August 16, 2013. Houchens R, Elixhauser A. Final Report on Calculating Nationwide Inpatient Sample (NIS) Variances, 2001. HCUP Methods Series Report #2003-2. Online. June 2005 (revised June 6, 2005). U.S. Agency for Healthcare Research and Quality. http://www.hcup-us.ahrq.gov/reports/methods/2003_02.pdf. Accessed August 16, 2013. Houchens RL, Elixhauser A. Using the HCUP Nationwide Inpatient Sample to Estimate Trends. (Updated for 1988–2004). HCUP Methods Series Report #2006–05. Online. August 18, 2006. U.S. Agency for Healthcare Research and Quality. http://www.hcup-us.ahrq.gov/reports/methods/2006_05_NISTrendsReport_1988-2004.pdf. Accessed August 16, 2013. Suggested Citation Kowlessar NM (Social & Scientific Systems, Inc.), Jiang HJ (AHRQ), and Steiner C (AHRQ). Hospital Stays for Newborns, 2011. HCUP Statistical Brief #163. October 2013. Agency for Healthcare Research and Quality, Rockville, MD. http://www.hcup-us.ahrq.gov/reports/statbriefs/sb163.pdf. *** AHRQ welcomes questions and comments from readers of this publication who are interested in obtaining more information about access, cost, use, financing, and quality of healthcare in the United States. We also invite you to tell us how you are using this Statistical Brief and other HCUP data and tools, and to share suggestions on how HCUP products might be enhanced to further meet your needs. Please e-mail us at hcup@ahrq.gov or send a letter to the address below:Irene Fraser, Ph.D., Director Center for Delivery, Organization, and Markets Agency for Healthcare Research and Quality 540 Gaither Road Rockville, MD 20850 1 Martin JA, Hamilton BE, Ventura SJ, Osterman MJ, Wilson EC, Mathews TJ. Births: Final data for 2010. National Vital Statistics Reports; Vol 61, No 1. Hyattsville, MD: National Center for Health Statistics, 2012. 2 March of Dimes. 2013. Low Birthweight. http://www.marchofdimes.com/baby/premature_lowbirthweight.html. 3 Centers for Disease Control and Prevention. 2013. Preterm Birth. http://www.cdc.gov/reproductivehealth/maternalinfanthealth/PretermBirth.htm. Accessed August 15, 2013. 4 HCUP Cost-to-Charge Ratio Files (CCR). Healthcare Cost and Utilization Project (HCUP). 2001–2009. U.S. Agency for Healthcare Research and Quality, Rockville, MD. Available at http://www.hcup-us.ahrq.gov/db/state/costtocharge.jsp. Updated August 2013. Accessed August 16, 2013. |
| Internet Citation: Statistical Brief #163. Healthcare Cost and Utilization Project (HCUP). May 2016. Agency for Healthcare Research and Quality, Rockville, MD. hcup-us.ahrq.gov/reports/statbriefs/sb163.jsp. |
| Are you having problems viewing or printing pages on this website? |
| If you have comments, suggestions, and/or questions, please contact hcup@ahrq.gov. |
| If you are experiencing issues related to Section 508 accessibility of information on this website, please contact hcup@ahrq.gov. |
| Privacy Notice, Viewers & Players |
| Last modified 5/18/16 |