STATISTICAL BRIEF #159 |
July 2013
Marguerite L. Barrett, M.S., Anika L. Hines, Ph.D., M.P.H., and Roxanne M. Andrews, Ph.D. Introduction Monitoring trends in access to and quality of healthcare is an important way to identify whether care is improving for different groups of people. Trends can be considered in conjunction with contextual events that might explain changes over time for the nation, overall, and for subpopulations. For example, difficult economic times may inhibit or delay patients in seeking healthcare.1 Most recently, the "Great Recession" from 2007-2009 was associated with downward trends in healthcare utilization across various racial and ethnic groups and types of healthcare services.2 The Healthcare Cost and Utilization Project data, in conjunction with the Agency for Healthcare Research and Quality (AHRQ) Prevention Quality Indicators (PQIs), may be used to monitor trends in access to healthcare over time. In particular, rates of ambulatory care sensitive conditions—where hospitalizations potentially could be avoided or minimized with appropriate outpatient care—are useful indicators of healthcare quality and access.3 Perforated appendix—the rupture and subsequent spillage of intestinal contents into the abdominal cavity—is considered to be a potentially avoidable condition when appendicitis (inflammation of the appendix) is treated in a prompt and appropriate manner. Patients who experience perforation have worse prognoses and require longer hospital stays than other patients with appendicitis.4 From 1970 to 1995, rates of perforated appendix among patients with appendicitis steadily increased.5 Furthermore, rates of perforated appendix are known to vary by patient characteristics. Racial and ethnic minorities, patients covered by Medicaid, and uninsured patients exhibited higher perforation rates and longer durations of symptoms before presenting to a healthcare professional.6,7 This Statistical Brief uses 2001-2010 data from the Healthcare Cost and Utilization Project (HCUP) to present contemporary trends in the risk-adjusted rate of perforated appendix per 1,000 inpatient discharges for appendicitis. Trends are examined by patient characteristics including age, race and ethnicity, community income, expected primary payer, urban or rural location of the residence, and region of the treatment hospital. Rates have been risk adjusted by age and sex. Differences that are noted in the text exhibit at least a 10 percent difference between estimates and achieved a level of statistical significance of 0.05 or better. |
|
Findings
Characteristics of discharges with appendicitis and perforated appendix Table 1 compares characteristics for all hospital stays in 2010 involving appendicitis versus stays specifically for perforated appendix. Overall, about 30 percent of the hospital stays for appendicitis involved a perforated appendix. Only a few patient characteristics demonstrated any difference in the distribution of discharges. Discharges of patients aged 18 to 44 years represented 42.3 percent of all appendicitis stays but only 29.0 percent of stays with a perforated appendix. Discharges covered by Medicare represented 9.9 percent of appendicitis stays but were a larger percentage of stays for a perforated appendix (16.0 percent). In terms of utilization, the length of stay for perforated appendix discharges was almost three times longer than all appendicitis discharges (5.2 and 1.8 days, respectively). The total cost for perforated appendix discharges was more than 50 percent higher than all appendicitis discharges ($12,800 and $7,800, respectively). |
| Table 1: Characteristics for appendicitis and perforated appendix, 2010 | ||
| All Appendicitis | Perforated Appendix | |
|---|---|---|
| Total number of inpatient discharges | 292,297 | 89,133 |
| Age group, in years (%) | ||
| 1–17 | 26.3 | 26.6 |
| 18–44 | 42.3 | 29.0 |
| 45-64 | 22.1 | 28.7 |
| 65 and older | 9.3 | 15.7 |
| Sex (%) | ||
| Male | 55.2 | 57.9 |
| Female | 44.8 | 42.1 |
| Race and Ethnicity (%) | ||
| White, non-Hispanic | 62.0 | 63.7 |
| African American, non-Hispanic | 7.5 | 7.8 |
| Hispanic (of any race) | 22.7 | 20.8 |
| Asian and Pacific Islander, non-Hispanic | 3.5 | 3.5 |
| Community income quartile (%) | ||
| First quartile (lowest income) | 24.9 | 24.9 |
| Second quartile | 23.6 | 24.5 |
| Third quartile | 25.7 | 25.8 |
| Fourth quartile (highest income) | 25.8 | 24.8 |
| Expected Primary Payer (%) | ||
| Private insurance | 52.8 | 48.0 |
| Medicare | 9.9 | 16.0 |
| Medicaid | 19.0 | 18.8 |
| Uninsured (self pay or no charge) | 13.3 | 12.6 |
| Urban or Rural Location (%) | ||
| Large central metropolitan | 32.8 | 31.9 |
| Large fringe metropolitan | 25.8 | 24.9 |
| Medium metropolitan | 19.1 | 19.8 |
| Small metropolitan | 7.3 | 7.4 |
| Micropolitan | 9.0 | 9.5 |
| Not metropolitan or micropolitan | 5.9 | 6.4 |
| Region (%) | ||
| Northeast | 19.3 | 17.6 |
| Midwest | 17.5 | 19.3 |
| South | 34.3 | 35.9 |
| West | 28.9 | 27.2 |
| Length of Stay, days (mean) | 1.8 | 5.2 |
| Total costs, U.S. dollars (mean) | 7,800 | 12,800 |
| Source: Agency for Healthcare Research and Quality (AHRQ), Center for Delivery, Organization, and Markets, Healthcare Cost and Utilization Project (HCUP), Nationwide Inpatient Sample (NIS) and State Inpatient Databases disparities analytic file, 2010 | ||
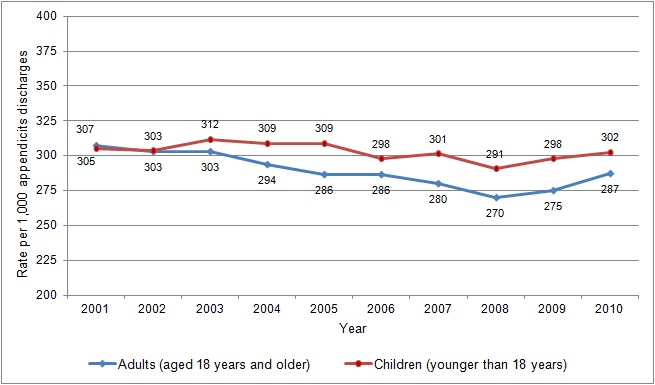
Overall trend The adjusted rate of perforated appendix among adults decreased 12 percent between 2001 and 2008, from a rate of 307 to 270 stays per 1,000 appendicitis discharges, and then did not significantly change in 2009 and 2010 (Figure 1). Rates of perforated appendix for pediatric discharges with appendicitis did not change significantly between 2001 and 2010. |
|
Figure 1. Trends in the rate of perforated appendix per 1,000 appendicitis discharges by age, 2001–2010
Note: Rates are adjusted for age and sex. Figure 1 is a line graph showing the rate per 1,000 appendicitis discharges by year for adults and children. Rates are adjusted for age and sex. The rates for adults aged 18 years and older were: 2001, 307; 2002, 303; 2003, 303; 2004, 294; 2005, 286; 2006, 286; 2007, 280; 2008, 270; 2009, 275; 2010, 287. The rates for children younger than 18 years were: 2001, 305; 2002, 303; 2003, 312; 2004, 309; 2005, 309; 2006, 298; 2007, 301; 2008, 291; 2009, 298; 2010, 302. Source: Agency for Healthcare Research and Quality (AHRQ), Center for Delivery, Organization, and Markets, Healthcare Cost and Utilization Project, Nationwide Inpatient Sample and AHRQ Prevention Quality Indicators. |
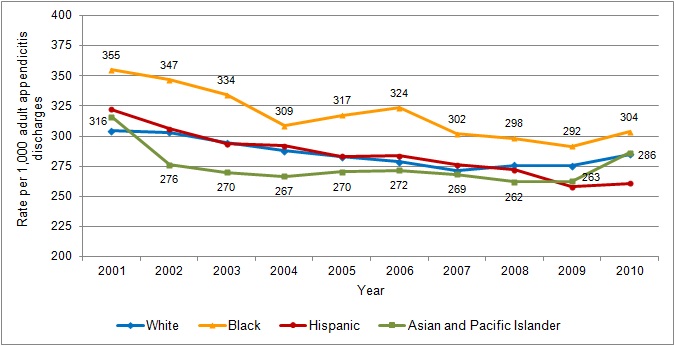
Rates of perforated appendix per 1,000 appendicitis discharges by race and ethnicity, 2001–2010 Black patients had higher rates of perforated appendix compared to White patients and other minority groups from 2001 to 2007, with the exception of 2004. For example, in 2002, the rate for Black patients was 13 to 25 percent higher than the rate for White patients and other minority groups. By 2010, only Black patients had a higher rate of perforated appendix (16 percent higher) than Hispanic patients. Rates for patients who were Hispanic or Asian and Pacific Islander did not differ from rates for White patients in all years. The adjusted rate of perforated appendix for adults decreased during the early years examined, reaching a low point in 2007, 2008, or 2009, depending on the racial and ethnic group. Rates did not significantly change through 2010 for each group after that low point. The decline was 11 percent for White patients between 2001 and 2007; 17 percent for Asian and Pacific Islander patients from 2001 to 2008; and almost 20 percent for Black and Hispanic patients between 2001 and 2009 (Figure 2). |
|
Figure 2. Trends in the rate of perforated appendix per 1,000 appendicitis discharges for adults by race and ethnicity, 2001–2010
Notes: Data labels apply to groups with the lowest and highest rates. Rates are adjusted for age and sex. Figure 2 is a line graph showing the rate per 1,000 adult appendicitis discharges by year for four groups of discharges. Rates are adjusted for age and sex. Black (highest rates): 2001, 355; 2002, 347; 2003, 334; 2004, 309; 2005, 317; 2006, 324; 2007, 302; 2008, 298; 2009, 292; 2010, 304. Asian and Pacific Islander (lowest rates): 2001, 316; 2002, 276; 2003, 270; 2004, 267; 2005, 270; 2006, 272; 2007, 269; 2008, 262; 2009, 263; 2010, 286; White: 2001, 305; 2002, 303; 2003, 295; 2004, 288; 2005, 283; 2006, 279; 2007, 271; 2008, 276; 2009, 275; 2010, 285. Hispanic: 2001, 322; 2002, 306; 2003, 294; 2004, 292; 2005, 283; 2006, 284; 2007, 276; 2008, 272; 2009, 258; 2010, 261. Source: Agency for Healthcare Research and Quality (AHRQ), Center for Delivery, Organization, and Markets, Healthcare Cost and Utilization Project, Nationwide Inpatient Sample and AHRQ Prevention Quality Indicators.
|
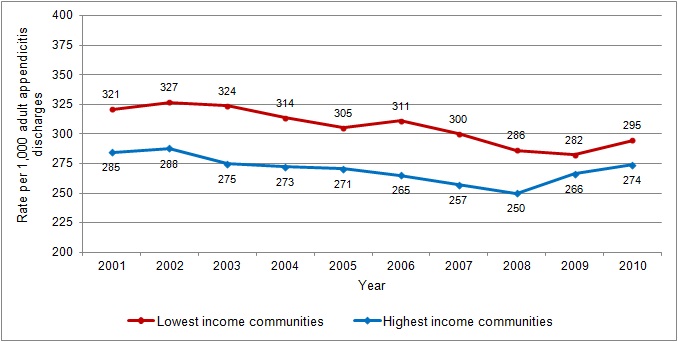
Rates of perforated appendix per 1,000 appendicitis discharges by community income, 2001–2010 Between 2001 and 2008, patients residing in the lowest income communities had consistently higher rates of perforated appendix than those residing in the highest income communities, with differences ranging from 13 to 18 percent. This difference did not persist in 2009 and 2010. The adjusted rates of perforated appendix for adults decreased by 12 percent for patients in communities with the lowest income from 2001 to 2009, and they decreased for patients in communities with the highest income from 2001 to 2008. Declining trends did not persist into 2010 (Figure 3). |
|
Figure 3. Trends in the rate of perforated appendix per 1,000 appendicitis discharges for adults by community income, 2001–2010
Notes: Rates are adjusted for age and sex. Figure 3 is a line graph showing the rate per 1,000 adult appendicitis discharges by year for two income levels. Rates are adjusted for age and sex. Lowest income communities: 2001, 321; 2002, 327; 2003, 324; 2004, 314; 2005, 305; 2006, 311; 2007, 300; 2008, 286; 2009, 282; 2010, 295. Highest income communities: 2001, 285; 2002, 288; 2003, 275; 2004, 273; 2005, 271; 2006, 265; 2007, 257; 2008, 250; 2009, 266; 2010, 274. Source: Agency for Healthcare Research and Quality (AHRQ), Center for Delivery, Organization, and Markets, Healthcare Cost and Utilization Project, Nationwide Inpatient Sample and AHRQ Prevention Quality Indicators.
|
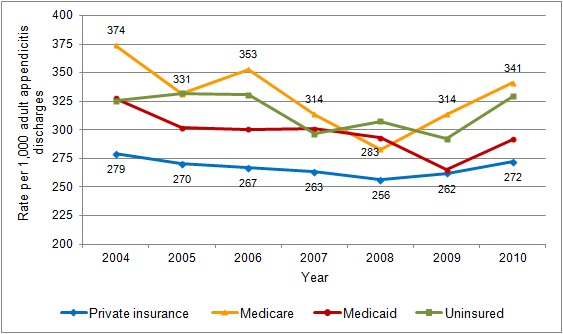
Rates of perforated appendix per 1,000 appendicitis discharges by expected primary payer, 2004–2010 The adjusted rates of perforated appendix for privately insured adult patients remained unchanged during the period examined; however, the rates decreased for all other expected primary payers between 2004, and they reached a low point in either 2008 or 2009 (depending on the group). The decrease from 2004 to the lowest point was 24 percent for Medicare patients (in 2008); 19 percent for Medicaid patients (in 2009); and 10 percent for uninsured patients (in 2009) (Figure 4). In addition, the rates of perforated appendix increased from the lowest point to 2010 for three payer groups: a 21 percent increase for Medicare patients; a 10 percent increase for Medicaid patients; and a 13 percent increase for uninsured patients. The adjusted rates of perforated appendix for Medicare and uninsured patients were consistently higher than the rates for privately insured patients for all years. Compared to privately insured patients, Medicare patients had rates 10 to 34 percent higher and uninsured patients had rates 11 to 24 percent higher. From 2004 to 2008, Medicaid patients had rates 12 to 17 percent higher than privately insured patients. |
|
Figure 4. Trends in the rate of perforated appendix per 1,000 appendicitis discharges for adults by expected primary payer, 2004–2010a
a Data for 2001–2003 are not available. Figure 4 is a line graph showing the rate per 1,000 adult appendicitis discharges by year for four insurance groups. Data for 2001 through 2003 are not available. Rates are adjusted for age and sex. Private insurance (lowest rates): 2004, 279; 2005, 270; 2006, 267; 2007, 263; 2008, 256; 2009, 262; 2010, 272. Medicare (highest rates): 2004, 374; 2005, 331; 2006, 353; 2007, 314; 2008, 283; 2009, 314; 2010, 341. Medicaid: 2004, 328; 2005, 302; 2006, 301; 2007, 301; 2008, 293; 2009, 265; 2010, 292. Uninsured: 2004, 326; 2005, 332; 2006, 330; 2007, 296; 2008, 308; 2009, 292; 2010, 330. Source: Agency for Healthcare Research and Quality (AHRQ), Center for Delivery, Organization, and Markets, Healthcare Cost and Utilization Project, Nationwide Inpatient Sample and AHRQ Prevention Quality Indicators.
|
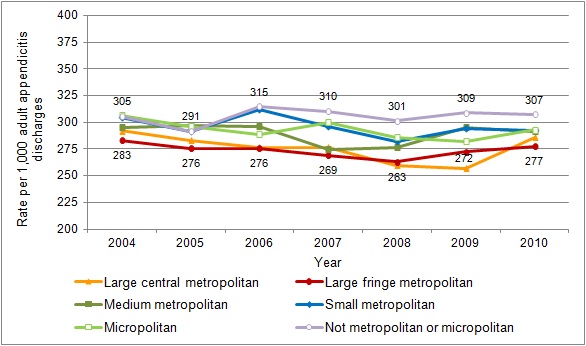
Rates of perforated appendix per 1,000 appendicitis discharges by urban or rural location, 2004–2010 From 2004 to 2009, the adjusted rate of perforated appendix for adults decreased 12 percent among patients residing in large central metropolitan areas and then increased 11 percent from 2009 to 2010 (Figure 5). The trends in other metropolitan and non-metropolitan areas did not demonstrate a significant change over time. Patients residing in rural areas (not metropolitan or micropolitan) had adjusted rates of perforated appendix that were 12 to 20 percent higher than individuals residing in large central and fringe metropolitan areas from 2006 to 2009. By 2010, there were no differences in the rates of perforated appendix across urban or rural location. |
|
Figure 5. Trends in the rate of perforated appendix per 1,000 appendicitis discharges for adults by urban or rural location, 2004–2010a
a Data for 2001–2003 are not available. Figure 5 is a line graph showing the rate per 1,000 adult appendicitis discharges per year for six community sizes. Data for 2001 through 2003 are not available. Rates are adjusted for age and sex. Large fringe metropolitan (lowest rates): 2004, 283; 2005, 276; 2006, 276; 2007, 269; 2008, 263; 2009, 272; 2010, 277. Not metropolitan or micropolitan (highest rates): 2004, 305; 2005, 291; 2006, 315; 2007, 310; 2008, 301; 2009, 309; 2010, 307. Large central metropolitan: 2004, 292; 2005, 283; 2006, 276; 2007, 276; 2008, 260; 2009, 257; 2010, 286. Medium metropolitan: 2004, 295; 2005, 297; 2006, 296; 2007, 275; 2008, 276; 2009, 295; 2010, 291. Small metropolitan: 2004, 305; 2005, 292; 2006, 312; 2007, 296; 2008, 282; 2009, 294; 2010, 292. Micropolitan: 2004, 307; 2005, 296; 2006, 288; 2007, 300; 2008, 286; 2009, 282; 2010, 293. Source: Agency for Healthcare Research and Quality (AHRQ), Center for Delivery, Organization, and Markets, Healthcare Cost and Utilization Project, Nationwide Inpatient Sample and AHRQ Prevention Quality Indicators.
|
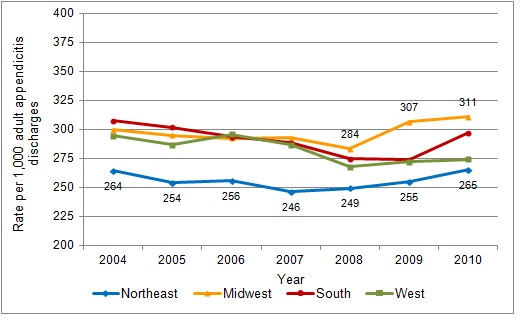
Rates of perforated appendix per 1,000 appendicitis discharges by region, 2004–2010 Patients treated in the Northeast often had lower adjusted rates of perforated appendix than patients treated in other regions. Rates of perforated appendix in the Midwest were 14 to 20 percent higher than rates in the Northeast in all years. Rates of perforated appendix in the South were 10 to 19 percent higher than rates in the Northeast in all years except 2009. Rates of perforated appendix in the West were 11 to 16 percent higher than rates in the Northeast from 2004 to 2007. From 2004 to 2009, the adjusted rate of perforated appendix for adults decreased 11 percent in the South, but this downward trend reversed from 2009 to 2010 (Figure 6). Trends in other regions did not demonstrate a significant change over time. |
|
Figure 6. Trends in the rate of perforated appendix per 1,000 appendicitis discharges for adults by region, 2004–2010a
a Data for 2001–2003 are not available. Figure 6 is a line graph showing the rate per 1,000 adult appendicitis discharges by year for four regions. Data for 2001 through 2003 are not available. Northeast (lowest rates): 2004, 264; 2005, 254; 2006, 256; 2007, 246; 2008, 249; 2009, 255; 2010, 265. Midwest (highest rates): 2004, 300; 2005, 295; 2006, 293; 2007, 293; 2008, 284; 2009, 307; 2010, 311. South: 2004, 307; 2005, 302; 2006, 294; 2007, 289; 2008, 275; 2009, 274; 2010, 297. West: 2004, 294; 2005, 287; 2006, 296; 2007, 287; 2008, 268; 2009, 272; 2010, 274. Source: Agency for Healthcare Research and Quality (AHRQ), Center for Delivery, Organization, and Markets, Healthcare Cost and Utilization Project, Nationwide Inpatient Sample and AHRQ Prevention Quality Indicators. Rates are adjusted for age and sex.
|
Data Source
The estimates in this Statistical Brief are based upon data from the Healthcare Cost and Utilization Project (HCUP) 2001–2010 Nationwide Inpatient Samples (NIS) and disparities analysis files created from the State Inpatient Databases (SID). The disparities analysis files are designed to provide national estimates on racial disparities using weighted records from a sample of hospitals in the SID. State Inpatient Databases (SID) disparities analysis file Race and ethnicity measures can be problematic in hospital discharge databases. Some States do not collect information on race and ethnicity from hospitals and, within States that collect the information, some hospitals do not code race and ethnicity reliably. A disparities analysis file designed to provide national estimates by race and ethnicity was constructed using the HCUP SID from participating States that report patient race and ethnicity. This file was created using a stratified, weighted sample of hospitals with good reporting of patient race and ethnicity. It contains data from about 2,000 hospitals and is a 40-percent sample of community, non-rehabilitation hospitals in the United States. For 2001 and 2002, SID data from the following 22 States were used: AZ, CA, CO, CT, FL, GA, HI, KS, MA, MD, MI, MO, NJ, NY, PA, RI, SC, TN, TX, VA, VT, and WI. For 2003, SID data from NH were added, for a total of 23 States. In 2004, SID data from AR were added, but SID data from PA were not available. In 2005, SID data from OK were added, but SID data from VA were not available. In 2006, SID data from UT and VA were added, for a total of 25 States. In 2007, SID data from WY were added, for a total of 26 States. In 2008, SID data from KY, ME, NV, OR, and PA were added, for a total of 31 States. In 2009, SID data from IA, IL, NM, SD, and WA were added, for a total of 36 States. In 2010, SID data from ME, NH, and WA were not available; SID from AK, IN, MS, and NC were added, for a total of 37 states.7 Many hypothesis tests were conducted for this Statistical Brief. We required a significance level of less than 0.05 in conjunction with a 10 percent difference in the rates for individual tests. Definitions Perforated Appendix Rates of perforated appendix for adults and children were based on the AHRQ Prevention Quality Indicators (PQIs) for perforated appendix (PQI #2 and PDI #17), version 4.1 of the PQI software. Rates were adjusted by age and sex using hospitalizations for 2000 in the United States as the standard population. The PQI for perforated appendix for adults includes the following cases in the denominator (population at risk):
The numerator (outcome of interest) for the PQI for perforated appendix includes the following:
The denominators exclude cases that are:
Identical criteria were used to identify perforated appendix cases for children, except the calculation included discharges of individuals aged 1 to 17 years only. Prevention Quality Indicators The Prevention Quality Indicators (PQIs; version 4.1), a component of the AHRQ Quality Indicators (QIs), are a set of measures that can be used with hospital inpatient discharge data to identify access to and quality of care for "ambulatory care-sensitive conditions." These are conditions for which good outpatient care can potentially prevent the need for hospitalization or for which early intervention can prevent complications or more severe disease. PQI rates can also be affected by other factors such as disease prevalence. The PQIs are adjusted for age and sex. Further information on the AHRQ QIs, including documentation and free software downloads, is available at http://www.qualityindicators.ahrq.gov/. It also includes information on the Pediatric Quality Indicators (PDIs, formerly referred to as PedQIs). The PDIs contain measures of potentially preventable hospitalizations for children for asthma, gastroenteritis, diabetes short-term complications, and perforated appendix. Additional information on how the QI software was applied to the HCUP data for the statistics reported in this Statistical Brief is available in Coffey et al., 2012.8 Types of hospitals included in HCUP HCUP is based on data from community hospitals, which are defined as short-term, non-Federal, general, and other hospitals, excluding hospital units of other institutions (e.g., prisons). HCUP data include obstetrics and gynecology, otolaryngology, orthopedic, cancer, pediatric, public, and academic medical hospitals. Excluded are long-term care, rehabilitation, psychiatric, and alcoholism and chemical dependency hospitals. However, if a patient received long-term care, rehabilitation, or treatment for psychiatric or chemical dependency conditions in a community hospital, the discharge record for that stay will be included in the Nationwide Inpatient Sample (NIS) and the SID disparities analysis file. Unit of analysis The unit of analysis is the hospital discharge (i.e., the hospital stay), not a person or patient. This means that a person who is admitted to the hospital multiple times in one year will be counted each time as a separate "discharge" from the hospital. Costs and charges Total hospital charges were converted to costs using HCUP Cost-to-Charge Ratios based on hospital accounting reports from the Centers for Medicare & Medicaid Services (CMS).9 Costs will reflect the actual expenses incurred in the production of hospital services, such as wages, supplies, and utility costs; charges represent the amount a hospital billed for the case. For each hospital, a hospital-wide cost-to-charge ratio is used. Hospital charges reflect the amount the hospital billed for the entire hospital stay and do not include professional (physician) fees. For the purposes of this Statistical Brief, costs are reported to the nearest hundred. Patients' race and ethnicity HCUP uniform coding includes race and ethnicity in one data element (RACE). Because of variability in the collection of race and ethnicity information in the State data provided to HCUP, HCUP maintains a uniform set of categories based on race definitions used in the 1977 Office of Management and Budget (OMB) Directive 15. It uses the combined race-ethnicity format (separate categories for Hispanic and five Non-Hispanic racial groups—White, Black, Asian and Pacific Islander, American Indian or Alaska Native, and Other). When a State and its hospitals collect Hispanic ethnicity separately from race, HCUP assigns the data to the combined race and ethnicity categorization and uses Hispanic ethnicity to override any other race category to create uniform coding across States. There is also limited reporting of American Indian or Alaska Native (AIAN) in the HCUP data, so statistics for this group were not presented. This Statistical Brief reports race and ethnicity for the following categories: White Non-Hispanic; African American Non-Hispanic, Asian or Pacific Islander Non-Hispanic, and Hispanic (of any race). Median community-level income Median community-level income is the median household income of the patient's ZIP Code of residence. The cut-offs for the quartile designation are determined yearly using ZIP Code demographic data obtained from the Nielsen Company. The income quartile is missing for homeless and foreign patients. Payer Payer is the expected primary payer for the hospital stay. To make coding uniform across all HCUP data sources, payer combines detailed categories into general groups:
Encounters billed to the State Children's Health Insurance Program (SCHIP) may be classified as Medicaid, Private Insurance, or Other, depending on the structure of the State program. Because most State data do not identify SCHIP patients specifically, it is not possible to present this information separately. When more than one payer is listed for a hospital discharge, the first-listed payer is used. Location of patients' residence Place of residence is based on the urban-rural classification scheme for U.S. counties developed by the National Center for Health Statistics (NCHS):
Region Region is one of the four regions defined by the U.S. Census Bureau and is based on the region of the treatment hospital:
About HCUP HCUP is a family of powerful healthcare databases, software tools, and products for advancing research. Sponsored by the Agency for Healthcare Research and Quality (AHRQ), HCUP includes the largest all-payer encounter-level collection of longitudinal healthcare data (inpatient, ambulatory surgery, and emergency department) in the United States, beginning in 1988. HCUP is a Federal-State-Industry Partnership that brings together the data collection efforts of many organizations—such as State data organizations, hospital associations, private data organizations, and the Federal government—to create a national information resource. HCUP would not be possible without the contributions of the following data collection Partners from across the United States: Alaska State Hospital and Nursing Home Association Arizona Department of Health Services Arkansas Department of Health California Office of Statewide Health Planning and Development Colorado Hospital Association Connecticut Hospital Association Florida Agency for Health Care Administration Georgia Hospital Association Hawaii Health Information Corporation Illinois Department of Public Health Indiana Hospital Association Iowa Hospital Association Kansas Hospital Association Kentucky Cabinet for Health and Family Services Louisiana Department of Health and Hospitals Maine Health Data Organization Maryland Health Services Cost Review Commission Massachusetts Center for Health Information and Analysis Michigan Health & Hospital Association Minnesota Hospital Association Mississippi Department of Health Missouri Hospital Industry Data Institute Montana MHA - An Association of Montana Health Care Providers Nebraska Hospital Association Nevada Department of Health and Human Services New Hampshire Department of Health & Human Services New Jersey Department of Health New Mexico Department of Health New York State Department of Health North Carolina Department of Health and Human Services North Dakota (data provided by the Minnesota Hospital Association) Ohio Hospital Association Oklahoma State Department of Health Oregon Association of Hospitals and Health Systems Oregon Health Policy and Research Pennsylvania Health Care Cost Containment Council Rhode Island Department of Health South Carolina Budget & Control Board South Dakota Association of Healthcare Organizations Tennessee Hospital Association Texas Department of State Health Services Utah Department of Health Vermont Association of Hospitals and Health Systems Virginia Health Information Washington State Department of Health West Virginia Health Care Authority Wisconsin Department of Health Services Wyoming Hospital Association About the NIS The HCUP Nationwide Inpatient Sample (NIS) is a nationwide database of hospital inpatient stays. The NIS is nationally representative of all community hospitals (i.e., short-term, non-Federal, nonrehabilitation hospitals). The NIS is a sample of hospitals and includes all patients from each hospital, regardless of payer. It is drawn from a sampling frame that contains hospitals comprising more than 95 percent of all discharges in the United States. The vast size of the NIS allows the study of topics at both the national and regional levels for specific subgroups of patients. In addition, NIS data are standardized across years to facilitate ease of use. For More Information For more information about HCUP, visit http://www.hcup-us.ahrq.gov/. For additional HCUP statistics, visit HCUPnet, our interactive query system, at https://datatools.ahrq.gov/hcupnet. For information on other hospitalizations in the United States, download HCUP Facts and Figures: Statistics on Hospital-Based Care in the United States in 2009, located at http://www.hcup-us.ahrq.gov/reports.jsp. For a detailed description of HCUP, more information on the design of the Nationwide Inpatient Sample (NIS), and methods to calculate estimates, please refer to the following publications: Introduction to the HCUP Nationwide Inpatient Sample, 2009. Online. May 2011. U.S. Agency for Healthcare Research and Quality. http://hcup-us.ahrq.gov/db/nation/nis/NIS_2009_INTRODUCTION.pdf. Accessed June 25, 2013. Houchens R, Elixhauser A. Final Report on Calculating Nationwide Inpatient Sample (NIS) Variances, 2001. HCUP Methods Series Report #2003-2. Online. June 2005 (revised June 6, 2005). U.S. Agency for Healthcare Research and Quality. http://www.hcup-us.ahrq.gov/reports/methods/2003_02.pdf. Accessed June 25, 2013. Houchens RL, Elixhauser A. Using the HCUP Nationwide Inpatient Sample to Estimate Trends. (Updated for 1988–2004). HCUP Methods Series Report #2006–05. Online. August 18, 2006. U.S. Agency for Healthcare Research and Quality. http://www.hcup-us.ahrq.gov/reports/methods/2006_05_NISTrendsReport_1988-2004.pdf. Accessed June 25, 2013. Suggested Citation Barrett ML (ML Barrett, Inc), Hines AL (Truven Health), and Andrews RM (AHRQ). Trends in Rates of Perforated Appendix, 2001–2010.HCUP Statistical Brief #159. July 2013. Agency for Healthcare Research and Quality, Rockville, MD. http://www.hcup-us.ahrq.gov/reports/statbriefs/sb159.pdf. *** AHRQ welcomes questions and comments from readers of this publication who are interested in obtaining more information about access, cost, use, financing, and quality of healthcare in the United States. We also invite you to tell us how you are using this Statistical Brief and other HCUP data and tools, and to share suggestions on how HCUP products might be enhanced to further meet your needs. Please e-mail us at hcup@ahrq.gov or send a letter to the address below:Irene Fraser, Ph.D., Director Center for Delivery, Organization, and Markets Agency for Healthcare Research and Quality 540 Gaither Road Rockville, MD 20850 1 Robert Wood Johnson Foundation. Impact of the Economy on Health Care. 2009. http://hcfo.org/publications/impact-economy-health-care.html. 2 Morternsen K, Chen J. The great recession and racial and ethnic disparities in health services use. JAMA Internal Medicine. 2013;173(23):315–6. 3 Agency for Healthcare Research and Quality. Prevention Quality Indicators #2: Technical Specifications. Perforated Appendix Admission Rate [version 4.4]. Rockville, MD: Agency for Healthcare Research and Quality (AHRQ); 2012 Mar. p. 1. 4 Siddique K, Mirza S, and Harinath G. Appendiceal inflammation affects the length of stay following appendicectomy amongst children: a myth or reality? Frontiers of Medicine. 2013;7(2):264–9. 5 Livingston EH, Woodward WA, Sarosi GA, Haley RW. Disconnect between incidence of nonperforated and perforated appendicitis: implications for pathophysiology and management. Annals of Surgery. 2007;245(6):886–92. 6 Braveman P, Schaaf VM, Egerter S, Bennett T, Schecter W. Insurance-related difference in the risk of ruptured appendix. New England Journal of Medicine. 1994;331(7):444–9. 7 Bratton SL, Haberkern CM, Waldhausen JHT. Acute appendicitis risks of complications: age and Medicaid insurance. Pediatrics. 2000;106(1 Pt 1):75–8. 8 Coffey R, Barret M, Houchens R, Moy E, Andrews R, Coenen N. Methods Applying AHRQ Quality Indicators to Healthcare Cost and Utilization Project (HCUP) Data for the Eleventh (2013) National Healthcare Quality Report (NHQR) and National Healthcare Disparities Report (NHDR). HCUP Methods Series Report #2012-03. Online. November 12, 2012. U.S. Agency for Healthcare Research and Quality. http://www.hcup-us.ahrq.gov/reports/methods/2012_03.pdf. Accessed June 25, 2013. 9 HCUP Cost-to-Charge Ratio Files (CCR). Healthcare Cost and Utilization Project (HCUP). 2001–2009. U.S. Agency for Healthcare Research and Quality, Rockville, MD. Updated September 2012. http://www.hcup-us.ahrq.gov/db/state/costtocharge.jsp. Accessed June 25, 2013. |
| Internet Citation: Statistical Brief #159. Healthcare Cost and Utilization Project (HCUP). May 2016. Agency for Healthcare Research and Quality, Rockville, MD. hcup-us.ahrq.gov/reports/statbriefs/sb159.jsp. |
| Are you having problems viewing or printing pages on this website? |
| If you have comments, suggestions, and/or questions, please contact hcup@ahrq.gov. |
| If you are experiencing issues related to Section 508 accessibility of information on this website, please contact hcup@ahrq.gov. |
| Privacy Notice, Viewers & Players |
| Last modified 5/13/16 |