STATISTICAL BRIEF #151 |
March 2013
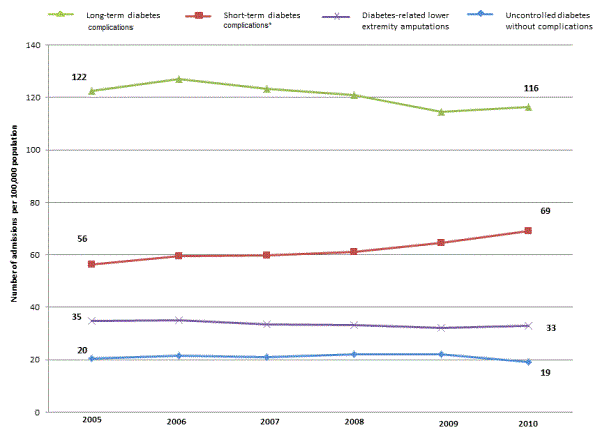
Celeste M. Torio, Ph.D., M.P.H., Anne Elixhauser, Ph.D., and Roxanne M. Andrews, Ph.D. Introduction Improving the quality of healthcare while simultaneously containing costs continues to be a major priority for the nation, particularly for policymakers and public and private payers. One area where higher quality and lower costs coincide is potentially preventable hospital admissions—inpatient stays that could be prevented with high-quality primary and preventive care. High rates of these potentially preventable hospital admissions identify areas where possible improvements in the healthcare delivery system could be made to enhance patient outcomes and decrease costs. Positive changes in these rates over time may signal an improvement in the quality of ambulatory care, in access to timely and effective treatment of certain conditions for specific populations, or in patients' adoption of healthy behaviors. This Statistical Brief presents data from the Healthcare Cost and Utilization Project (HCUP) on changes in the rates of potentially preventable hospital admissions and their associated total hospital costs. It updates statistics previously reported for the 1997 through 2004 time period.1 Admission rates for selected chronic and acute conditions in adults and children for 2005 through 2010 were developed using the Agency for Healthcare Research and Quality (AHRQ) Prevention Quality Indicators (PQIs). The conditions examined for adults aged 18 years and older were related to diabetes, circulatory diseases, chronic respiratory diseases, and select acute conditions (bacterial pneumonia, dehydration, and urinary tract infection). The conditions examined for children younger than 18 years were diabetes, asthma, gastroenteritis, and urinary tract infection. All differences between estimates noted in the text are significant at the 0.05 level or better. Findings For the conditions examined here, the number of potentially preventable hospital admissions for adults decreased 6.2 percent from 4.1 million stays in 2005 to 3.9 million stays in 2010. Total hospital costs related to these potentially preventable admissions for adults decreased only 2 percent from $32.6 billion in 2005 to $31.9 billion in 2010. The total number of potentially preventable hospital admissions for children decreased considerably more than those for adults—nearly 40 percent from approximately 300,000 to 185,000. The corresponding hospital costs declined about 32 percent. Changes in potentially preventable hospital admissions among adults with diabetes Changes in hospital admission rates for adults with diabetes varied between 2005 and 2010 (figure 1). Between 2005 and 2010, there were no statistically significant changes in rates for long-term diabetes complications (i.e., renal, visual, neurological, and circulatory disorders), for diabetes-related lower extremity amputations, or for uncontrolled diabetes without complications. In contrast, rates for short-term diabetes complications (i.e., diabetic ketoacidosis, hyperosmolarity, and coma) significantly increased 23 percent. |
|
|
Figure 1. Rates of admissions for diabetes, adults older than 18 years. Trendline chart; Long-term diabetes; 2005, 122; 2006, 127; 2007, 123; 2008, 121; 2009, 114; 2010, 116; Short-term diabetes*; 2005, 56; 2006, 60; 2007, 60; 2008, 61; 2009, 64; 2010, 69; Diabetes-related lower extremity amputations; 2005, 35; 2006, 35; 2007, 33; 2008, 33; 2009, 32; 2010, 33; Uncontrolled diabetes without complications; 2005, 20; 2006, 22; 2007, 21; 2008, 22; 2009, 22; 2010, 19; Source: AHRQ, Center for Delivery, Organization, and Markets, Healthcare Cost and Utilization Project, Nationwide Inpatient Sample, 2005-2010. *Differences in rates of admission between 2005 and 2010 for short-term diabetes complications were statistically significant at p<0.05. Rates were adjusted for patient age and sex. |
Total hospital costs (table 1) for potentially preventable hospital admissions related to diabetes increased nearly 12 percent from $5.7 billion in 2005 to $6.4 billion in 2010. The greatest increase in total hospital costs was for short-term diabetes complications, which increased 32 percent during this 6-year time period.
|
| Table 1. Total hospital costs for preventable conditions, 2005 and 2010 | |||
| Preventable conditions | Total hospital costs* (in millions) | Comparison between 2005-2010 (percentage change) | |
|---|---|---|---|
| 2005 | 2010 | ||
| Adults (18 years and older) | $32,585 | $31,871 | -2.2% |
| Diabetes | $5,714 | $6,355 | +11.9% |
| Uncontrolled diabetes without Complications | $214 | $230† | +7.5% |
| Short-term diabetes complications | $888 | $1,168† | +31.5% |
| Long-term diabetes complications | $2,988 | $3,192 | +6.8% |
| Diabetes-related lower extremity amputations | $1,624 | $1,765† | +8.7% |
| Circulatory diseases | $9,192 | $8,562 | -6.9% |
| Angina without procedure | $403 | $254† | -37.0% |
| Congestive heart failure | $8,240 | $7,420† | -10.0% |
| Hypertension | $549 | $888† | +61.7% |
| Hypertension | 549 | $888† | +61.7% |
| Chronic respiratory diseases | $5,489 | $6,115 | +11.4% |
| Asthma | $1,781 | $1,906† | +7.0% |
| Chronic obstructive pulmonary disease | $3,708 | $4,209† | +13.5% |
| Acute conditions | $12,190 | $10,839 | -11.1% |
| Bacterial pneumonia | $8,115 | $6,723† | -17.2% |
| Dehydration | $1,572 | $1,068† | -32.1% |
| Urinary tract infection | $2,503 | $3,048† | +21.8% |
| Children (Less than 18 years old) | $941 | $644 | -31.6% |
| Short-term diabetes complications (6-17 years) | $94 | $71† | -24.5% |
| Pediatric asthma (2-17 years) | $381 | $315† | -17.3% |
| Pediatric gastroenteritis (3 months to 17 years) | $326 | $148† | -54.6% |
| Urinary tract infection (3 months to 17 years) | $140 | $110† | -21.4% |
| *All costs are adjusted to 2010 dollars using the overall Consumer Price Index. †p<0.05 |
|||
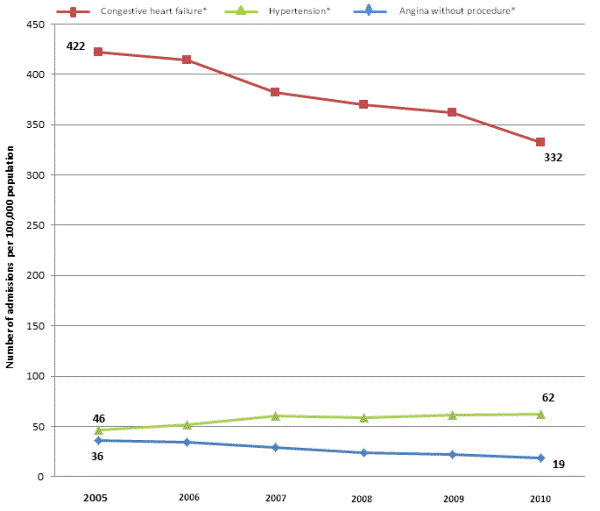
Changes in potentially preventable hospital admissions among adults with circulatory diseases
Between 2005 and 2010, potentially preventable hospital admission rates related to circulatory diseases in adults showed significant changes—some increasing and some decreasing (figure 2). For hypertension, the admission rate increased 33 percent. In contrast, the admission rates for angina without a procedure and for congestive heart failure decreased 49 percent and 21 percent, respectively. |
|
Figure 2. Rates of admissions for circulatory diseases, adults 18 years and older. Trendline chart; Congestive heart failure*; 2005, 422; 2006, 414; 2007, 382; 2008, 370; 2009, 362; 2010, 322; Hypertension*; 2005, 46; 2006, 51; 2007, 61; 2008, 59; 2009, 61; 2010, 62; Angina without procedure*; 2005, 36; 2006, 34; 2007, 29; 2008, 23; 2009, 22; 2010, 19; Source: AHRQ, Center for Delivery, Organization, and Markets, Healthcare Cost and Utilization Project, Nationwide Inpatient Sample, 2005-2010. *All differences in rates of admission between 2005 and 2010 were statistically significant at p<0.05. Rates were adjusted for patient age and sex. |
Between 2005 and 2010, the total hospital costs for potentially preventable circulatory disease admissions decreased about 7 percent (table 1). Total hospital costs for angina without a procedure decreased 37 percent, congestive heart failure costs decreased 10 percent, and hypertension hospitalization costs increased 62 percent.
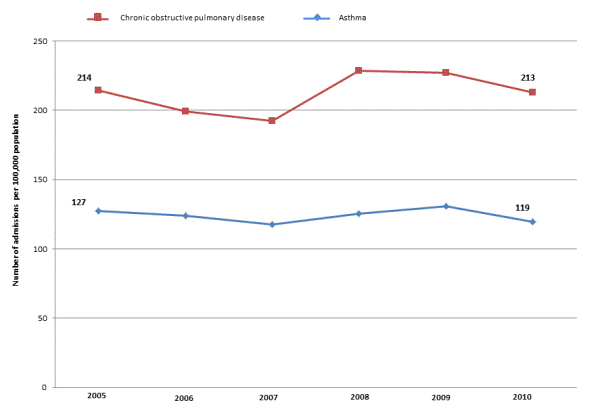
Changes in potentially preventable hospital admissions among adults with chronic respiratory diseases Between 2005 and 2010, admission rates for adult asthma and chronic obstructive pulmonary disease (COPD) remained stable (figure 3), while costs increased. For asthma, the total hospital costs increased 7 percent; costs for COPD increased 14 percent (table 1). |
|
Figure 3. Rates of admissions for chronic respiratory diseases, adults, 18 years and older.
Trendline chart; Long-term diabetes; 2005, 214; 2006, 199; 2007, 193; 2008, 229; 2009, 227; 2010, 213; Short-term diabetes*; 2005, 127; 2006, 124; 2007, 118; 2008, 125; 2009, 131; 2010, 119; Source: AHRQ, Center for Delivery, Organization, and Markets, Healthcare Cost and Utilization Project, Nationwide Inpatient Sample, 2005-2010. Both differences in rates of admission between 2005 and 2010 were statistically significant at p<0.05. Rates were adjusted for patient age and sex.
|
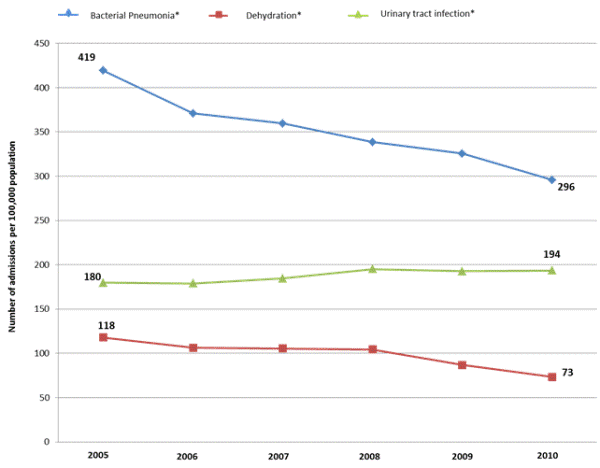
Changes in potentially preventable hospital admissions among adults with select acute conditions Changes in hospitalization rates for potentially preventable hospital admissions among adults with acute conditions such as bacterial pneumonia, dehydration, and urinary tract infections varied widely between 2005 and 2010 (figure 4). The admission rate for bacterial pneumonia decreased 30 percent, whereas the rate for dehydration decreased 38 percent. In contrast, the rate for urinary tract infection showed a small but statistically significant 8 percent increase. |
|
Figure 4. Rates of admissions for acute conditions, adults 18 years and older. Trendline chart; Bacterial Pneumonia*; 2005, 419; 2006, 370; 2007, 360; 2008, 340; 2009, 325; 2010, 296; Dehydration*; 2005, 180; 2006, 180; 2007, 184; 2008, 195; 2009, 193; 2010, 194; Urinary tract infection*; 2005, 118; 2006, 105; 2007, 104; 2008, 104; 2009, 88; 2010, 73; Source: AHRQ, Center for Delivery, Organization, and Markets, Healthcare Cost and Utilization Project, Nationwide Inpatient Sample, 2005-2010. *All differences in rates of admission between 2005 and 2010 were statistically significant at p<0.05. Rates were adjusted for patient age and sex.
|
Between 2005 and 2010, total hospital costs decreased 17 percent for bacterial pneumonia and 32 percent for dehydration (table 1). Costs for urinary tract infection increased 22 percent.
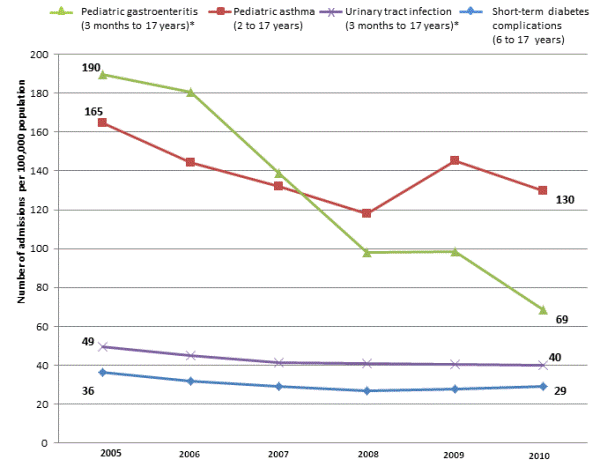
Changes in potentially preventable hospital admissions among children for select conditions Between 2005 and 2010, pediatric potentially preventable hospital admissions for short-term diabetes complications and asthma did not change significantly (figure 5). Admission rates for pediatric gastroenteritis between 2005 and 2010 decreased 64 percent; rates for pediatric urinary tract infection decreased 19 percent (figure 5). |
|
Figure 5. Rates of admissions for pediatric preventable conditions. Trendline chart; Pediatric gastroenteritis (3 months to 17 years)*; 2005, 190; 2006, 181; 2007, 139; 2008, 98; 2009, 99; 2010, 69; Pediatric asthma (2 to 17 years); 2005, 165; 2006, 144; 2007, 132; 2008, 118; 2009, 145; 2010, 130; Urinary tract infection (3 months to 17 years)*; 2005, 49; 2006, 45; 2007, 41; 2008, 41; 2009, 40; 2010, 40; Short-term diabetes complications (6 to 17 years); 2005, 36; 2006, 32; 2007, 29; 2008, 26; 2009, 28; 2010, 29. Source: AHRQ, Center for Delivery, Organization, and Markets, Healthcare Cost and Utilization Project, Nationwide Inpatient Sample, 2005-2010. *Differences in rates of admission between 2005 and 2010 for gastroenteritis and urinary tract infection were statistically significant at p<0.05. Rates were adjusted for patient age and sex.
|
Total hospital costs for short-term diabetes complications among children decreased 25 percent (table 1). Similarly, total hospital costs for pediatric asthma decreased 17 percent, pediatric gastroenteritis costs decreased 55 percent, and urinary tract infection costs decreased 21 percent.
Data Source The estimates in this Statistical Brief are based upon data from the Healthcare Cost and Utilization Project (HCUP) 2010 Nationwide Inpatient Sample (NIS). Historical data were drawn from the 2005-2010 NIS. The statistics were generated from HCUPnet, a free, online query system that provides users with immediate access to the largest set of publicly available, all-payer national, regional, and State-level hospital care databases from HCUP. Definitions Types of hospitals included in HCUP HCUP is based on data from community hospitals, defined as short-term, non-Federal, general, and other hospitals, excluding hospital units of other institutions (e.g., prisons). HCUP data include obstetrics and gynecology, otolaryngology, orthopedic, cancer, pediatric, public, and academic medical hospitals. Excluded are long-term care, rehabilitation, psychiatric, and alcoholism and chemical dependency hospitals. However, if a patient received long-term care, rehabilitation, or treatment for psychiatric or chemical dependency conditions in a community hospital, the discharge record for that stay will be included in the NIS. Unit of analysis The unit of analysis is the hospital discharge (i.e., the hospital stay), not a person or patient. This means that a person who is admitted to the hospital multiple times in one year will be counted each time as a separate "discharge" from the hospital. Costs and charges Total hospital charges were converted to costs using HCUP Cost-to-Charge Ratios based on hospital accounting reports from the Centers for Medicare & Medicaid Services (CMS).2 Costs will reflect the actual expenses incurred in the production of hospital services, such as wages, supplies, and utility costs; charges represent the amount a hospital billed for the case. For each hospital, a hospital-wide cost-to-charge ratio is used. Hospital charges reflect the amount the hospital billed for the entire hospital stay and do not include professional (physician) fees. For the purposes of this Statistical Brief, costs are reported to the nearest hundred. Mean cost per day is calculated as the mean cost per stay divided by the mean length of stay. Prevention Quality Indicators The Prevention Quality Indicators (PQIs; version 4.1), a component of the AHRQ Quality Indicators (QIs), are a set of measures that can be used with hospital inpatient discharge data to identify access to and quality of care for "ambulatory care-sensitive conditions." These are conditions for which good outpatient care can potentially prevent the need for hospitalization or for which early intervention can prevent complications or more severe disease. PQI rates can also be affected by other factors such as disease prevalence. The PQIs are adjusted for age and sex. Further information on the AHRQ QIs, including documentation and free software downloads, is available at http://www.qualityindicators.ahrq.gov/. It also includes information on the Pediatric Quality Indicators (PDIs, formerly referred to as PedQIs), which includes measures of potentially preventable hospitalizations for children for asthma, gastroenteritis, diabetes short-term complications, and perforated appendix. Additional information on how the QI software was applied to the HCUP data for the statistics reported in this Statistical Brief is available in Coffey, et al., 20123. About HCUP HCUP is a family of powerful healthcare databases, software tools, and products for advancing research. Sponsored by the Agency for Healthcare Research and Quality (AHRQ), HCUP includes the largest all-payer encounter-level collection of longitudinal healthcare data (inpatient, ambulatory surgery, and emergency department) in the United States, beginning in 1988. HCUP is a Federal-State-Industry Partnership that brings together the data collection efforts of many organizations—such as State data organizations, hospital associations, private data organizations, and the Federal government—to create a national information resource. HCUP would not be possible without the contributions of the following data collection Partners from across the United States: Alaska State Hospital and Nursing Home Association Arizona Department of Health Services Arkansas Department of Health California Office of Statewide Health Planning and Development Colorado Hospital Association Connecticut Hospital Association Florida Agency for Health Care Administration Georgia Hospital Association Hawaii Health Information Corporation Illinois Department of Public Health Indiana Hospital Association Iowa Hospital Association Kansas Hospital Association Kentucky Cabinet for Health and Family Services Louisiana Department of Health and Hospitals Maine Health Data Organization Maryland Health Services Cost Review Commission Massachusetts Center for Health Information and Analysis Michigan Health & Hospital Association Minnesota Hospital Association Mississippi Department of Health Missouri Hospital Industry Data Institute Montana MHA - An Association of Montana Health Care Providers Nebraska Hospital Association Nevada Department of Health and Human Services New Hampshire Department of Health & Human Services New Jersey Department of Health New Mexico Department of Health New York State Department of Health North Carolina Department of Health and Human Services Ohio Hospital Association Oklahoma State Department of Health Oregon Association of Hospitals and Health Systems Oregon Health Policy and Research Pennsylvania Health Care Cost Containment Council Rhode Island Department of Health South Carolina Budget & Control Board South Dakota Association of Healthcare Organizations Tennessee Hospital Association Texas Department of State Health Services Utah Department of Health Vermont Association of Hospitals and Health Systems Virginia Health Information Washington State Department of Health West Virginia Health Care Authority Wisconsin Department of Health Services Wyoming Hospital Association About the NIS The HCUP Nationwide Inpatient Sample (NIS) is a nationwide database of hospital inpatient stays. The NIS is nationally representative of all community hospitals (i.e., short-term, non-Federal, nonrehabilitation hospitals). The NIS is a sample of hospitals and includes all patients from each hospital, regardless of payer. It is drawn from a sampling frame that contains hospitals comprising more than 95 percent of all discharges in the United States. The vast size of the NIS allows the study of topics at both the national and regional levels for specific subgroups of patients. In addition, NIS data are standardized across years to facilitate ease of use. About HCUPnet HCUPnet is an online query system that offers instant access to the largest set of all-payer healthcare databases publicly available. HCUPnet has an easy step-by-step query system, allowing for tables and graphs to be generated on national and regional statistics, as well as trends for community hospitals in the United States. HCUPnet generates statistics using data from HCUP's Nationwide Inpatient Sample (NIS), the Kids' Inpatient Database (KID), the Nationwide Emergency Department Sample (NEDS), the State Inpatient Databases (SID), and the State Emergency Department Databases (SEDD). For More Information For more information about HCUP, visit http://www.hcup-us.ahrq.gov/. For additional HCUP statistics, visit HCUPnet, our interactive query system, at https://datatools.ahrq.gov/hcupnet. For information on other hospitalizations in the United States, download HCUP Facts and Figures: Statistics on Hospital-Based Care in the United States in 2009, located at http://www.hcup-us.ahrq.gov/reports.jsp. For a detailed description of HCUP, more information on the design of the Nationwide Inpatient Sample (NIS), and methods to calculate estimates, please refer to the following publications: Introduction to the HCUP Nationwide Inpatient Sample, 2009. Online. May 2011. U.S. Agency for Healthcare Research and Quality. Available at http://hcup-us.ahrq.gov/db/nation/nis/NIS_2009_INTRODUCTION.pdf. (Accessed January 29, 2013). Houchens RL, Elixhauser A. Using the HCUP Nationwide Inpatient Sample to Estimate Trends. (Updated for 1988-2004). HCUP Methods Series Report #2006-05. Online. August 18, 2006. U.S. Agency for Healthcare Research and Quality. Available at http://www.hcup-us.ahrq.gov/reports/methods/2006_05_NISTrendsReport_1988-2004.pdf. (Accessed January 29, 2013). Coffey R, Barrett, M, Houchens R, Moy E, Andrews R, Coenen N. Methods Applying AHRQ Quality Indicators to Healthcare Cost and Utilization Project (HCUP) Data for the Eleventh (2013) National Healthcare Quality Report (NHQR) and National Healthcare Disparities Report (NHDR). HCUP Methods Series Report #2012-03. U.S. Agency for Healthcare Research and Quality. Available: http://www.hcup-us.ahrq.gov/reports/methods/methods.jsp. (Accessed March 7, 2013). Suggested Citation Torio CM (AHRQ), Elixhauser A (AHRQ), Andrews RM (AHRQ). Trends in Potentially Preventable Admissions among Adult and Children, 2005-2010. HCUP Statistical Brief #151. March 2013. Agency for Healthcare Research and Quality, Rockville, MD.. Agency for Healthcare Research and Quality, Rockville, MD. Available at http://www.hcup-us.ahrq.gov/reports/statbriefs/sb151.pdf. *** AHRQ welcomes questions and comments from readers of this publication who are interested in obtaining more information about access, cost, use, financing, and quality of healthcare in the United States. We also invite you to tell us how you are using this Statistical Brief and other HCUP data and tools, and to share suggestions on how HCUP products might be enhanced to further meet your needs. Please e-mail us at hcup@ahrq.gov or send a letter to the address below:Irene Fraser, Ph.D., Director Center for Delivery, Organization, and Markets Agency for Healthcare Research and Quality 540 Gaither Road Rockville, MD 20850 1 Russo CA, Jiang HJ, Barrett M. Trends in Potentially Preventable Hospitalizations among Adults and Children, 1997-2004. HCUP Statistical Brief #36. August 2007. Agency for Healthcare Research and Quality, Rockville, MD. http://www.hcup-us.ahrq.gov/reports/statbriefs/sb36.pdf. (Accessed March 12, 2013). 2 HCUP Cost-to-Charge Ratio Files (CCR). Healthcare Cost and Utilization Project (HCUP). 2001-2009. U.S. Agency for Healthcare Research and Quality, Rockville, MD. Available at http://www.hcup-us.ahrq.gov/db/state/costtocharge.jsp. Updated August 2011. (Accessed March 6, 2013). 3 Coffey R, Barrett, M, Houchens R, Moy E, Andrews R, Coenen N. Methods Applying AHRQ Quality Indicators to Healthcare Cost and Utilization Project (HCUP) Data for the Eleventh (2013) National Healthcare Quality Report (NHQR) and National Healthcare Disparities Report (NHDR). HCUP Methods Series Report #2012-03. U.S. Agency for Healthcare Research and Quality. Available: http://www.hcup-us.ahrq.gov/reports/methods/methods.jsp. (Accessed March 12, 2013). |
| Internet Citation: Statistical Brief #151. Healthcare Cost and Utilization Project (HCUP). March 2013. Agency for Healthcare Research and Quality, Rockville, MD. hcup-us.ahrq.gov/reports/statbriefs/sb151.jsp. |
| Are you having problems viewing or printing pages on this website? |
| If you have comments, suggestions, and/or questions, please contact hcup@ahrq.gov. |
| If you are experiencing issues related to Section 508 accessibility of information on this website, please contact hcup@ahrq.gov. |
| Privacy Notice, Viewers & Players |
| Last modified 3/15/13 |