STATISTICAL BRIEF #119
|
|
August 2011
Ryan Mutter, Ph.D., Pamela Owens, Ph.D.
Introduction Air and paintball guns use compressed air to fire a projectile. Propulsion is provided through one of three ways: a spring that is cocked, carbon dioxide from a gas cartridge, or a pump-action mechanism. The velocities of the projectiles fired from these types of guns can overlap those attained by small-caliber bullets fired from conventional firearm pistols, and the types of injuries caused by the two types of guns can be similar.1 Air guns fire a metal object—either a ball bearing (BB) or a pellet. Paintball guns shoot a gelatin projectile containing non-toxic paint.2 There is variation in the ease with which these types of guns can be attained. Some states have laws regulating their use and availability.3 In other locations, they can be bought in toy stores.2 Air and paintball guns are popular. More than 3.2 million air guns are purchased in the United States annually,1 and over 10 million Americans participate in paintball activities each year.4 However, serious injury or death can result from the use of these guns.2 This Statistical Brief presents data from the Healthcare Cost and Utilization Project (HCUP) on emergency department (ED) visits for injuries caused by air and paintball guns in 2008. Characteristics of ED visits for injuries caused by each of these types of guns are compared. Age, patient location, primary expected payer, and most common all-listed diagnoses are examined. All differences between estimates noted in the text are statistically significant at the 0.05 level or better. Findings In 2008, there were over 20,300 emergency department (ED) visits for injuries caused by air and paintball guns (table 1). The majority of these visits were related to injuries caused by air guns (97.0 percent)——the remaining 3.0 percent were related to paintball guns. |
|
| Table 1. Characteristics of ED visits for air and paintball gun injuries, 2008 | |||
| ED visits for air and paintball gun injuries | ED visits for air gun injuries | ED visits for paintball gun injuries | |
|---|---|---|---|
| Number of visits | 20,338 | 19,724 | 614 |
| ED visits per day | 56 | 54 | 2 |
| Rate per 1,000,000 population | 67 | 65 | 2 |
| Males, rate per 1,000,000 population | 115 | 111 | 3 |
| Females, rate per 1,000,000 population | 21 | 20 | 1 |
| Utilization characteristics | |||
| Percentage treated and released | 96.5% | 96.7% | 88.0% |
| Percentage admitted to the hospital | 3.5% | 3.3% | 12.0% |
| Patient characteristics | |||
| Mean age, years | 19.3 | 19.1 | 25.7 |
| Age group, rate per 1,000,000 population: | |||
| Under 9 years | 57 | 56 | 1 |
| 10 to 14 years | 289 | 283 | 5 |
| 15 to 17 years | 274 | 268 | 7 |
| 18 to 24 years | 142 | 137 | 5 |
| 25 to 29 years | 55 | 54 | 2 |
| 30 to 39 years | 35 | 33 | 2 |
| 40 years and older | 13 | 12 | 1 |
| Patient residence, rate per 1,000,000 population1 | |||
| Urban areas (large central, large fringe, and small and medium metropolitan) | 61 | 59 | 2 |
| Rural areas (micropolitan and noncore) | 92 | 94 | 2 |
| Patient ZIP income quartile, rate per 1,000,000 population2 | |||
| Quartile 1 (0-25th percentile) | 93 | 90 | 3 |
| Quartile 2 (26th to 50th percentile) | 78 | 76 | 2 |
| Quartile 3 (51st to 75th percentile) | 57 | 55 | 2 |
| Quartile 4 (76th to 100th percentile) | 34 | 33 | 1 |
| Hospital region, rate per 1,000,000 population | |||
| Northeast | 55 | 52 | 2 |
| Midwest | 68 | 66 | 2 |
| South | 78 | 76 | 2 |
| West | 58 | 56 | 2 |
| 1 Missing patient's residence on 99 (< 1%) records 2 Missing patient's income quartile on 386 (< 2% of records) Source: AHRQ, Center for Delivery, Organization, and Markets, Healthcare Cost and Utilization Project, Nationwide Emergency Department Sample, 2008. Denominator data for rates were based on Annual Estimates of Resident Population for the United States, Regions, States and Puerto Rico: April 1, 2000 to July 1, 2009 (NST_EST2009-01, NC-EST2009-02). U.S. Census Bureau, Population Division. | |||
On average, every day there are 56 ED visits related to air and paintball gun injuries. Overall, about 3.5 percent of these ED visits result in hospitalization, although the admission rate was substantially higher for the subset of ED visits for injuries resulting from paintball guns (12.0 percent).
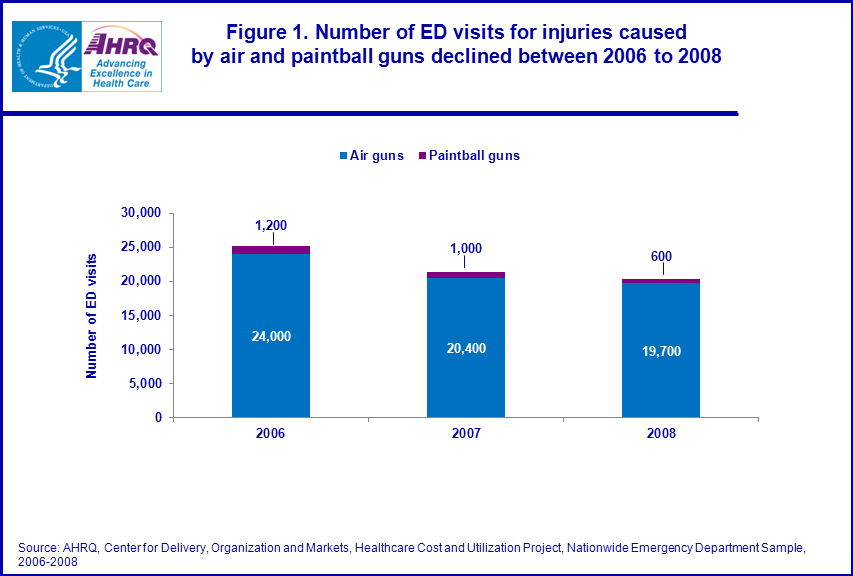
Overall, the number of ED visits for injuries caused by air and paintball guns declined 20 percent between 2006 and 2008 (figure 1) from 25,200 in 2006 to 20,300 in 2008. Paintball injuries declined more than air gun injuries (48 percent versus 18 percent). |
|
Figure 1. Number of ED visits for injuries caused by air and paintball guns declined between 2006 and 2008. Bar chart; Newborns and infants under 1 year, 4,600,700 (72%), 1 to 4 years, 564,800 (9%), 5 to 9 years, 358,200 (5%), 10 to 14 years, 372,400 (6%), 15 to 17 years, 497,600 (8%). Source: AHRQ, Center for Delivery, Organization and Markets, Healthcare Cost and Utilization Project, Nationwide Emergency Department Sample, 2006-2008.
|
Sex and age characteristics
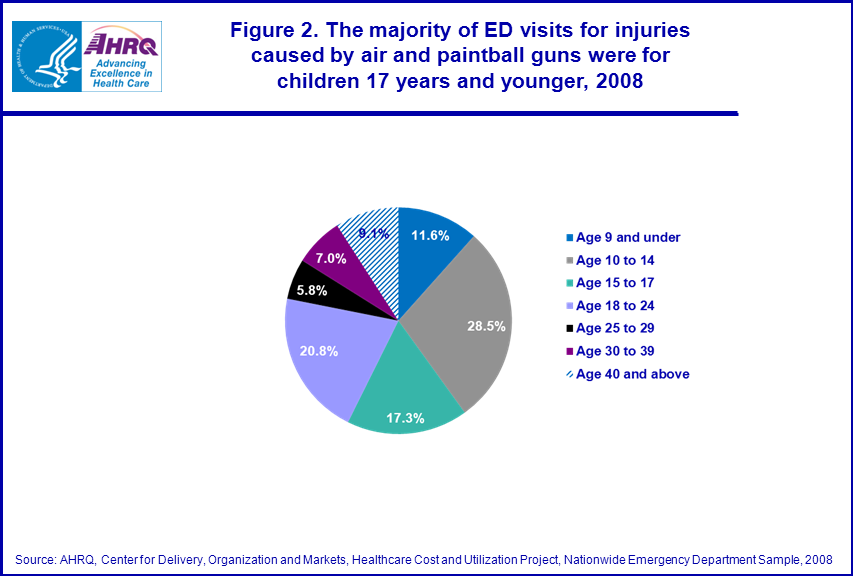
As shown in table 1, males were 5 times more likely than females to be seen in the ED for air and paintball gun injuries (115 versus 21 per 1 million population, respectively). Overall, the average age of patients seen in the ED for all air and paintball gun injuries was 19.3 years, although the average age was slightly older for ED visits related to paintball guns (25.7 years). Figure 2 shows that the majority of ED visits for air and paintball gun injuries was for children age 17 years and younger (57.4 percent)—more than 1 in 4 ED visits for air and paintball gun injuries were for children ages 10 to 14 years (28.5 percent). Over 1 in 9 ED visits for air and paintball gun injuries were for children younger than 10 years of age (11.6 percent). |
|
Figure 2. The majority of ED visits for injuries caused by air and paintball guns were for children 17 years and younger, 2008. Pie chart; 11.6% at age 9 and under; 28.5% at ages 10 to 14; 17.3% at ages 15 to 17; 20.8% at ages 18 to 24; 5.8% at ages 25 to 29; 7.0% at ages 30 to 39; 9.1% at age 40 and above. Source: AHRQ, Center for Delivery, Organization and Markets, Healthcare Cost and Utilization Project, Nationwide Emergency Department Sample, 2008.
|
Age-specific rates of ED visits for air and paintball gun injuries were highest for 10 to 14 and 15 to 17 year olds (289 and 274 per 1 million population, respectively). ED visits for air and paintball gun injuries were less common among the youngest age group (9 years and younger) and older age groups (25 and older), with fewer than 60 visits per 1 million population.
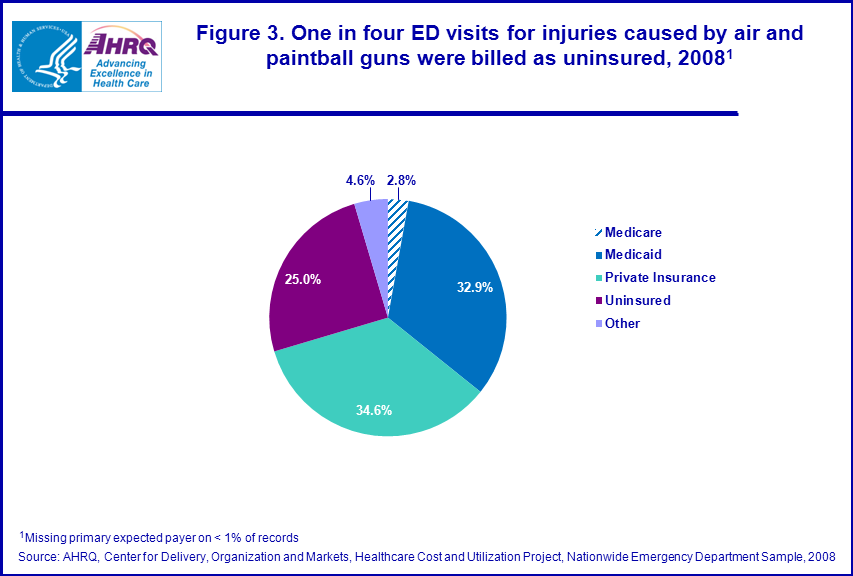
Region and patient location characteristics Table 1 shows that the rate of ED visits for injuries caused by air and paintball guns was higher in rural than in urban areas (92 versus 61 per 1 million population). The location-specific ED visit rates for air gun injuries were consistent with the overall rates, but the ED visit rate for paintball injuries was similar for rural and urban areas (2 per 1 million population). ED visit rates varied by community income level for injuries caused by air and paintball guns and specifically for air guns. ED visit rates were highest for individuals from the lowest income communities (93 per 1 million population) and lowest for individuals from the highest income communities (34 per 1 million population). The overall ED visit rate for air and paintball gun injuries and for air guns injuries specifically was highest in the South and lowest in the Northeast (78 and 55 per 1 million population, respectively). There was no substantial difference in ED visit rates for injuries caused by paintball guns across the regions (2 per 1 million population). Expected primary payer Figure 3 shows that over one-third of ED visits for injuries caused by air and paintball guns were billed to private insurance (34.6 percent) and an additional one-third was billed to Medicaid (32.9 percent). One in four ED visits for injuries caused by air and paintball guns were billed as uninsured (25.0 percent). |
|
Figure 3. One in four ED visits for injuries caused by air and paintball guns were billed as uninsured, 2008. Pie chart; 2.8%, Medicare; 32.9%, Medicaid; 34.6%, private insurance; 25.0%, uninsured; 4.6%, Other. Source: AHRQ, Center for Delivery, Organization and Markets, Healthcare Cost and Utilization Project, Nationwide Emergency Department Sample, 2008.
|
Specific diagnoses for ED visits for injuries caused by air and paintball guns
Table 2 shows that the most common all-listed diagnoses for ED visits related to air and paintball guns was open wounds to extremities (37.3 percent), followed by superficial injuries (36.0 percent), and open wounds to the head, neck and truck (23.4 percent). Common diagnoses were consistent across the types of guns, with several exceptions. Air guns were more often implicated in open wounds of head, neck and trunk (seen in 23.8 percent of air gun injuries compared to 10.1 percent of paintball injuries) and open wounds of extremities (seen in 38.1 percent of air gun and 12.4 percent of paintball injuries). In contrast, eye injuries were less common among air gun injuries (3.7 percent) than paintball gun injuries (15.0 percent). |
| Table 2. Top 5 all-listed diagnoses associated with ED visits for air and paintball gun injuries, by type of gun, 2008 | |||||||||
| All-listed diagnoses (CCS code)** | ED visits for air and paintball gun injuries | ED visits for air/BB gun injuries | ED visits for paintball gun injuries | ||||||
|---|---|---|---|---|---|---|---|---|---|
| Rank | N | Percentage | Rank | N | Percentage | Rank | N | Percentage | |
| Open wounds of extremities (236) | 1 | 7,592 | 37.3% | 1 | 7,516 | 38.1% | 4 | 76 | 12.4% |
| Superficial injury, contusion (239) | 2 | 7,315 | 36.0% | 2 | 6,927 | 35.1% | 1 | 388 | 63.2% |
| Open wounds of head, neck and trunk (235) | 3 | 4,751 | 23.4% | 3 | 4,689 | 23.8% | 5 | 62 | 10.1% |
| Other injuries and conditions due to external causes (244) | 4 | 1,219 | 6.0% | 4 | 1,121 | 5.7% | 2 | 98 | 16.0% |
| Immunizations and screening for infections (10) | 5 | 988 | 4.9% | 5 | 960 | 4.9% | 27 | 4.5% | |
| Other eye disorders (91) | 820 | 4.0% | 728 | 3.7% | 3 | 92 | 15.0% | ||
| Source: Agency for Healthcare Research and Quality, Center for Delivery, Organization and Markets, Healthcare Cost and Utilization Project, Nationwide Emergency Department Sample, 2008 **Excludes history of tobacco use | |||||||||
|
Data Source
The estimates in this Statistical Brief are based upon data from the HCUP 2008 Nationwide Emergency Department Sample (NEDS). Supplemental source included data on regional population estimates from "Table 1: Annual Estimates of the Resident Population for the United States, Regions, States, and Puerto Rico: April 1, 2000 to July 1, 2009 (NST-EST2009-01)", Population Division, U.S. Census Bureau, Release date: December 2009 (https://www.census.gov/programs-surveys/popest/data/tables.html) and information in the methods report entitled "Population Denominator Data for Use with the HCUP Databases (Updated with 2009 Population Data", HCUP Methods Series Report #2010-02. Online April 12, 2010. US Agency for Healthcare Research and Quality (https://www.hcup-us.ahrq.gov/reports/methods/methods.jsp). Definitions Diagnoses, ICD-9-CM, and Clinical Classifications Software (CCS) The first-listed or principal diagnosis is the diagnosis that appears first on the record. For ED visits that result in hospital admission, this is the principal diagnosis. The principal diagnosis is that condition established after study to be chiefly responsible for occasioning the admission of the patient to the hospital for care. The principal diagnosis is always the reason for admission. For treat-and-release ED visits, it may not be the principal diagnosis but may simply be the diagnosis that appears first on the record. Secondary diagnoses are concomitant conditions that coexist at the time of admission or that develop during the stay. All-listed diagnoses include the first-listed or principal diagnosis plus additional conditions that coexist at the time of the ED visit, or that develop during the stay following the ED visit, and which have an effect on the treatment or length of stay in the ED or hospital. ICD-9-CM is the International Classification of Diseases, Ninth Revision, Clinical Modification, which assigns numeric codes to diagnoses. There are about 13,600 ICD-9-CM diagnosis codes. CCS categorizes ICD-9-CM diagnoses into a manageable number of clinically meaningful categories.5 This "clinical grouper" makes it easier to quickly understand patterns of diagnoses and procedures. Case Definition The ICD-9-CM external cause of injury codes (E-codes) defining air and paintball gun injuries include diagnosis codes:
E922.5: Accident caused by firearm and air gun missile—paintball gun E955.6: Suicide and self-inflicted injury by air gun E955.7: Suicide and self-inflicted injury by paintball gun E968.6: Assault by air gun E985.6: Injury by air gun, undetermined whether accident or on purpose E985.7: Injury by paintball gun, undetermined whether accident or on purpose Types of hospitals included in HCUP HCUP is based on data from community hospitals, defined as short-term, non-Federal, general and other hospitals, excluding hospital units of other institutions (e.g., prisons). HCUP data include OB-GYN, ENT, orthopedic, cancer, pediatric, public, and academic medical hospitals. Excluded are long-term care, rehabilitation, psychiatric, and alcoholism and chemical dependency hospitals. Please note, a discharge of this nature will be included in the NIS if it occurred in a community hospital. Unit of analysis The unit of analysis for HCUP data is the hospital encounter (i.e., the ED visit or the ED visit in addition to the hospital stay), not a person or patient. This means that a person who is seen in the ED multiple times in one year will be counted each time as a separate "ED visit". Urban-rural location Urban-rural location is one of six categories as defined by the National Center for Health Statistics:
For the purposes of this Statistical Brief, large central, large fringe, medium metropolitan and small metropolitan were collapsed to urban, and micropolitan and non-core were collapsed to rural. The cut-off for each location is determined using demographic data obtained from Claritas, Inc. (San Diego, CA). Median community-level income Median community-level income is the median household income of the patient's ZIP Code of residence. The cut-offs for the quartile designation are determined using ZIP Code demographic data obtained from Claritas. The income quartile is missing for homeless and foreign patients. For 2008, the income quartiles are as follows:
Payer Payer is the expected primary payer for the hospital stay. To make coding uniform across all HCUP data sources, payer combines detailed categories into more general groups:
When more than one payer is listed for a ED record, the first-listed payer is used. Region Region is one of the four regions defined by the U.S. Census Bureau:
About HCUP HCUP is a family of powerful healthcare databases, software tools, and products for advancing research. Sponsored by the Agency for Healthcare Research and Quality (AHRQ), HCUP includes the largest all-payer encounter-level collection of longitudinal healthcare data (inpatient, ambulatory surgery, and emergency department) in the United States, beginning in 1988. HCUP is a Federal-State-Industry Partnership that brings together the data collection efforts of many organizations—such as State data organizations, hospital associations, private data organizations, and the Federal government—to create a national information resource. HCUP would not be possible without the contributions of the following data collection Partners from across the United States: Arizona Department of Health Services Arkansas Department of Health California Office of Statewide Health Planning and Development Colorado Hospital Association Connecticut Hospital Association Florida Agency for Health Care Administration Georgia Hospital Association Hawaii Health Information Corporation Illinois Department of Public Health Indiana Hospital Association Iowa Hospital Association Kansas Hospital Association Kentucky Cabinet for Health and Family Services Louisiana Department of Health and Hospitals Maine Health Data Organization Maryland Health Services Cost Review Commission Massachusetts Division of Health Care Finance and Policy Michigan Health & Hospital Association Minnesota Hospital Association Missouri Hospital Industry Data Institute Montana MHA — An Association of Montana Health Care Providers Nebraska Hospital Association Nevada Department of Health and Human Services New Hampshire Department of Health & Human Services New Jersey Department of Health and Senior Services New Mexico Health Policy Commission New York State Department of Health North Carolina Department of Health and Human Services Ohio Hospital Association Oklahoma State Department of Health Oregon Association of Hospitals and Health Systems Pennsylvania Health Care Cost Containment Council Rhode Island Department of Health South Carolina State Budget & Control Board South Dakota Association of Healthcare Organizations Tennessee Hospital Association Texas Department of State Health Services Utah Department of Health Vermont Association of Hospitals and Health Systems Virginia Health Information Washington State Department of Health West Virginia Health Care Authority Wisconsin Department of Health Services Wyoming Hospital Association About the NEDS The HCUP Nationwide Emergency Department Database (NEDS) is a unique and powerful database that yields national estimates of emergency department (ED) visits. The NEDS was constructed using records from both the HCUP State Emergency Department Databases (SEDD) and the State Inpatient Databases (SID). The SEDD capture information on ED visits that do not result in an admission (i.e., treat-and-release visits and transfers to another hospital); the SID contain information on patients initially seen in the emergency room and then admitted to the same hospital. The NEDS was created to enable analyses of ED utilization patterns and support public health professionals, administrators, policymakers, and clinicians in their decision-making regarding this critical source of care. The NEDS is produced annually beginning in 2006. About HCUPnet HCUPnet is an online query system that offers instant access to the largest set of all-payer healthcare databases publicly available. HCUPnet has an easy step-by-step query system, allowing for tables and graphs to be generated on national and regional statistics, as well as trends for community hospitals in the U.S. HCUPnet generates statistics using data from HCUP's Nationwide Inpatient Sample (NIS), the Kids' Inpatient Database (KID), the Nationwide Emergency Department Sample (NEDS), the State Inpatient Databases (SID), and the State Emergency Department Databases (SEDD). For More Information For more information about HCUP, visit http://www.hcup-us.ahrq.gov. For additional HCUP statistics, visit HCUPnet, our interactive query system, at www.hcup.ahrq.gov. For a detailed description of HCUP, more information on the design of the NEDS, and methods to calculate estimates, please refer to the following publications: Introduction to the HCUP Nationwide Emergency Department Sample, 2008. Online. October 2010. U.S. Agency for Healthcare Research and Quality. http://hcup-us.ahrq.gov/db/nation/neds/NEDS2008Introductionv3.pdf Houchens, R., Elixhauser, A. Final Report on Calculating Nationwide Inpatient Sample (NIS) Variances, 2001. HCUP Methods Series Report #2003-2. Online. June 2005 (revised June 6, 2005). U.S. Agency for Healthcare Research and Quality. http://www.hcup-us.ahrq.gov/reports/methods/2003_02.pdf Suggested Citation Mutter, R. (AHRQ), and Owens, P.L. (AHRQ). Emergency Department Visits for Injuries Caused by Air and Paintball Guns, 2008. HCUP Statistical Brief #119. August 2011. Agency for Healthcare Research and Quality, Rockville, MD. http://www.hcup-us.ahrq.gov/reports/statbriefs/sb119.pdf *** AHRQ welcomes questions and comments from readers of this publication who are interested in obtaining more information about access, cost, use, financing, and quality of healthcare in the United States. We also invite you to tell us how you are using this Statistical Brief and other HCUP data and tools, and to share suggestions on how HCUP products might be enhanced to further meet your needs. Please e-mail us at hcup@ahrq.gov or send a letter to the address below:Irene Fraser, Ph.D., Director Center for Delivery, Organization, and Markets Agency for Healthcare Research and Quality 540 Gaither Road Rockville, MD 20850 1 Nguyen, M., Annest, J., Mercy, J., Ryan, G., and Fingerhut, L. Trends in BB/pellet gun injuries in children and teenagers in the United States, 1985 – 99. Injury Prevention. 2002: 8: 185 – 191. 2 Laraque, D. and the Committee on Injury, Violence, and Poison Prevention. Injury Risk of Nonpowder Guns. Pediatrics. 2004: 114(5): 1357 – 1361. 3 Legal Community Against Violence. Non-powder Guns. 2008: http://smartgunlaws.org/non-powder-guns-policy-summary/. 4 Alliman, K., Smiddy, W., Banta, J., Qureshi, Y., Miller, D., and Schiffman, J. 2009. Ocular Trauma and Visual Outcome Secondary to Paintball Projectiles. American Journal of Opthalmology. 2009: 147(2): 239 – 242. 5 HCUP CCS. Healthcare Cost and Utilization Project (HCUP). December 2009. U.S. Agency for Healthcare Research and Quality, Rockville, MD. www.hcup-us.ahrq.gov/toolssoftware/ccs/ccs.jsp |