STATISTICAL BRIEF #115
|
|
June 2011
Lauren M. Wier, M.P.H., Marguerite Barrett, M.S., Claudia Steiner, M.D., M.P.H., and H. Joanna Jiang, Ph.D.
Introduction Hospital readmissions have been identified as an important outcome measure for assessing performance of the healthcare system.1,2 Reducing readmission rates and variation in those rates can be an effective strategy for improving the quality of healthcare while lowering the cost. Developing national or multi-state benchmarks for hospital readmissions by payer category and patient characteristics can help identify subpopulations with relatively high readmission rates for targeted improvement efforts. AHRQ added supplemental data elements to selected3 Healthcare Cost and Utilization Project (HCUP) State-level databases to facilitate research focusing on repeat hospital visits. These data elements allow analysts to track a patient across time and hospital setting while adhering to strict privacy protections.4 Hospital visits that belong to a unique person may be linked and the elapsed time between visits can be calculated. This Statistical Brief presents data from HCUP on all-cause readmissions by expected payer and age groups in 15 selected states in 2008. The 15 states are dispersed geographically and account for 42 percent of the total U.S. resident population. For this Statistical Brief, readmission rate is defined as the number of times patients had a readmission within a certain number of days after being discharged alive from an initial hospital stay divided by the total number of initial stays between January and November 2008. Each hospital stay can be a new initial stay. Thus, a patient is allowed to have more than one initial stay and also multiple readmissions within a time period. Readmission rates 7, 14, and 30 days post-discharge are presented by expected primary payer and age group.5 All differences between estimates noted in the text are statistically significant at the 0.05 level or better. |
|
Findings
Among the 15 selected states there were a combined 11.8 million inpatient hospital stays in 2008, representing information on 8.5 million patients. Across all payers and age groups, readmission rates increased with the number of days post-discharge, such that the 30-day readmission rate was higher than the 14-day rate, which was then higher than the 7-day rate (table 1). |
| Table 1. Readmission rates by 7, 14, and 30 days post-discharge of an initial hospital stay, by expected payer and age group, 2008 | |||||
| Expected payer and age group | Number of discharges | Number of patients | Readmission rate | ||
|---|---|---|---|---|---|
| 7 day | 14 day | 30 day | |||
| Medicare | |||||
| Adults, age 65+ | 4,426,500 | 2,884,700 | 6.5% | 11.1% | 19.0% |
| Adults, age 18–64 | 959,900 | 539,600 | 8.0% | 13.9% | 24.1% |
| Medicaid | |||||
| Maternal, regardless of age | 732,400 | 655,200 | 2.2% | 3.5% | 5.5% |
| Non-maternal pediatric, age 1–17 | 224,800 | 174,600 | 4.1% | 7.0% | 12.1% |
| Non-maternal adults, age 18–44 | 469,800 | 299,800 | 7.6% | 12.5% | 20.8% |
| Non-maternal adults, age 45–64 | 565,100 | 326,500 | 8.1% | 14.2% | 24.4% |
| Private insurance | |||||
| Maternal, regardless of age | 851,400 | 794,700 | 1.6% | 2.4% | 3.6% |
| Non-maternal pediatric, age 1–17 | 167,000 | 137,400 | 4.1% | 6.9% | 11.3% |
| Non-maternal adults, age 18–44 | 808,300 | 661,100 | 3.8% | 6.2% | 10.1% |
| Non-maternal adults, age 45–64 | 1,587,500 | 1,236,800 | 4.2% | 7.1% | 11.9% |
| Uninsured | |||||
| Maternal, regardless of age | 39,600 | 34,500 | 2.3% | 3.6% | 5.7% |
| Non-maternal pediatric, age 1–17 | 15,000 | 13,200 | 2.9% | 4.4% | 7.0% |
| Non-maternal adults, age 18–44 | 273,600 | 216,700 | 4.4% | 7.0% | 11.2% |
| Non-maternal adults, age 45–64 | 254,500 | 188,200 | 5.1% | 8.7% | 14.4% |
| All other payers | |||||
| All ages | 391,200 | 307,600 | 4.3% | 7.1% | 11.7% |
| Source: Agency for Healthcare Research and Quality, Center for Delivery, Organization, and Markets, Healthcare Cost and Utilization Project, State Inpatient Databases, 2008, from the following 15 states: AR, CA, FL, HI, LA, MA, MO, NE, NH, NY, SC, TN, UT, VA, WA | |||||
Medicare readmissions, by age
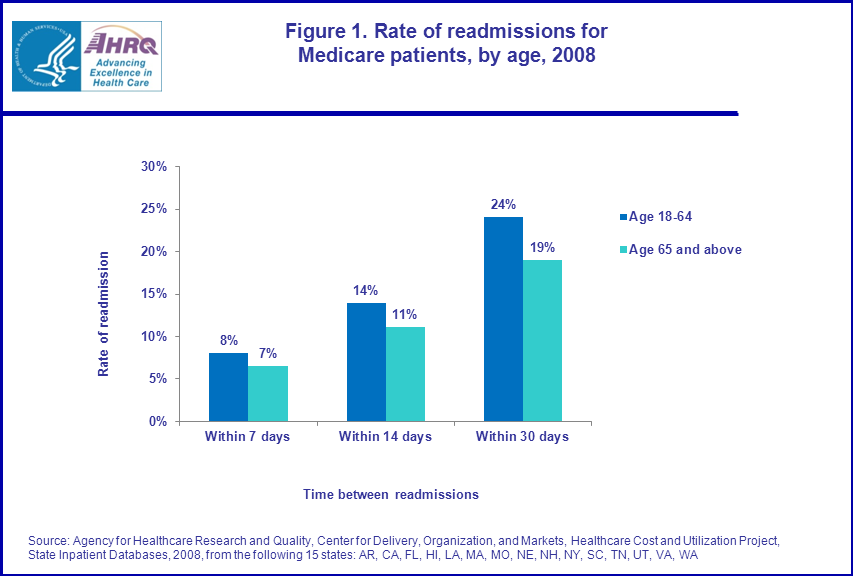
Although non-elderly patients (18 to 64 years) comprised a relatively small proportion of stays billed to Medicare (17.8 percent), their readmission rates were higher than those for elderly patients (65 years and older).6 For example, 30-day readmission rates were about 25 percent higher among non-elderly than among elderly Medicare patients (24.1 versus 19.0 percent; figure 1). In contrast, readmission rates for non-maternal stays increased with age for Medicaid, privately insured, and uninsured patients. |
|
Figure 1. Rate of readmissions for Medicare patients, by age, 2008. Bar chart; rate of admission; within 7 days, age 18-64, 8 percent, age 65 and above, 7 percent. Bar chart; rate of admission; within 14 days, age 18-64, 14 percent, age 65 and above, 11 percent. Bar chart; rate of admission; within 30 days, age 18-64, 24 percent, age 65 and above, 19 percent. Source: Agency for Healthcare Research and Quality, Center for Delivery, Organization, and Markets, Healthcare Cost and Utilization Project, State Inpatient Databases, 2008, from the following 15 states: AR, CA, FL, HI, LA, MA, MO, NE, NH, NY, SC, TN, UT, VA, WA. |
Non-maternal adult readmissions, by payer
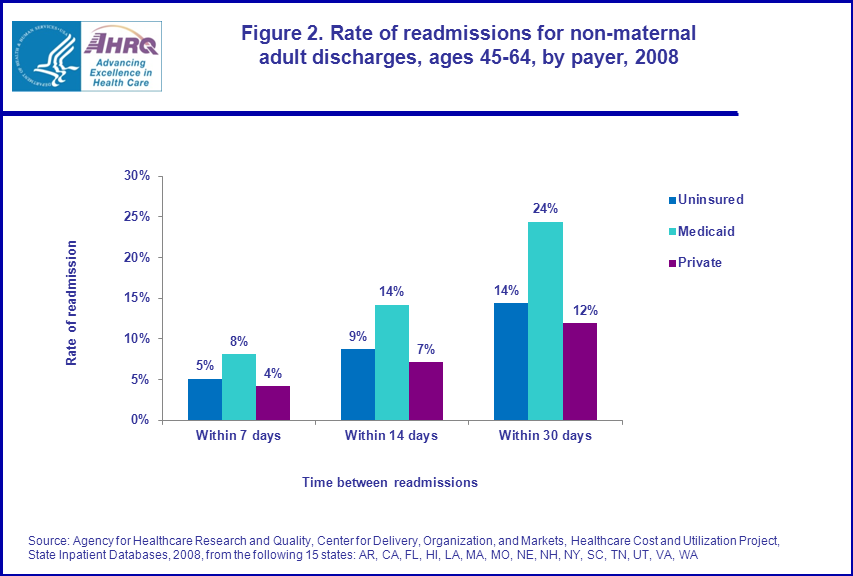
Among adults ages 45–64 years old, Medicaid patients were re-hospitalized about 60 percent more often than uninsured patients and about twice as frequently as privately insured patients, regardless of the readmission period (figure 2). For instance, the non-maternal 30-day readmission rate was 24.4 percent for Medicaid patients compared with 14.4 percent for the uninsured and 11.9 percent for the privately insured. |
|
Figure 2. Rate of readmissions for non-maternal adult discharges, ages 45-64, by payer, 2008. Bar chart; rate of readmission; within 7 days, uninsured, 5 percent, Medicaid, 8 percent, private, 4 percent. Bar chart; rate of readmission; within 14 days, uninsured, 9 percent, Medicaid, 14 percent, private, 7 percent. Bar chart; rate of readmission; within 30 days, uninsured, 14 percent, Medicaid, 24 percent, private, 12 percent. Source: Agency for Healthcare Research and Quality, Center for Delivery, Organization, and Markets, Healthcare Cost and Utilization Project, State Inpatient Databases, 2008, from the following 15 states: AR, CA, FL, HI, LA, MA, MO, NE, NH, NY, SC, TN, UT, VA, WA.
|
Non-maternal pediatric readmissions, by payer
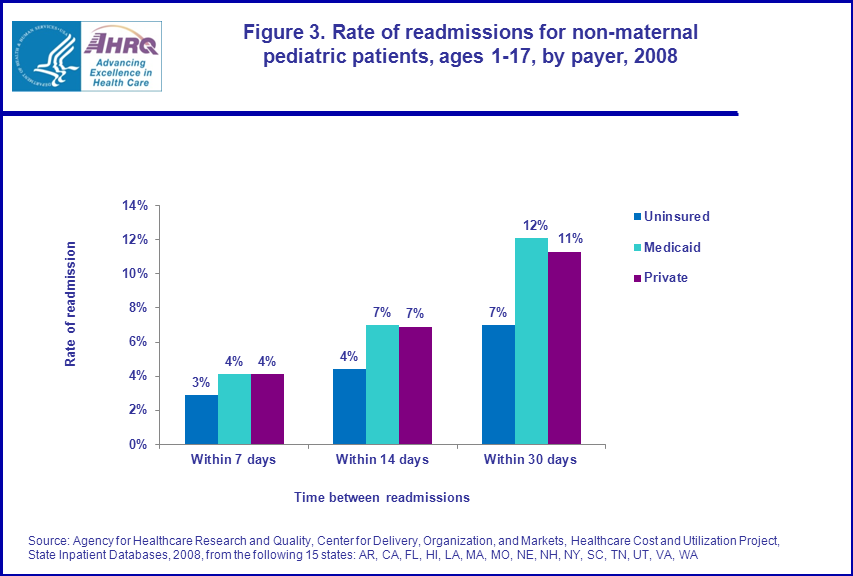
The majority of pediatric patients were insured by either Medicaid (54 percent) or private insurance (42 percent) in 2008; only 4 percent were uninsured (table 1). Medicaid and privately insured pediatric patients were re-hospitalized within 7 and 14 days at a similar rate and more frequently than uninsured patients irrespective of the readmission period. As shown in figure 3, the non-maternal 30-day readmission rate was 12.1 percent for Medicaid patients and 11.3 percent for privately insured patients compared with 7.0 percent for uninsured. |
|
Figure 3. Rate of readmissions for non-maternal pediatric patients, ages 1-17, by payer, 2008. Bar chart; rate of readmission; within 7 days, uninsured, 3 percent, Medicaid, 4 percent, private, 4 percent. Bar chart; rate of readmission; within 14 days, uninsured, 4 percent, Medicaid, 7 percent, private, 7 percent. Bar chart; rate of readmission; within 30 days, uninsured, 7 percent, Medicaid, 12 percent, private, 11 percent. Source: Agency for Healthcare Research and Quality, Center for Delivery, Organization, and Markets, Healthcare Cost and Utilization Project, State Inpatient Databases, 2008, from the following 15 states: AR, CA, FL, HI, LA, MA, MO, NE, NH, NY, SC, TN, UT, VA, WA.
|
Maternal readmissions, by payer
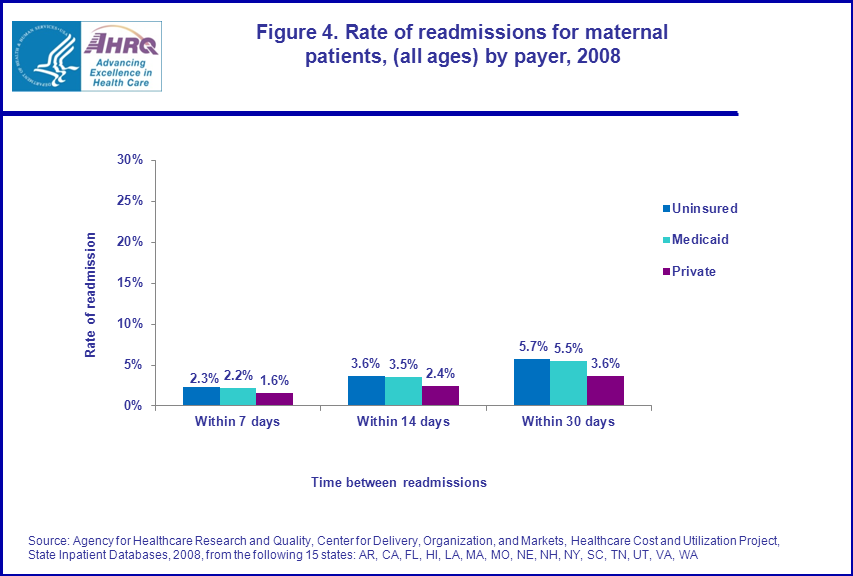
Nearly half (45.0 percent) of Medicaid patients were classified as maternal (i.e., had at least one inpatient stay related to pregnancy, childbirth, and post-partum conditions in the year). Obstetric patients accounted for 28.1 percent of privately insured and 7.6 percent of uninsured patients. Across all payers, readmissions for maternal discharges were less frequent than for non-maternal discharges. Maternal readmission rates were about 50 percent higher for uninsured and Medicaid patients than for privately insured patients across all time periods (figure 4). |
|
Figure 4. Rate of readmissions for maternal patients, (all ages) by payer, 2008. Bar chart; rate of readmission; within 7 days, uninsured, 2.3 percent, Medicaid, 2.2 percent, private, 1.6 percent. Bar chart; rate of readmission; within 14 days, uninsured, 3.6 percent, Medicaid, 3.5 percent, private, 2.4 percent. Bar chart; rate of readmission; within 30 days, uninsured, 5.7 percent, Medicaid, 5.5 percent, private, 3.6 percent. Source: Agency for Healthcare Research and Quality, Center for Delivery, Organization, and Markets, Healthcare Cost and Utilization Project, State Inpatient Databases, 2008, from the following 15 states: AR, CA, FL, HI, LA, MA, MO, NE, NH, NY, SC, TN, UT, VA, WA.
|
Data Source
The estimates in this Statistical Brief are based upon data from the HCUP 2008 State Inpatient Databases for 15 States. States were selected based on availability of synthetic patient-level identifiers that enabled tracking of patients across hospitals and time within a State: Arkansas, California, Florida, Hawaii, Louisiana, Massachusetts, Missouri, Nebraska, New Hampshire, New York, South Carolina, Tennessee, Utah, Virginia, and Washington. Definitions Diagnoses, Diagnosis Related Groups (DRGs) and Major Diagnostic Categories (MDCs) DRGs comprise a patient classification system that categorizes patients into groups that are clinically coherent and homogeneous with respect to resource use. DRGs group patients according to diagnosis, type of treatment (procedures), age, and other relevant criteria. MDCs are broad groups of DRGs that relate to an organ or a body system (digestive system, for example) and not to an etiology. For example, MDC 01—Diseases and Disorders of the Nervous System, MDC 02—Diseases and Disorders of the Eye, MDC 03—Diseases and Disorders of the Ear, Nose, Mouth, and Throat. Each hospital stay has one DRG and one MDC assigned to it. For the purpose of this Brief, MDC 14 (Pregnancy, Childbirth, and the Puerperium) was used to identify maternal discharges. Types of hospitals included in HCUP HCUP is based on data from community hospitals, defined as short-term, non-Federal, general and other hospitals, excluding hospital units of other institutions (e.g., prisons). HCUP data include OB-GYN, ENT, orthopedic, cancer, pediatric, public, and academic medical hospitals. Excluded are long-term care, rehabilitation, psychiatric, and alcoholism and chemical dependency hospitals. Unit of analysis The unit of analysis is the individual patient identified by the synthetic patient-level identifier. A patient may be counted multiple times if he or she has multiple admissions to the hospital in the year. Readmission Readmission rate is defined as the number of times patients had a readmission within a certain number of days (e.g., 7, 14, or 30 days) after being discharged alive from an initial hospital stay divided by the total number of initial stays between January and November 2008. Each hospital stay can be a new initial stay. Thus, a patient is allowed to have multiple initial stays, regardless of the time elapsed between admissions. For example, if one admission is January 10 and the next admission is January 20, followed by a third admission on January 27th, and a fourth on March 30th, all four are counted in the denominator of the readmission rates. The January 20th admission is counted in the numerator for 14- and 30-day readmissions relative to the January 10th admission. The January 27th admission is counted in the numerator as a 30-day readmission relative to the January 10th admission. The January 27th admission also counts as a readmission within 7, 14, and 30 days of the January 20th admission. The March 30th stay is not counted as a readmission, as it is outside the 7-, 14- or 30-day window of any previous stay. The final count is 4 initial hospital stays, with one 7-day readmission, two 14-day readmissions and three 30-day readmissions. Excluded from the analysis are discharges with missing age, expected payer, length of stay, or principal diagnosis, in addition to discharges without a valid Diagnosis Related Group (DRG). Discharges for patients who died at an initial stay or whose initial stay occurred in December of 2008 were also disqualified because they could not be followed for 30 days. If a patient was transferred to a different hospital on the same day as or next day after discharge from the previous stay, the two admissions were combined as a single stay. Transfers, thus, were not considered as a readmission. Payer Payer is based on the first hospital stay in the year with non-missing expected payer. To make coding uniform across all HCUP data sources, payer combines detailed categories into more general groups:
Up to two expected payers can be coded for a hospital stay in HCUP data. When this occurs, the following hierarchy is used:
About HCUP HCUP is a family of powerful healthcare databases, software tools, and products for advancing research. Sponsored by the Agency for Healthcare Research and Quality (AHRQ), HCUP includes the largest all-payer encounter-level collection of longitudinal healthcare data (inpatient, ambulatory surgery, and emergency department) in the United States, beginning in 1988. HCUP is a Federal-State-Industry Partnership that brings together the data collection efforts of many organizations—such as State data organizations, hospital associations, private data organizations, and the Federal government—to create a national information resource. HCUP would not be possible without the contributions of the following data collection Partners from across the United States: Arizona Department of Health Services Arkansas Department of Health California Office of Statewide Health Planning and Development Colorado Hospital Association Connecticut Hospital Association Florida Agency for Health Care Administration Georgia Hospital Association Hawaii Health Information Corporation Illinois Department of Public Health Indiana Hospital Association Iowa Hospital Association Kansas Hospital Association Kentucky Cabinet for Health and Family Services Louisiana Department of Health and Hospitals Maine Health Data Organization Maryland Health Services Cost Review Commission Massachusetts Division of Health Care Finance and Policy Michigan Health & Hospital Association Minnesota Hospital Association Missouri Hospital Industry Data Institute Montana MHA — An Association of Montana Health Care Providers Nebraska Hospital Association Nevada Department of Health and Human Services New Hampshire Department of Health & Human Services New Jersey Department of Health and Senior Services New Mexico Health Policy Commission New York State Department of Health North Carolina Department of Health and Human Services Ohio Hospital Association Oklahoma State Department of Health Oregon Association of Hospitals and Health Systems Pennsylvania Health Care Cost Containment Council Rhode Island Department of Health South Carolina State Budget & Control Board South Dakota Association of Healthcare Organizations Tennessee Hospital Association Texas Department of State Health Services Utah Department of Health Vermont Association of Hospitals and Health Systems Virginia Health Information Washington State Department of Health West Virginia Health Care Authority Wisconsin Department of Health Services Wyoming Hospital Association About the SID The HCUP State Inpatient Databases (SID) are hospital inpatient databases from data organizations participating in HCUP. The SID contain the universe of the inpatient discharge abstracts in the participating HCUP states, translated into a uniform format to facilitate multistate comparisons and analyses. Together, the SID encompasses 95 percent of all U.S. community hospital discharges in 2009. The SID can be used to investigate questions unique to one state; to compare data from two or more states; to conduct market area variation analyses; and to identify state-specific trends in inpatient care utilization, access, charges, and outcomes. For More Information For more information about HCUP, visit http://www.hcup-us.ahrq.gov. For additional HCUP statistics, visit HCUPnet, our interactive query system, at www.hcup.ahrq.gov. For information on other hospitalizations in the U.S., download HCUP Facts and Figures: Statistics on Hospital-based Care in the United States in 2008, located at http://www.hcup-us.ahrq.gov/reports.jsp. For a detailed description of HCUP, more information on the design of the SID, and revisit analyses using HCUP, please refer to the following publications: Introduction to the HCUP State Inpatient Databases. Online. June 2010. Agency for Healthcare Research and Quality. http://hcup-us.ahrq.gov/db/state/siddist/Introduction_to_SID.pdf Barrett M., Steiner C., Andrews R., Kassed C., Nagamine M. Methodological Issues when Studying Revisits using Hospital Administrative Data. 2011. HCUP Methods Series Report # 2011-01. Online. March 2011. Agency for Healthcare Research and Quality. http://www.hcup-us.ahrq.gov/reports/methods/methods.jsp. Suggested Citation Wier, L.M. (Thomson Reuters), Barrett, M.L. (M.L. Barrett), Steiner, C. (AHRQ), Jiang, H.J. (AHRQ). All-Cause Readmissions by Payer and Age, 2008. HCUP Statistical Brief #115. June 2011. Agency for Healthcare Research and Quality, Rockville, MD. http://www.hcup-us.ahrq.gov/reports/statbriefs/sb115.pdf Acknowledgments The authors would like to acknowledge the contribution of Minya Sheng of Thomson Reuters for SAS programming assistance. *** AHRQ welcomes questions and comments from readers of this publication who are interested in obtaining more information about access, cost, use, financing, and quality of healthcare in the United States. We also invite you to tell us how you are using this Statistical Brief and other HCUP data and tools, and to share suggestions on how HCUP products might be enhanced to further meet your needs. Please e-mail us at hcup@ahrq.gov or send a letter to the address below:Irene Fraser, Ph.D., Director Center for Delivery, Organization, and Markets Agency for Healthcare Research and Quality 540 Gaither Road Rockville, MD 20850 1 MedPac Report to Congress. Promoting Greater Efficiency in Medicare. June 2007. http://www.medpac.gov/docs/default-source/reports/Jun07_EntireReport.pdf?sfvrsn=0. 2 Axon R. N., Williams M. V. Hospital Readmission as an Accountability Measure. JAMA. 2011;305(5):504-505. 3 The HCUP revisit variables are available for the State Inpatient Databases, State Ambulatory Surgery Databases, and State Emergency Department Databases in select States starting in 2003. Appendix A of the User Guide provides a detailed list of which states, years, and types of data are available. 4 Overview of the HCUP Supplemental Variables for Revisit Analyses available at http://www.hcup-us.ahrq.gov/toolssoftware/revisit/revisit.jsp. 5 See definition section at the end of this Brief for additional information on methods. 6 Medicare covers patients who are 65 and older or disabled. |