STATISTICAL BRIEF #111
|
|
May 2011
Jennifer Lucado, M.P.H., Kathryn Paez, Ph.D., M.B.A., R.N., and Anne Elixhauser, Ph.D.
Introduction Headaches are a common cause of healthcare resource use in the United States and are generally a result of painful but benign headache disorders, including migraines.1 This Statistical Brief presents data from the Healthcare Cost and Utilization Project (HCUP) on headaches in 2008. One specific type of headache—migraine—will be highlighted.2 Migraine headaches last 4 to 72 hours and have a number of characteristics, which may include unilateral location, pulsating quality, moderate or severe pain intensity, and aggravation by routine physical activity. They are marked by nausea, vomiting, photophobia (sensitivity to light), and/or phonophobia (sensitivity to sound), and can be accompanied by fully reversible visual or sensory symptoms or speech disturbance.3 This Statistical Brief examines visits to the Emergency Department (ED) and inpatient stays for headache. For ED visits where headaches were the first-listed diagnosis, population rates, patient characteristics and discharge disposition are compared to ED visits for all diagnoses. Similar data with the addition of costs are presented for inpatient stays with a first-listed headache diagnosis and migraine. For each setting, figures highlight differences that were statistically significant. All differences between subgroup estimates noted in the text are statistically significant at the 0.05 level or better. Findings In 2008, there were over 3 million ED visits with headache as the first-listed diagnosis, accounting for 2.4 percent of all ED visits (table 1). When combined with the 2.5 million ED visits that listed headache as a secondary diagnosis, nearly 5.5 million visits, or 4.4 percent of all ED visits, involved headaches. During the same year, 81,000 inpatient stays (0.2 percent of all stays) had a first-listed headache diagnosis and 764,400 inpatient stays (1.9 percent of all inpatient stays) involved a secondary headache diagnosis. Among ED visits with a first-listed headache diagnosis, 34.6 percent were migraines. In comparison, among inpatient stays with a first-listed headache diagnosis, 63.1 percent of all headaches were migraines. |
|
| Table 1. Frequency of headache-related ED visits and inpatient hospital stays, 2008 | ||||||||
| Headache as first-listed diagnosis | Headache as secondary diagnosis only | |||||||
|---|---|---|---|---|---|---|---|---|
| ED | Inpatient | ED | Inpatient | |||||
| N | % | N | % | N | % | N | % | |
| All headaches combined, percentage of all visits/stays | 3,009,600 | 2.4% | 81,000 | 0.2% | 2,483,700 | 2.0% | 764,400 | 1.9% |
| Migraine, percentage of all headache visits/stays | 1,040,300 | 34.6% | 51,100 | 63.1% | 475,900 | 19.2% | 400,000 | 52.3% |
| Note: Percentages of all visits/stays are based on a total of 124,945,264 ED visits and 39,885,120 inpatient stays. Source: AHRQ, Center for Delivery, Organization, and Markets, Healthcare Cost and Utilization Project, Nationwide Emergency Department Sample and Nationwide Inpatient Sample, 2008 | ||||||||
ED visits for headache as a first-listed diagnosis
During 2008, there were 8,246 ED visits per day specifically for headache as the first-listed diagnosis. This equates to 989 ED visits per 100,000 U.S. population (table 2). |
| Table 2. Characteristics of headache-related ED visits, 2008 | |||
| All headaches combined | Migraine | All ED visits | |
|---|---|---|---|
| Total number of visits | 3,009,600 | 1,040,300 | 124,945,300 |
| ED visits per day | 8,246 | 2,850 | 342,316 |
| Rate per 100,000 population | 989 | 342 | 41,050 |
| Females, rate per 100,000 population | 1,435 | 557 | 44,525 |
| Males, rate per 100,000 population | 531 | 121 | 37,548 |
| Patient characteristics | |||
| Percentage of female patients | 73.5% | 82.6% | 54.9% |
| Mean age, years | 37.3 | 37.2 | 38.3 |
| Discharge status | |||
| Percentage treated and released | 97.0% | 96.0% | 82.3% |
| Percentage admitted to a hospital | 2.4% | 3.6% | 16.8% |
| Source: AHRQ, Center for Delivery, Organization, and Markets, Healthcare Cost and Utilization Project, Nationwide Emergency Department Sample, 2008 | |||
The rate of ED visits for females was 2.7 times higher than the rate for males—1,435 visits per 100,000 for females compared to 531 for males. In contrast, the female rate for all ED visits was only 1.2 times higher than the rate for males. Sex differences were greatest for migraine headaches, where females visited the ED at 4.6 times the rate observed among males (557 compared to 121 visits per 100,000 population). Similarly, most ED visits for headache were made by females (73.5 percent), with sex differences even more pronounced for migraine headaches (82.6 percent of visits were for females).
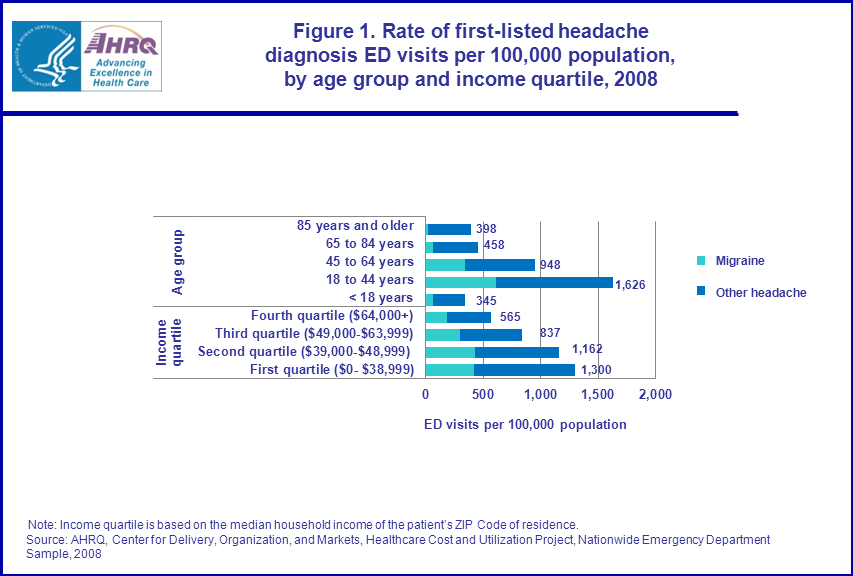
The vast majority of ED visits for headaches (97.0 percent) were treated and released, compared with only 82.3 percent of all ED visits. ED visits resulted in hospital admission for 3.6 percent of patients with migraine compared to 2.4 percent for all headaches combined. ED visits by age and income As shown in figure 1, the highest rate of ED visits for headaches was for the 18 to 44 year age group (1,626 ED visits per 100,000 population) and the lowest rate was for the under-18 year group (345 per 100,000 population). The highest rate of ED visits for headache was among patients residing in the lowest income quartile (1,300 ED visits per 100,000 population). The rate of visits for headache was lower in each subsequent quartile, with patients from the wealthiest quartile having the lowest rate of visits (565 per 100,000 population). The rate of visits for patients in the lowest income quartile was 2.3 times higher than in the wealthiest income quartile—a pattern similar to all ED visits (data not shown). |
|
Figure 1. Rate of first-listed headache diagnosis ED visits per 100,000 population,
by age group and income quartile, 2008. Bar chart by age group and income quartile; ED visits per 100,000 population; Age group; 85 years and older; 398; 65 to 84 years; 458; 45 to 64 years; 948; 18 to 44 years; 1,626; < 18 years; 345. Income quartile; Fourth quartile ($64,000+); 565. Third quartile ($49,000-$63,999); 837. Second quartile ($39,000-$48,999); 1,162. First quartile ($0- $38,999); 1,300. Note: Income quartile is based on the median household income of the patient’s ZIP Code of residence.
Source: AHRQ, Center for Delivery, Organization, and Markets, Healthcare Cost and Utilization Project, Nationwide Emergency Department Sample, 2008.
|
ED visits by region, rural/urban location, and month
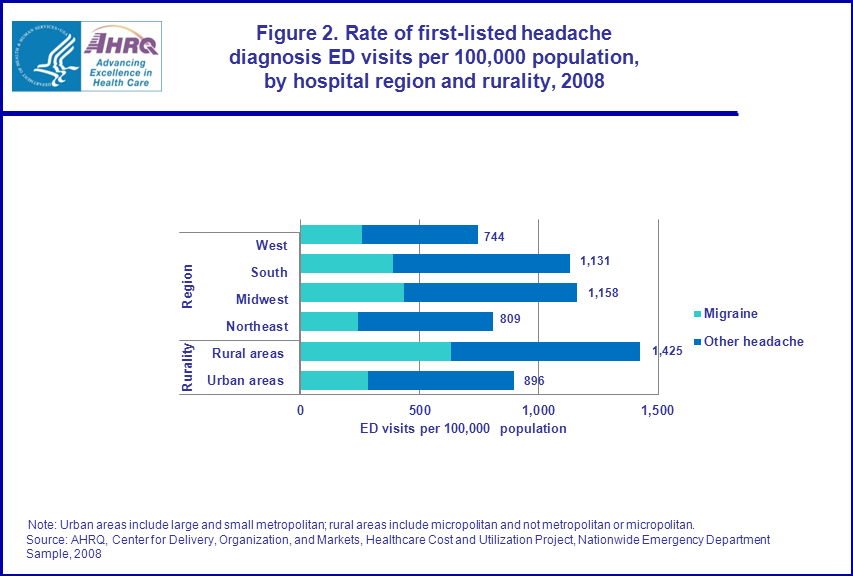
As shown in figure 2, the Midwest and South had the highest rates of ED visits for headaches—1,158 and 1,131 visits per 100,000 population, respectively. The Northeast and West had significantly lower rates at 809 and 744 visits per 100,000 population, respectively. This pattern differed from rates of all ED visits, where the Northeast had the highest ED visit rates overall closely followed by the Midwest and South, and the West had the lowest rates (data not shown). Patients in rural areas had higher rates of ED visits for headaches (1,425 per 100,000) compared to urban areas (896 per 100,000), a pattern similar to all ED visits (data not shown). |
|
Figure 2. Rate of first-listed headache diagnosis ED visits per 100,000 population,
by hospital region and rurality, 2008. Bar chart of Rate per 100,000 population, by rurality: Urban areas; 896. Rural areas ; 1,425. Rate per 100,000 population, by region: West; 744. South; 1,131. Midwest; 1,158. Northeast; 809. Note: Urban areas include large and small metropolitan; rural areas include micropolitan and not metropolitan or micropolitan. Source: AHRQ, Center for Delivery, Organization, and Markets, Healthcare Cost and Utilization Project, Nationwide Emergency Department Sample, 2008.
|
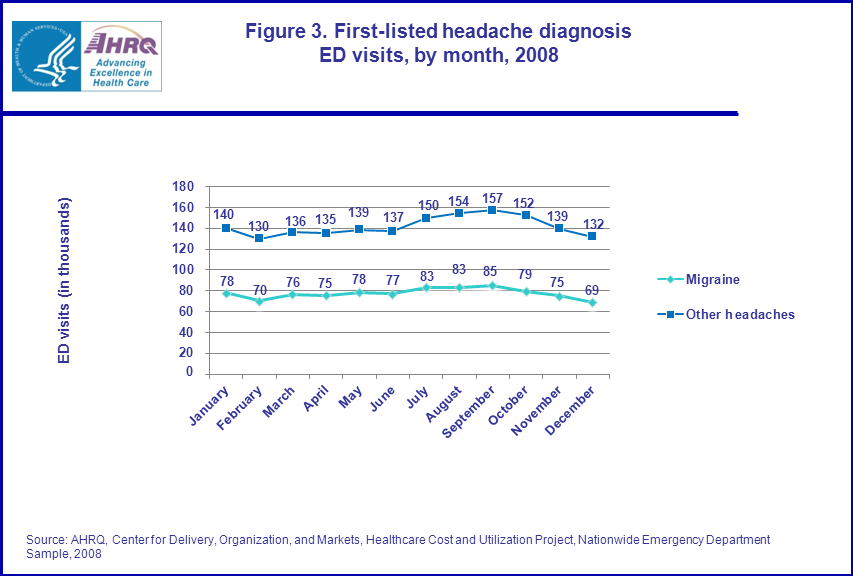
As shown in figure 3, the number of ED visits with a first-listed headache diagnosis varied by month, and patterns were similar for migraine and other headaches. In 2008, the number of visits increased in the summer months and peaked in September. February and December had the lowest numbers of ED headache visits.
|
|
Figure 3. First-listed headache diagnosis ED visits, by month, 2008.Trend line chart of Emergency Department visits (in thousands). Migraines. 140; January. 130 ; February. 136 ; March. 135 ; April. 139 ; May. 137 ; June. 150 ; July. 154 ; August. 157 ; September. 152 ; October. 139 ; November. 132 ; December. Other headaches. 78; January. 70; February. 76; March. 75; April. 78 ; May. 77 ; June. 83 ; July. 83 ; August. 85 ; September. 79 ; October. 75 ; November. 69 ; December. Source: AHRQ, Center for Delivery, Organization, and Markets, Healthcare Cost and Utilization Project, Nationwide Emergency Department Sample, 2008.
|
Inpatient stays for headache as a first-listed diagnosis
In 2008, there were 222 hospitalizations per day with headache as the first-listed diagnosis, at an aggregate cost of nearly $408 million for the year. A total of 51,100 of the 81,000 stays for headache (63.1 percent) were for migraine headaches (table 3). The mean length of stay for headaches was 2.7 days, about 40 percent shorter than the average hospital stay of 4.6 days. The average cost per headache stay was about 46 percent less expensive than the average overall ($5,000 versus $9,200); however, the average cost per day for headaches stays was comparable to the average cost per day for all inpatient stays ($1,900 versus $2,000 per day). The hospitalization rate for all headaches was 2.9 times higher for females than males, and for migraines, the rate was 3.7 times higher among females. In comparison, the overall hospitalization rate was only 1.4 times higher in females versus males. Compared with all inpatient stays, headache stays were more likely to be for females (74.7 percent versus 58.5 percent) and to be for younger patients (43.7 years for headache patients versus 48.5 years overall). |
| Table 3. Characteristics of headache-related inpatient stays, 2008 | |||
| All headaches combined | Migraine | All inpatient stays | |
|---|---|---|---|
| Total number of discharges | 81,000 | 51,100 | 39,885,100 |
| Hospitalizations per day | 222 | 140 | 109,274 |
| Rate per 100,000 population | 26.6 | 16.8 | 13,103.9 |
| Males, rate per 100,000 population | 13.6 | 7.0 | 11,004.7 |
| Females, rate per 100,000 population | 39.1 | 26.2 | 15,100.5 |
| Utilization characteristics | |||
| Mean length of stay, days | 2.7 | 2.7 | 4.6 |
| Average cost per stay | $5,000 | $5,000 | $9,200 |
| Aggregate costs | $407,540,100 | $253,143,800 | $364,858,636,100 |
| Patient characteristics | |||
| Percentage of patients female | 74.7% | 79.4% | 58.5% |
| Mean age, years | 43.7 | 41.5 | 48.5 |
| Source: AHRQ, Center for Delivery, Organization, and Markets, Healthcare Cost and Utilization Project, Nationwide Inpatient Sample, 2008 | |||
Inpatient stays by age, region and month of admission
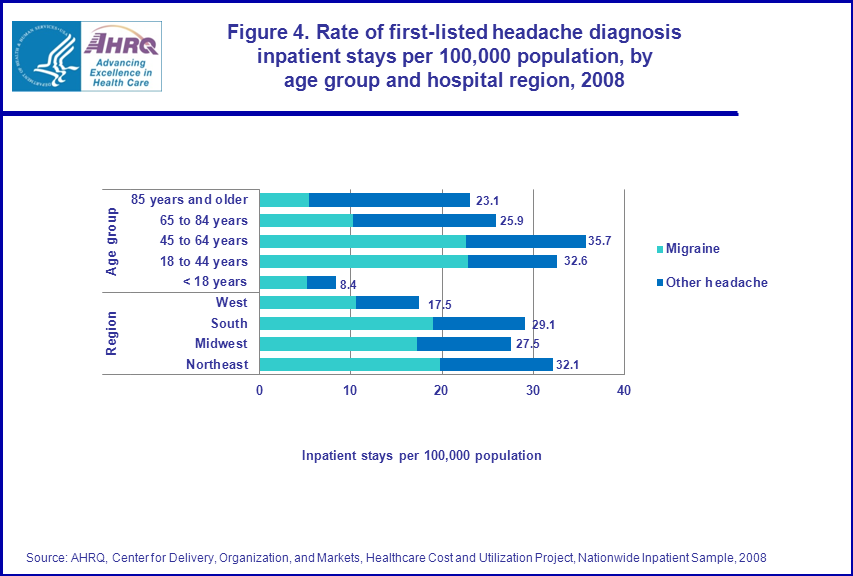
As shown in figure 4, the highest rate of hospitalization for headaches was for 45 to 64 year olds (35.7 per 100,000 population), followed by 18 to 44 year olds (32.6 per 100,000 population). This is in contrast to the findings for headache-related ED visits, which were significantly higher among 18 to 44 year olds than any other age group. The West had the lowest rate of inpatient stays for headache (17.5 per 100,000 population) compared to the three other regions, which had rates ranging from 27.5 to 32.1 per 100,000 population. This is in contrast to the findings for ED visits, where the Northeast and the West were comparably low. There were no differences in hospitalization rates by urban/rural location and income. |
|
Figure 4. Rate of first-listed headache diagnosis inpatient stays per 100,000 population, by age group and hospital region, 2008. Rate per 100,000 population, by region: 32.1; Northeast. 27.5; Midwest. 29.1; South. 17.5; West. Rate per 100,000 population, by age group: 8.4; < 18 years. 32.6; 18 to 44 years. 35.7; 45 to 64 years. 25.9; 65 to 84 years. 23.1; 85 years and older. Source: AHRQ, Center for Delivery, Organization, and Markets, Healthcare Cost and Utilization Project, Nationwide Emergency Department Sample, 2008.
|
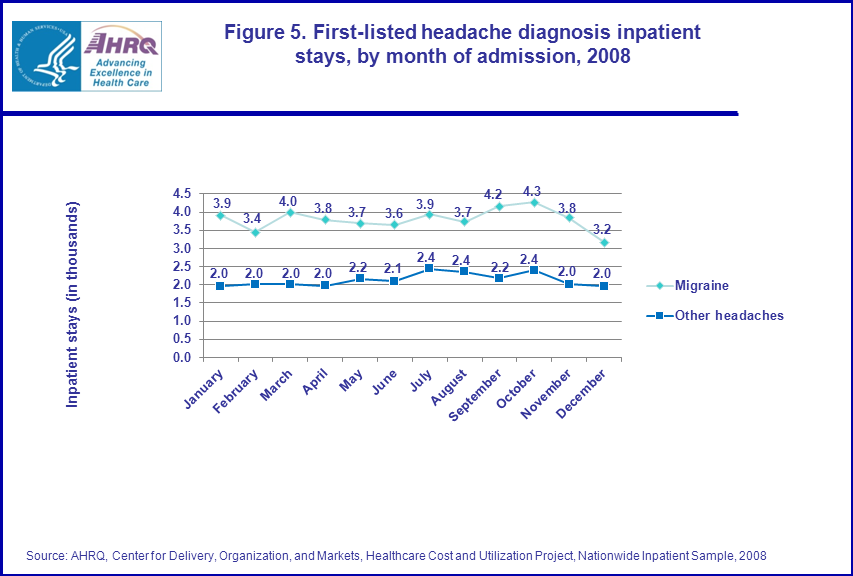
As shown in figure 5, the number of inpatient stays for headaches varied by month and differed somewhat for migraine and other headaches. Migraine headache stays had a low during February, peaked during October, and reached their lowest point in December. The number of stays for other headaches held steady from January to April then increased during July to October, declining again in November and December.
|
|
Figure 5. First-listed headache diagnosis inpatient stays, by month of admission, 2008. Migraine; 3.9; Other headaches; 2.0; January; Migraine; 3.4 ; Other headaches; 2.0; February; Migraine; 4.0 ; Other headaches; 2.0 ; March; Migraine; 3.8; Other headaches; 2.0 ; April; Migraine; 3.7; Other headaches; 2.2; May; Migraine; 3.6 ; Other headaches; 2.1; June; Migraine; 3.9 ; Other headaches; 2.4; July; Migraine; 3.7 ; Other headaches; 2.4; August; Migraine; 4.2; Other headaches; 2.2; September; Migraine; 4.3; Other headaches; 2.4 ; October; Migraine; 3.8; Other headaches; 2.0; November; Migraine; 3.2; Other headaches; 2.0; December. Source: AHRQ, Center for Delivery, Organization, and Markets, Healthcare Cost and Utilization Project, Nationwide Emergency Department Sample, 2008
|
Data Source
The estimates in this Statistical Brief are based upon data from the HCUP 2008 Nationwide Inpatient Sample (NIS) and Nationwide Emergency Department Sample (NEDS). Supplemental sources included data from the Population Division, U.S. Census Bureau for regional population estimates and population estimates by age and sex. The regional estimates were from the "Table 1: Annual Estimates of the Resident Population for the United States, Regions, States, and Puerto Rico: April 1, 2000 to July 1, 2009 (NST-EST2009-01)", release date, December 2009 (https://www.census.gov/programs-surveys/popest/data/data-sets.html). The population estimates by age and sex were from "Table 2: Annual Estimates of the Resident Population by Sex and Selected Age Groups for the United States: April 1, 2000 to July 1, 2008 (NC-EST2008-02)", release date, May 14, 2009 (http://www.census.gov/popest/). Median community-level income denominator data was from Claritas Population Estimates, 2001 to 2009 and urban-rural population denominator data was from Claritas Population Estimates, 2006 to 2009. Definitions Diagnoses The principal diagnosis is that condition established after study to be chiefly responsible for the patient’s admission to the hospital. Secondary diagnoses are concomitant conditions that coexist at the time of admission or that develop during the stay. ICD-9-CM is the International Classification of Diseases, Ninth Revision, Clinical Modification, which assigns numeric codes to diagnoses. There are about 13,600 ICD-9-CM diagnosis codes. Case definition The ICD-9-CM codes defining headaches include diagnosis codes in the following range: 307.81; 339.00-339.89; 346.00-346.93; and 784.0. ICD-9-CM codes 346.00-346.93 identify migraine headaches specifically. Types of hospitals included in HCUP HCUP is based on data from community hospitals, defined as short-term, non-Federal, general and other hospitals, excluding hospital units of other institutions (e.g., prisons). HCUP data include OB-GYN, ENT, orthopedic, cancer, pediatric, public, and academic medical hospitals. Excluded are long-term care, rehabilitation, psychiatric, and alcoholism and chemical dependency hospitals. Please note, a discharge of this nature will be included in the NIS if it occurred in a community hospital. Unit of analysis The unit of analysis is the hospital discharge (i.e., the hospital stay), not a person or patient. This means that a person who is admitted to the hospital multiple times in one year will be counted each time as a separate "discharge" from the hospital. Costs and charges Total hospital charges were converted to costs using HCUP Cost-to-Charge Ratios based on hospital accounting reports from the Centers for Medicare and Medicaid Services (CMS).4 Costs will tend to reflect the actual costs of production, while charges represent what the hospital billed for the case. For each hospital, a hospital-wide cost-to-charge ratio is used because detailed charges are not available across all HCUP States. Hospital charges reflect the amount the hospital charged for the entire hospital stay and does not include professional (physician) fees. For the purposes of this Statistical Brief, costs are reported to the nearest hundred. Hospital location The classification of whether a hospital is in an urban or rural area is defined using simplified groupings of the 2003 version of Urban Influence Codes. Urban areas are metropolitan counties. Rural areas are counties that are micropolitan or non-metropolitan/non-micropolitan. Median community-level income Median community-level income is the median household income of the patient’s ZIP Code of residence. The cut-offs for the quartile designation are determined using ZIP Code demographic data obtained from Claritas. The income quartile is missing for homeless and foreign patients. Region Region is one of the four regions defined by the U.S. Census Bureau:
HCUP is a family of powerful healthcare databases, software tools, and products for advancing research. Sponsored by the Agency for Healthcare Research and Quality (AHRQ), HCUP includes the largest all-payer encounter-level collection of longitudinal healthcare data (inpatient, ambulatory surgery, and emergency department) in the United States, beginning in 1988. HCUP is a Federal-State-Industry Partnership that brings together the data collection efforts of many organizations—such as State data organizations, hospital associations, private data organizations, and the Federal government—to create a national information resource. HCUP would not be possible without the contributions of the following data collection Partners from across the United States: Arizona Department of Health Services Arkansas Department of Health California Office of Statewide Health Planning and Development Colorado Hospital Association Connecticut Hospital Association Florida Agency for Health Care Administration Georgia Hospital Association Hawaii Health Information Corporation Illinois Department of Public Health Indiana Hospital Association Iowa Hospital Association Kansas Hospital Association Kentucky Cabinet for Health and Family Services Louisiana Department of Health and Hospitals Maine Health Data Organization Maryland Health Services Cost Review Commission Massachusetts Division of Health Care Finance and Policy Michigan Health & Hospital Association Minnesota Hospital Association Missouri Hospital Industry Data Institute Montana MHA — An Association of Montana Health Care Providers Nebraska Hospital Association Nevada Department of Health and Human Services New Hampshire Department of Health & Human Services New Jersey Department of Health and Senior Services New Mexico Health Policy Commission New York State Department of Health North Carolina Department of Health and Human Services Ohio Hospital Association Oklahoma State Department of Health Oregon Association of Hospitals and Health Systems Pennsylvania Health Care Cost Containment Council Rhode Island Department of Health South Carolina State Budget & Control Board South Dakota Association of Healthcare Organizations Tennessee Hospital Association Texas Department of State Health Services Utah Department of Health Vermont Association of Hospitals and Health Systems Virginia Health Information Washington State Department of Health West Virginia Health Care Authority Wisconsin Department of Health Services Wyoming Hospital Association About the NIS The HCUP Nationwide Inpatient Sample (NIS) is a nationwide database of hospital inpatient stays. The NIS is nationally representative of all community hospitals (i.e., short-term, non-Federal, non-rehabilitation hospitals). The NIS is a sample of hospitals and includes all patients from each hospital, regardless of payer. It is drawn from a sampling frame that contains hospitals comprising about 95 percent of all discharges in the United States. The vast size of the NIS allows the study of topics at both the national and regional levels for specific subgroups of patients. In addition, NIS data are standardized across years to facilitate ease of use. About the NEDS The HCUP Nationwide Emergency Department Database (NEDS) is a unique and powerful database that yields national estimates of emergency department (ED) visits. The NEDS was constructed using records from both the HCUP State Emergency Department Databases (SEDD) and the State Inpatient Databases (SID). The SEDD capture information on ED visits that do not result in an admission (i.e., treat-and-release visits and transfers to another hospital); the SID contain information on patients initially seen in the emergency room and then admitted to the same hospital. The NEDS was created to enable analyses of ED utilization patterns and support public health professionals, administrators, policymakers, and clinicians in their decision-making regarding this critical source of care. The NEDS is produced annually beginning in 2006. For More Information For more information about HCUP, visit http://www.hcup-us.ahrq.gov. For additional HCUP statistics, visit HCUPnet, our interactive query system, at www.hcup.ahrq.gov. For information on other hospitalizations in the U.S., download HCUP Facts and Figures: Statistics on Hospital-based Care in the United States in 2008, located at http://www.hcup-us.ahrq.gov/reports.jsp. For a detailed description of HCUP, more information on the design of the NIS and NEDS, and methods to calculate estimates, please refer to the following publications: Introduction to the HCUP Nationwide Inpatient Sample, 2008. Online. May 2010. U.S. Agency for Healthcare Research and Quality. http://hcup-us.ahrq.gov/db/nation/nis/NIS_2008_INTRODUCTION.pdf. Introduction to the HCUP Nationwide Emergency Department Sample, 2008. Online. October 2010. U.S. Agency for Healthcare Research and Quality. http://hcup-us.ahrq.gov/db/nation/neds/NEDS2008Introductionv3.pdf. Houchens, R., Elixhauser, A. Final Report on Calculating Nationwide Inpatient Sample (NIS) Variances, 2001. HCUP Methods Series Report #2003-2. Online. June 2005 (revised June 6, 2005). U.S. Agency for Healthcare Research and Quality. http://www.hcup-us.ahrq.gov/reports/methods/2003_02.pdf. Suggested Citation Lucado, J. (Social & Scientific Systems), Paez, K. (Social & Scientific Systems) and Elixhauser, A. (AHRQ). Headaches in U.S. Hospitals and Emergency Departments, 2008. HCUP Statistical Brief #111. May 2011. Agency for Healthcare Research and Quality, Rockville, MD. http://www.hcup-us.ahrq.gov/reports/statbriefs/sb111.pdf. Acknowledgments *** AHRQ welcomes questions and comments from readers of this publication who are interested in obtaining more information about access, cost, use, financing, and quality of healthcare in the United States. We also invite you to tell us how you are using this Statistical Brief and other HCUP data and tools, and to share suggestions on how HCUP products might be enhanced to further meet your needs. Please e-mail us at hcup@ahrq.gov or send a letter to the address below:Irene Fraser, Ph.D., Director Center for Delivery, Organization, and Markets Agency for Healthcare Research and Quality 540 Gaither Road Rockville, MD 20850 1 Friedman, B.W., Grosberg, B.M. "Diagnosis and management of primary headache disorders in the emergency department setting." Emergency Medicine Clinics of North America. 2009; 27(1): 71-87, viii. 2 Note: In October 2008, additional detailed headache diagnosis codes, including post-traumatic headache and cluster headache, were added to the ICD-9-CM. Aside from the 346 series, indicating migraines, all other new codes were grouped into the "other" headache category. 3 The Headache Classification Subcommittee of the International Headache Society. "The International Classification of Headache Disorders, 2nd Edition." Cephalalgia. 2004; 24 (Suppl. 1): 9-160. 4 HCUP Cost-to-Charge Ratio Files (CCR). Healthcare Cost and Utilization Project (HCUP). 2001–2008. U.S. Agency for Healthcare Research and Quality, Rockville, MD. www.hcup-us.ahrq.gov/db/state/costtocharge.jsp. |
| Internet Citation: Statistical Brief #111. Healthcare Cost and Utilization Project (HCUP). May 2011. Agency for Healthcare Research and Quality, Rockville, MD. hcup-us.ahrq.gov/reports/statbriefs/sb111.jsp. |
| Are you having problems viewing or printing pages on this website? |
| If you have comments, suggestions, and/or questions, please contact hcup@ahrq.gov. |
| If you are experiencing issues related to Section 508 accessibility of information on this website, please contact hcup@ahrq.gov. |
| Privacy Notice, Viewers & Players |
| Last modified 5/9/11 |