STATISTICAL BRIEF #105
|
|
February 2011
Pamela L. Owens, Ph.D., Maeve Woeltje, Ryan Mutter, Ph.D.
Introduction Half to three-quarters of individuals in the U.S. population experience back problems, largely defined as spondylosis, intervertebral disc disorders and other back pain, at some point during their lifetime.1,2 In 2008, back problems were among the leading all-listed reasons for emergency department (ED) visits, physician office visits and hospital outpatient visits for adults.3,4 Not only do back problems result in expensive and resource intensive medical care, but they also result in loss of functioning, reduced quality of life, and reduced productivity in the workforce.5,6 This Statistical Brief compiles information from the Healthcare Cost and Utilization Project (HCUP) on emergency department (ED) visits and hospital inpatient stays related to back problems in 2008. Characteristics of ED visits and hospitalizations related to back problems are compared to all other types of visits and stays. Age, patient location, expected primary payer, and top co-occurring diagnoses are examined. Findings Overall population In 2008, nearly 7.3 million ED visits and over 2.3 million inpatient stays were related to back problems either as a first-listed/principal diagnosis or as a secondary diagnosis, or complicating or comorbid condition (tables 1 and 2). On average, every day in 2008, there were 20,000 ED visits and 6,500 hospitalizations related to back problems. Of these, nearly half of the ED visits (46.9 percent) and over one-quarter (28.0 percent) of the inpatient stays listed back problems first or as a principal diagnosis; 7 the remainder listed back problems as a secondary, or complicating or comorbid condition. Table 1 shows that only 3.9 percent of patients seen in the ED with a first-listed diagnosis of back problems were admitted to the hospital. However, 17.2 percent of ED patients with any diagnosis of back problems were admitted to the hospital—slightly higher than the overall admission rate for ED patients (15.4 percent). As shown in tables 1 and 2, the rate of ED visits and inpatient stays related to back problems was 2,397 and 778 per 100,000 population, respectively. |
|
| Table 1. Characteristics of emergency department (ED) visits related to back problems, 2008 | |||
| ED visits for patients with back problems* | ED visits for patients with back problems as a first-listed diagnosis** | ED visits for patients without back problems | |
|---|---|---|---|
| Total number of visits1 | 7,294,280 | 3,423,942 | 117,631,572 |
| Percentage of all ED visits | 5.8 | 2.7 | 94.2 |
| ED visits per day | 19,984 | 9,381 | 322,278 |
| Rate per 100,000 population | 2,396.5 | 1,124.9 | 38,646.9 |
| Males, rate per 100,000 population | 2,043.2 | 1,005.1 | 35,477.0 |
| Females, rate per 100,000 population | 2,744.3 | 1,243.5 | 41,750.8 |
| Utilization characteristics | |||
| Percentage admitted to the hospital | 17.2 | 3.9 | 15.4 |
| Patient characteristics | |||
| Mean age, years | 47.0 | 43.6 | 37.8 |
| Patient residence | |||
| Large metropolitan (urban), rate per 100,000 population | 1,921.6 | 943.5 | 33,905.2 |
| Small metropolitan, rate per 100,000 population | 2,828.6 | 1,260.4 | 41,561.9 |
| Rural (micropolitan and non-core), rate per 100,000 population | 3,081.3 | 1,425.7 | 47,071.4 |
| Primary expected payer | |||
| Percentage Medicare | 26.3 | 18.8 | 20.1 |
| Percentage Medicaid | 17.8 | 18.7 | 22.6 |
| Percentage private insurance | 31.1 | 33.2 | 35.1 |
| Percentage uninsured | 24.0 | 28.4 | 21.5 |
| Percentage other | 24.0 | 28.4 | 21.5 |
| Source: AHRQ, Center for Delivery, Organization, and Markets, Healthcare Cost and Utilization Project, Nationwide Emergency Department Sample, 2008 *Based on all-listed diagnoses; **Based on records with back problems as a principal diagnosis; ***Other includes transfer to short-term acute care facility, transfer to long-term care facility, home healthcare and against medical advice; 119,412 (< .01%) ED visits omitted from the table due to missing diagnosis information. | |||
| Table 2. Characteristics of hospital stays related to back problems, 2008 | |||
| Hospital stays for patients with back problems* | Hospital stays for patients with back problems as a principal diagnosis** | Hospital stays for patients without back problems | |
|---|---|---|---|
| Total number of hospital stays1 | 2,368,148 | 663,402 | 37,510,305 |
| Percentage of all hospital stays | 5.9 | 1.7 | 94.1 |
| Hospitalizations per day | 6,488 | 1,818 | 102,768 |
| Rate per 100,000 population | 778.0 | 218.0 | 12,323.7 |
| Males, rate per 100,000 population | 673.5 | 209.3 | 10,329.4 |
| Females, rate per 100,000 population | 879.5 | 225.3 | 14,218.4 |
| Utilization characteristics | |||
| Mean length of stay, days | 4.3 | 2.0 | 4.6 |
| Average cost per visit/hospitalization | $10,971 | $14,338 | $9,055 |
| Average cost per day | $3,703 | $6,511 | $2,323 |
| Aggregate costs | $25,965,489,151 | $9,516,826,233 | $338,804,644,792 |
| Patient characteristics | |||
| Mean age, years | 60.5 | 57.2 | 47.6 |
| Patient residence | |||
| Large metropolitan (urban), rate per 100,000 population | 697.3 | 193.0 | 12,125.4 |
| Small metropolitan, rate per 100,000 population | 725.4 | 220.8 | 10,788.2 |
| Rural (micropolitan and non-core), rate per 100,000 population | 972.5 | 255.3 | 13,474.6 |
| Primary expected payer | |||
| Percentage Medicare | 49.5 | 37.1 | 36.7 |
| Percentage Medicaid | 9.1 | 5.4 | 19.1 |
| Percentage private insurance | 32.5 | 46.0 | 35.6 |
| Percentage uninsured | 8.5 | 11.2 | 8.1 |
| Percentage other | 0.4 | 0.3 | 0.6 |
| Source: AHRQ, Center for Delivery, Organization, and Markets, Healthcare Cost and Utilization Project, Nationwide Inpatient Sample, 2008 *Based on all-listed diagnoses **Based on records with back problems as a principal diagnosis 16,667 (<.01 %) discharges omitted from the table due to missing diagnosis information. | |||
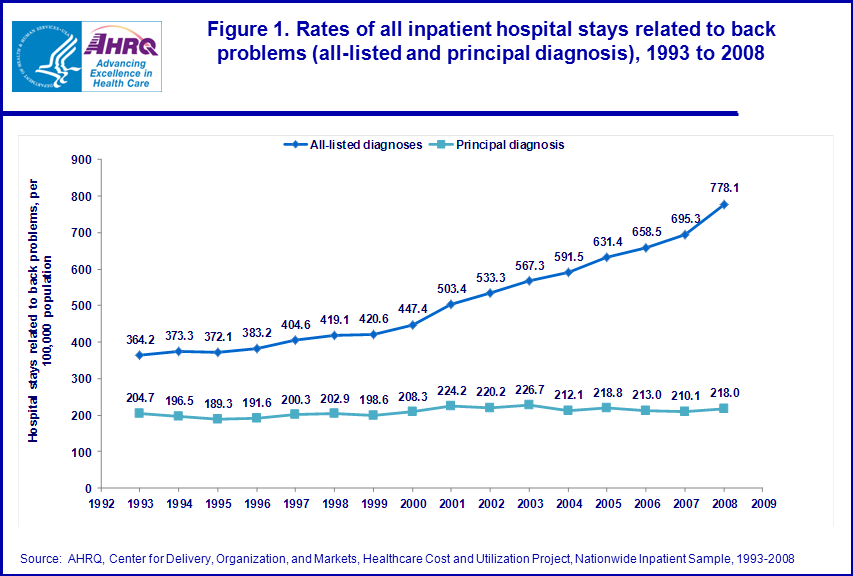
Figure 1 shows the trend of inpatient stays related to back problems between 1993 and 2008. While the rate of inpatient stays principally for back problems remained relatively stable during the 16-year period, there was a two-fold increase in the rate of all inpatient stays related to back problems (all-listed diagnoses). This indicates that back problems became more frequent as a complicating or comorbid condition.
|
Figure 1. Rates of all inpatient hospital stays related to back problems (all-listed and principal diagnosis), 1993 to 2008. Hospital stays related to back problems, per 100,000 population; all-listed diagnoses; 1993, 364.2, 1994, 373.3; 1995, 372.1; 1996, 383.2; 1997, 404.6; 1998, 419.1; 1999, 420.6; 2000, 447.4; 2001, 503.4; 2002, 533.3; 2003, 567.3; 2004, 591.5; 2005, 631.4; 2006, 658.5; 2007, 695.3; 2008, 778.1; Hospital stays related to back problems, per 100,000 population; principal diagnoses 1993, 204.7, 1994, 196.5; 1995, 189.3; 1996, 191.6; 1997, 200.3; 1998, 202.9; 1999, 198.6; 2000, 208.3; 2001, 224.2; 2002, 220.2; 2003, 226.7; 2004, 212.1; 2005, 218.8; 2006, 213.0; 2007, 210.1; 2008, 218.0; Source: AHRQ, Center for Deliver, Organization and Markets, Healthcare Cost and Utilization Project, Nationwide Inpatient Sample, 1993-2008. |
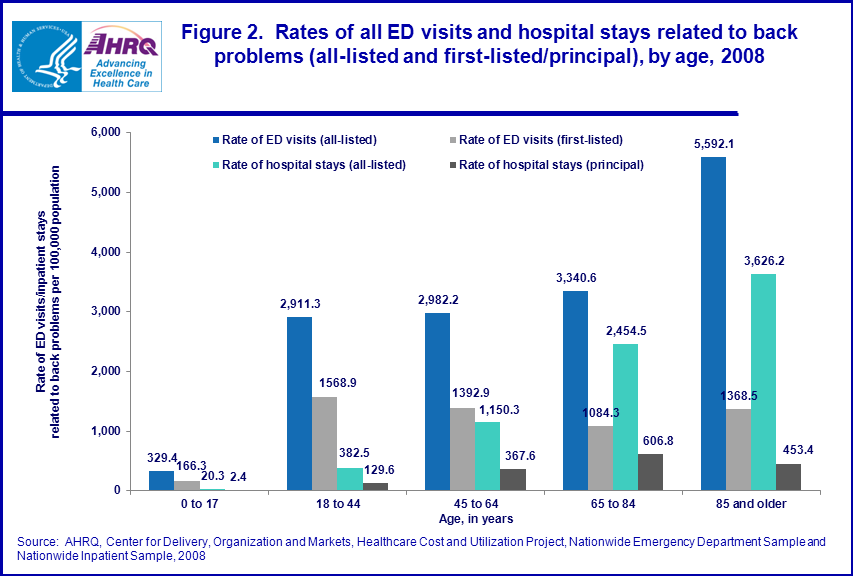
ED visits and inpatient stays related to back problems by sex and age The majority of patients seen in the ED and hospital for back problems were female (tables 1 and 2). The ED visit rate for all back problems was 2,744 per 100,000 for females and 2,043 per 100,000 for males, while the hospitalization rate was 880 per 100,000 for females and 674 per 100,000 for males. ED and hospitalized patients with back problems tended to be older than other patients. ED patients with back problems were 6–9 years older than ED patients without back problems (43.6 and 47.0 versus 37.8 years, respectively). Hospitalized patient with back problems were 10–13 years older than those without back problems (57.2 and 60.5 versus 47.6 years, respectively). Figure 2 shows that rates of ED visits and inpatient stays for patients with any diagnosis of back problems increased with age. The highest rates for all-listed back problems were for patients 85 years and older (5,592 ED visits and 3,626 inpatient stays per 100,000 population). However, the rate of ED visits for patients with a first-listed diagnosis of back problems was highest for 18 to 44 year olds (1,569 per 100,000 population) and the rate of stays for patients principally hospitalized for back problems was highest for 65 to 84 year olds (607 per 100,000). |
Figure 2. Rates of all ED visits and hospital stays related to back problems (all-listed and first-listed/principal), by age, 2008. Rate of ED visits/inpatient stays related to back problems per 100,000 population, age, in years, 0 to 17. Age, in years, 18 to 44; rate of ED visits (all-listed), 2,911.3; Rate of ED visits (first-listed) 1568.9; Rate of hospital stays (all-listed), 382.5; Rate of hospital stays (principal), 129.6;
Age, in years, 45 to 64 years; rate of ED visits (all-listed), 2,982.2; Rate of ED visits (first-listed) 1,392.9; Rate of hospital stays (all-listed), 1,150.3; Rate of hospital stays (principal), 367.6; Age, in years, 65 to 84, years, rate of ED visits (all-listed), 3,340.6; Rate of ED visits (first-listed) 1,084.3; Rate of hospital stays (all-listed), 2454.5; Rate of hospital stays (principal), 606.8; Age, in years, 85 and older; rate of ED visits (all-listed), 5,592.14; Rate of ED visits (first-listed) 1,368.5; Rate of hospital stays (all-listed), 3,626.2; Rate of hospital stays (principal), 453.4; Source; AHRQ, Center for Deliver, Organization and Markets, Healthcare and Cost and Utilization Project, Nationwide Emergency Department Sample and Nationwide Inpatient Sample, 2008. |
ED visits and inpatient stays related to back problems by patient location
Tables 1 and 2 show the rate of ED visits and inpatient stays related to back problems by patient residence, respectively. The rates of ED visits and hospitalizations were highest for patients from rural areas and lowest for patients from large metropolitan areas, similar to the pattern for patients without back problems. For example, the rate of all ED visits for patients with back problems was 3,081 per 100,000 population in rural areas and 1,922 per 100,000 in urban areas. Similarly, the rate of inpatient stays for all back problems was 973 per 100,000 in rural areas and 697 per 100,000 in urban areas. Cost and length of stay for inpatient stays related to back problems For patients principally admitted to the hospital for back problems, the average total costs of hospital stays were higher than for patients with any diagnosis of back problems ($14,338 and $10,971, respectively). Furthermore, hospitalizations for back problems in general were more expensive than all other inpatient stays ($9,055). Despite higher costs, the average length of inpatient stays principally for back problems (2.0 days) was shorter than stays with any diagnosis of back problems (4.3 days) as well as other inpatient stays (4.6 days). The aggregate costs for hospitalizations for patients with back problems as a principal diagnosis was over $9.5 billion, accounting for nearly 3 percent of the total national hospital bill and making it the 9th most expensive condition in 2008. ED visits and inpatient stays related to back problems by payer Table 1 shows that ED visits with back problems as a first-listed diagnosis were primarily billed to private insurance (33.2 percent) and as uninsured (28.4 percent). In addition to private insurance and uninsured, ED visits for patients with any diagnosis of back problems were frequently billed to Medicare (26.3 percent). Medicaid was billed for less than one-fifth of ED visits related to back problems (18.7 and 17.8 percent for visits for patients with back problems as a first-listed and all-listed diagnosis, respectively). Table 2 shows that over 80 percent of inpatient stays for patients with a principal or any diagnosis of back problems were billed to private insurance (46.0 and 32.5 percent, respectively) and Medicare (37.1 and 49.5 percent, respectively). Co-occurring diagnoses for ED visits and hospitals stays related to back problems For ED patients with any diagnosis of back problems, 47 percent had back problems as a first-listed diagnosis ("spondylosis, intervertebral disc disorders, and other back problems"), as shown in table 3. Three of the ten most common first-listed conditions were injuries—sprains and strains, superficial injury and other injuries and conditions. Other common first-listed conditions were pain-related, including acute and chronic pain categorized as other nervous system disorders, nonspecific chest pain, abdominal pain and headache including migraine. Back problems were a coexisting condition for 21 percent of ED visits for patients with a first-listed condition of other nervous system disorders, which includes acute and chronic pain. |
| Table 3. Top 10 first-listed diagnoses for emergency department (ED) visits for patients with back problems, 2008 | |||
| Rank | First-Listed Diagnosis (CCS Code) | Number of ED visits among patients with back problems (percent of all visits)* | For each first-listed diagnosis, percentage of ED visits with back problems as a coexisting condition** |
|---|---|---|---|
| All visits related to back problems | 7,294,280 (100.0) | ||
| 1 | Spondylosis, intervetebral disc disorders, other back problems (205) | 3,423,942 (46.9%) | N/A |
| 2 | Sprains and strains (232) | 519,151 (7.1%) | 8.3% |
| 3 | Other nervous system disorders (95)*** | 280,648 (3.9%) | 21.1% |
| 4 | Nonspecific chest pain (102) | 196,921 (2.7%) | 4.9% |
| 5 | Superficial injury; contusion (239) | 189,236 (2.6%) | 3.2% |
| 6 | Abdominal pain (251) | 170,867 (2.3%) | 3.5% |
| 7 | Headache; including migraine (84) | 127,236 (1.7%) | 4.3% |
| 8 | Urinary tract infections (159) | 125,450 (1.7%) | 4.4% |
| 9 | Other injuries and conditions due to external causes (244) | 100,165 (1.4%) | 3.6% |
| 10 | Other connective tissue disease (211) | 99,883 (1.4%) | 5.0% |
| Source: AHRQ, Center for Delivery, Organization, and Markets, Healthcare Cost and Utilization Project, Nationwide Emergency Department Sample, 2008 *Based on all-listed diagnoses **Based on all ED visit records with back problems as a secondary diagnosis. For example, for ED visits with a first-listed diagnosis of sprains and strains, 8.3 percent have back problems as a coexisting condition. ***Other nervous system disorders include acute and chronic pain, not elsewhere classified and skin sensitivity | |||
For inpatient stays with any diagnosis of back problems, 28 percent had back problems as a principal diagnosis ("spondylosis, intervetebral disc disorders, and other back problems") as shown in table 4. The next most common principal condition among patients with back problems was mood disorders (3.3 percent of inpatient stays) followed by nonspecific chest pain (2.5 percent of inpatient stays). Most of the top 10 reasons for hospitalization were suggestive of chronic conditions except pneumonia and complications of a device or implant.
|
| Table 4. Top 10 principal diagnoses for hospital stays for patients with back problems, 2008 | |||
| Rank | Principal Diagnosis (CCS Code) | Number of hospital stays among patients with back problems (percent of all stays)* | For each principal diagnosis, percentage of hospital stays with back problems as a coexisting condition** |
|---|---|---|---|
| All stays related to back problems | 2,368,148 (100.0%) | ||
| 1 | Spondylosis, intervetebral disc disorders, other back problems (205) | 663,402 (28.0%) | N/A |
| 2 | Mood disorders (657) | 76,513 (3.3%) | 9.3% |
| 3 | Nonspecific chest pain (102) | 59,675 (2.5%) | 8.2% |
| 4 | Pneumonia (122) | 59,271 (2.5%) | 5.1% |
| 5 | Osteoarthritis (203) | 55,840 (2.4%) | 6.1% |
| 6 | Chronic obstructive pulmonary disease (127) | 55,339 (2.3%) | 7.7% |
| 7 | Rehabilitative care, fitting of prothesis (254) | 42,101 (1.8%) | 10.3% |
| 8 | Coronary atherosclerosis (101) | 41,569 (1.8%) | 4.5% |
| 9 | Complication of device, implant (237) | 38,836 (1.6%) | 5.7% |
| 10 | Cardiac dysrhythmias (106) | 36,060 (1.5%) | 4.5% |
| Source: AHRQ, Center for Delivery, Organization, and Markets, Healthcare Cost and Utilization Project, Nationwide Inpatient Sample, 2008 *Based on all-listed diagnoses **Based on all discharge records with back problems as a secondary diagnosis. For example, for hospitalizations with a principal diagnosis of mood disorders, 9.3 percent have back problems as a coexisting condition. | |||
Data Source
The estimates in this Statistical Brief are based upon data from the HCUP 2008 Nationwide Inpatient Sample (NIS) and the 2008 Nationwide Emergency Department Sample (NEDS). Historical inpatient data were drawn from the 1993–2007 NIS. The statistics for the trend data were generated from HCUPnet, a free, online query system that provides users with immediate access to largest set of publicly available, all-payer national, regional, and state-level hospital care databases from HCUP. Supplemental source included data on population estimates are from "Table 1: Annual Estimates of the Resident Population for the United States, Regions, States, and Puerto Rico: April 1, 2000 to July 1, 2009 (NST-EST2009-01)", Population Division, U.S. Census Bureau, Release date: December 2009 (https://www.census.gov/programs-surveys/popest/data/tables.html) and information in the methods report by Barrett M, Hunter K, Coffey R, Levit K. Population Denominator Data for Use with the HCUP Databases (Updated with 2009 Population Data). HCUP Methods Series Report # 2010-02. Online April 12, 2010. U.S. Agency for Healthcare Research and Quality. Available: http://www.hcup-us.ahrq.gov/reports/methods/methods.jsp. Definitions Diagnoses, ICD-9-CM, and Clinical Classifications Software (CCS) The principal diagnosis is that condition established after study to be chiefly responsible for the patient’s admission to the hospital. Secondary diagnoses are concomitant conditions that coexist at the time of admission or that develop during the stay. All-listed diagnoses include the principal diagnosis plus these additional secondary conditions. ICD-9-CM is the International Classification of Diseases, Ninth Revision, Clinical Modification, which assigns numeric codes to diagnoses. There are about 13,600 ICD-9-CM diagnosis codes. CCS categorizes ICD-9-CM diagnoses into a manageable number of clinically meaningful categories.8 This "clinical grouper" makes it easier to quickly understand patterns of diagnoses and procedures. Case definition The Clinical Classifications Software code definition for back problems is 205: Spondylosis, intervertebral disc disorders; other back problems. Cases were obtained based on all-listed diagnosis on the record. Types of hospitals included in HCUP HCUP is based on data from community hospitals, defined as short-term, non-Federal, general and other hospitals, excluding hospital units of other institutions (e.g., prisons). HCUP data include OB-GYN, ENT, orthopedic, cancer, pediatric, public, and academic medical hospitals. They exclude long-term care, rehabilitation, psychiatric, and alcoholism and chemical dependency hospitals, but these types of discharges are included if they are from community hospitals. Unit of analysis The unit of analysis is the ED visit or hospital discharge (i.e., the hospital stay), not a person or patient. This means that a person who is admitted to the ED or hospital multiple times in one year will be counted each time as a separate "visit" or "discharge" from the hospital. Costs and charges Total hospital charges were converted to costs using HCUP Cost-to-Charge Ratios based on hospital accounting reports from the Centers for Medicare and Medicaid Services (CMS).9 Costs will tend to reflect the actual costs of production, while charges represent what the hospital billed for the case. For each hospital, a hospital-wide cost-to-charge ratio is used because detailed charges are not available across all HCUP States. Hospital charges reflect the amount the hospital charged for the entire hospital stay and do not include professional (physician) fees. For the purposes of this Statistical Brief, costs are reported to the nearest hundred. Urban-rural location Urban-rural location is one of six categories as defined by the National Center for Health Statistics:
Payer The unit of analysis is the hospital discharge (i.e., the hospital stay), not a person or patient. This means that a person who is admitted to the hospital multiple times in one year will be counted each time as a separate "discharge" from the hospital. Payer Payer is the expected primary payer for the ED visit or hospital stay. To make coding uniform across all HCUP data sources, payer combines detailed categories into more general groups:
About HCUP HCUP is a family of powerful healthcare databases, software tools, and products for advancing research. Sponsored by the Agency for Healthcare Research and Quality (AHRQ), HCUP includes the largest all-payer encounter-level collection of longitudinal healthcare data (inpatient, ambulatory surgery, and emergency department) in the United States, beginning in 1988. HCUP is a Federal-State-Industry Partnership that brings together the data collection efforts of many organizations—such as State data organizations, hospital associations, private data organizations, and the Federal government—to create a national information resource. HCUP would not be possible without the contributions of data collection Partners from across the United States. All of the following data Partners contributed inpatient data for the most recent data year and varying subsets contributed inpatient data in past years. In addition, subsets of these data Partners contributed emergency department and ambulatory surgery data. See the HCUP-US website (www.hcup-us.ahrq.gov) for details on which states contributed data for particular data sets and years. Arizona Department of Health Services Arkansas Department of Health California Office of Statewide Health Planning and Development Colorado Hospital Association Connecticut Hospital Association Florida Agency for Health Care Administration Georgia Hospital Association Hawaii Health Information Corporation Illinois Department of Public Health Indiana Hospital Association Iowa Hospital Association Kansas Hospital Association Kentucky Cabinet for Health and Family Services Louisiana Department of Health and Hospitals Maine Health Data Organization Maryland Health Services Cost Review Commission Massachusetts Division of Health Care Finance and Policy Michigan Health & Hospital Association Minnesota Hospital Association Missouri Hospital Industry Data Institute Montana MHA — An Association of Montana Health Care Providers Nebraska Hospital Association Nevada Department of Health and Human Services New Hampshire Department of Health & Human Services New Jersey Department of Health and Senior Services New Mexico Health Policy Commission New York State Department of Health North Carolina Department of Health and Human Services Ohio Hospital Association Oklahoma State Department of Health Oregon Association of Hospitals and Health Systems Pennsylvania Health Care Cost Containment Council Rhode Island Department of Health South Carolina State Budget & Control Board South Dakota Association of Healthcare Organizations Tennessee Hospital Association Texas Department of State Health Services Utah Department of Health Vermont Association of Hospitals and Health Systems Virginia Health Information Washington State Department of Health West Virginia Health Care Authority Wisconsin Department of Health Services Wyoming Hospital Association About the NIS The HCUP Nationwide Inpatient Sample (NIS) is a nationwide database of hospital inpatient stays. The NIS is nationally representative of all community hospitals (i.e., short-term, non-Federal, non-rehabilitation hospitals). The NIS is a sample of hospitals and includes all patients from each hospital, regardless of payer. It is drawn from a sampling frame that contains hospitals comprising about 95 percent of all discharges in the United States. The vast size of the NIS allows the study of topics at both the national and regional levels for specific subgroups of patients. In addition, NIS data are standardized across years to facilitate ease of use. About the NEDS The HCUP Nationwide Emergency Department Database (NEDS) is a unique and powerful database that yields national estimates of emergency department (ED) visits. The NEDS was constructed using records from both the HCUP State Emergency Department Databases (SEDD) and the State Inpatient Databases (SID). The SEDD capture information on ED visits that do not result in an admission (i.e., treat-and-release visits and transfers to another hospital); the SID contain information on patients initially seen in the emergency room and then admitted to the same hospital. The NEDS was created to enable analyses of ED utilization patterns and support public health professionals, administrators, policymakers, and clinicians in their decision-making regarding this critical source of care. About HCUPnet HCUPnet is an online query system that offers instant access to the largest set of all-payer healthcare databases that are publicly available. HCUPnet has an easy step-by-step query system, allowing for tables and graphs to be generated on national and regional statistics, as well as trends for community hospitals in the U.S. HCUPnet generates statistics using data from HCUP's Nationwide Inpatient Sample (NIS), the Kids' Inpatient Database (KID), the Nationwide Emergency Department Sample (NEDS), the State Inpatient Databases (SID) and the State Emergency Department Databases (SEDD). For More Information For more information about HCUP, visit http://www.hcup-us.ahrq.gov. For additional HCUP statistics, visit HCUPnet, our interactive query system, at www.hcup.ahrq.gov. For information on other hospitalizations in the U.S., download HCUP Facts and Figures: Statistics on Hospital-based Care in the United States in 2008, located at http://www.hcup-us.ahrq.gov/reports.jsp. For a detailed description of HCUP, more information on the design of the NIS, and methods to calculate estimates, please refer to the following publications: Steiner, C., Elixhauser, A., Schnaier, J. The Healthcare Cost and Utilization Project: An Overview. Effective Clinical Practice 5(3):143–51, 2002. Introduction to the HCUP Nationwide Inpatient Sample, 2008. Online. July 2010. U.S. Agency for Healthcare Research and Quality. http://hcup-us.ahrq.gov/db/nation/nis/NIS_2008_INTRODUCTION.pdf. Introduction to the HCUP Nationwide Emergency Department Sample, 2008. Online. October 2010. U.S. Agency for Healthcare Research and Quality. http://hcup-us.ahrq.gov/db/nation/neds/NEDS2008Introductionv3.pdf. Barrett M., Hunter K., Coffey R., Levit K. Population Denominator Data for User with the HCUP Databases (Updated with 2009 Population Data). HCUP Methods Series Report #2010-02. Online. April 2010. U.S. Agency for Healthcare Research and Quality. http://hcup-us.ahrq.gov/reports/methods/2010_02.pdf. Houchens, R., Elixhauser, A. Final Report on Calculating Nationwide Inpatient Sample (NIS) Variances, 2001. HCUP Methods Series Report #2003-2. Online. June 2005 (revised June 6, 2005). U.S. Agency for Healthcare Research and Quality. http://www.hcup-us.ahrq.gov/reports/methods/2003_02.pdf. Suggested Citation Owens P.L. (AHRQ), Woeltje M. (Student), Mutter R. (AHRQ). Emergency Department Visits and Inpatient Stays Related to Back Problems, 2008. HCUP Statistical Brief #105. February 2011. Agency for Healthcare Research and Quality, Rockville, MD. http://www.hcup-us.ahrq.gov/reports/statbriefs/sb105.pdf. *** AHRQ welcomes questions and comments from readers of this publication who are interested in obtaining more information about access, cost, use, financing, and quality of healthcare in the United States. We also invite you to tell us how you are using this Statistical Brief and other HCUP data and tools, and to share suggestions on how HCUP products might be enhanced to further meet your needs. Please e-mail us at hcup@ahrq.gov or send a letter to the address below:Irene Fraser, Ph.D., Director Center for Delivery, Organization, and Markets Agency for Healthcare Research and Quality 540 Gaither Road Rockville, MD 20850 1 Manchikanti L., Singh V., Datta S. et al. Comprehensive review of epidemiology, scope and impact of spinal pain. Pain Physician. 2009;12:E35-E70. 2 Santaguida P.L., Gross A., Busse J., et al. Evidence Report on Complementary and Alternative Medicine in Back Pain Utilization Report. Evidence Report/Technology Assessment No. 177. (Prepared by the McMaster University Evidence-based Practice Center, under Contract No. 290-02-0020.) AHRQ Publication No.09-E006) Rockville, MD. Agency for Healthcare Research and Quality. February 2009. 3 Owens P.L., Mutter R. Emergency Department Visits Abuse for Adults in Community Hospitals, 2008. HCUP Statistical Brief #100. November 2010. Agency for Healthcare Research and Quality, Rockville, MD. http://www.hcup-us.ahrq.gov/reports/statbriefs/sb100.pdf. 4 Centers for Disease Control and Prevention, National Center for Health Statistics, National Ambulatory Medical Care Survey and National Hospital Ambulatory Medical Care Survey. Preliminary Data from NAMCS and NHAMCS. Table 2: Top 5 diagnoses to office-based physicians and hospital outpatient departments by age and sex, 2008. Available at: http://www.cdc.gov/nchs/data/ahcd/preliminary2008/table02.pdf 5 Martin B.I., Deyo R.A., Mirza S.K. et al. Expenditures and Health Status among Adults with Back and Neck Problems. JAMA. 2008;299:656-664. 6 Manek J., MacGregor A.J. Epidemiology of back disorders: prevalence, risk factors, and prognosis, Current Opinion in Rheumatology, March 2005, 17(2):134-140. 7 The first-listed or principal diagnosis is the diagnosis that appears first on the record. For ED visits that result in hospital admission, this is the principal diagnosis. The principal diagnosis is that condition established after study to be chiefly responsible for occasioning the admission of the patient to the hospital for care. The principal diagnosis is always the reason for admission. For treat-and-release ED visits, it may not be the principal diagnosis but may simply be the diagnosis that appears first on the record. 8 HCUP CCS. Healthcare Cost and Utilization Project (HCUP). December 2009. U.S. Agency for Healthcare Research and Quality, Rockville, MD. www.hcup-us.ahrq.gov/toolssoftware/ccs/ccs.jsp 9 HCUP Cost-to-Charge Ratio Files (CCR). Healthcare Cost and Utilization Project (HCUP). 2001–2008. U.S. Agency for Healthcare Research and Quality, Rockville, MD. www.hcup-us.ahrq.gov/db/state/costtocharge.jsp. |
| Internet Citation: Statistical Brief #105. Healthcare Cost and Utilization Project (HCUP). February 2011. Agency for Healthcare Research and Quality, Rockville, MD. hcup-us.ahrq.gov/reports/statbriefs/sb105.jsp. |
| Are you having problems viewing or printing pages on this website? |
| If you have comments, suggestions, and/or questions, please contact hcup@ahrq.gov. |
| If you are experiencing issues related to Section 508 accessibility of information on this website, please contact hcup@ahrq.gov. |
| Privacy Notice, Viewers & Players |
| Last modified 2/4/11 |