STATISTICAL BRIEF #104
|
|
January 2011
Elizabeth Stranges, MS, Katheryn Ryan, MPH, Anne Elixhauser, PhD
Introduction In 2008, approximately 19 percent of the U.S. population received medical insurance through Medicaid,1 a joint federal-state health insurance program for eligible low-income individuals and families. Eligibility requirements vary by state and are based on factors including household income, disability, age, and pregnancy.2 With changes to eligibility requirements recently enacted through healthcare reform, the Medicaid program will expand to cover more of the nation’s uninsured.3 This Statistical Brief presents descriptive data from the Healthcare Cost and Utilization Project (HCUP) Nationwide Inpatient Sample (NIS) and provides an overview of hospitalizations for patients whose primary payer was Medicaid in 2008.4 This Statistical Brief also compares the differences between stays billed to Medicaid and those with an expected primary payer of private insurance or uninsured. All differences between estimates provided in the text are statistically significant at the 0.05 level or better. Findings In 2008, Medicaid was the primary expected payer for 7.4 million hospitalizations, accounting for 18.4 percent of all U.S. community hospital stays (table 1). |
|
| Table 1. Characteristics of hospital inpatients covered by Medicaid, private insurance, and the uninsured, 2008 | |||
| Medicaid | Private Insurance | Uninsured | |
|---|---|---|---|
| Number of discharges (millions) (share of all discharges) | 7.4 (18.4%) | 14.1 (35.4%) | 2.1 (5.3%) |
| Age, mean (in years) | 24.6a,b | 37.1a | 36.2b |
| Percentage distribution by: | |||
| Age groups | |||
| <1 | 27.5a,b | 16.8a | 12.1b |
| 1-17 | 9.8a,b | 5.2a | 2.8b |
| 18-44 | 41.4a,b | 34.6a | 47.1b |
| 45-64 | 18.6a,b | 34.6a | 34.1b |
| 65+ | 2.7a,b | 8.8a | 3.9b |
| Sex | |||
| Male | 35.4a,b | 40.0a | 51.9b |
| Female | 64.6a,b | 60.0a | 48.1b |
| Median income of patient's ZIP Code | |||
| Low income (under $39,000) | 42.1a,b | 19.3a | 36.2b |
| Not low income ($39,000 and above) | 57.9a,b | 80.7a | 63.8b |
| Patient residence | |||
| Large central metro area | 37.1b | 32.0a | 34.0 |
| Large fringe metro (suburban) | 16.6a,b | 27.2a | 21.9b |
| Medium and small metro area | 27.5 | 25.3 | 26.1 |
| Non-metropolitan area (rural) | 18.7b | 15.4a | 18.0 |
| aMedicaid stays are significantly different from privately insured stays at p < 0.05 bMedicaid stays are significantly different from uninsured stays at p <0.05 Source: AHRQ, Center for Delivery, Organization, and Markets, Healthcare Cost and Utilization Project, Nationwide Inpatient Sample, 2008 | |||
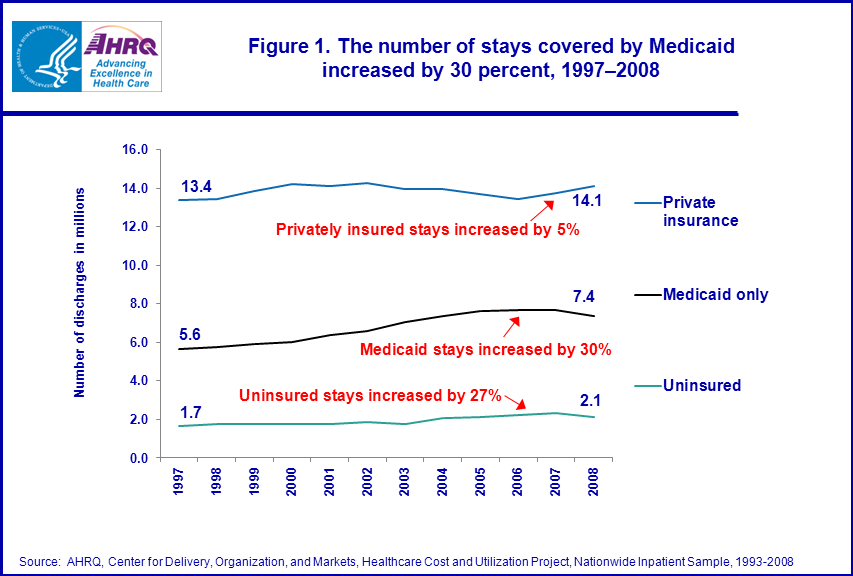
Almost twice as many (14.1 million) hospital stays were paid by private insurance. The uninsured accounted for 2.1 million discharges or about 5 percent of all discharges in 2008. During the 11-year period between 1997 and 2008, the number of hospitalizations covered by Medicaid increased by 30 percent (from 5,644,000 in 1997 to 7,355,000 in 2008), the number covered by private insurance increased by 5 percent (from 13,388,000 in 1997 to 14,108,000 in 2008), and the number of uninsured stays increased by 27 percent (from 1,676,000 in 1997 to 2,126,000 in 2008) (figure 1). Overall, the U.S. population increased 12 percent during this same time period5 and Medicaid enrollment increased 40 percent.6
|
Figure 1. The number of stays covered by Medicaid increased by 30 percent, 1997–2008.
Trend line; Number of discharges in millions, in 1997, among those with private insurance, was 13.4; and in 2008, 14.1. Overall privately insured stays increased by 5%. Number of discharges in millions, in 1997, among those with Medicaid only, was 5.6; and in 2008, 7.4. Overall Medicaid stays increased by 30%. Number of discharges in millions, in 1997, among the uninsured, was 1.7; and in 2008, 2.1. Overall uninsured stays increased by 27%. Source: AHRQ, Center for Delivery, Organization, and Markets, Healthcare Cost and Utilization Project, Nationwide Inpatient Sample, 1993-2008 |
Characteristics of hospitalized Medicaid patients compared to privately insured and uninsured patients, 2008 As shown in table 1, the average Medicaid hospital patient in 2008 was younger than privately insured and uninsured patients (24.6 years versus 37.1 years and 36.2 years). Over a quarter of all Medicaid hospitalizations were for newborns (27.5 percent) and almost 10 percent were for children ages 1–17. Thus, 37.3 percent of all Medicaid hospital stays were for patients under 18 years. In contrast, patients under 18 accounted for 22.0 percent of privately insured hospital stays and 14.9 percent of uninsured patients. Adults 18–44 years old accounted for the greatest share of Medicaid hospitalizations (41.4 percent) while 45–64 year olds accounted for only 18.6 percent of Medicaid stays. Among the privately insured, 34.6 percent of patients were 18–44 years old and 34.6 percent were 45–64 years old. Among the uninsured, 18–44 year olds made up the largest share of patients (47.1 percent). Hospital stays covered by Medicaid were more typically for females (64.6 percent) than males, as were privately insured stays (60.0 percent female). In contrast, stays for the uninsured were divided more equally between males (51.9 percent) and females (48.1 percent). Patients from the poorest communities accounted for 42.1 percent of Medicaid stays and 36.2 percent of uninsured stays, but just 19.3 percent of privately insured stays. Hospitalized Medicaid patients were less likely to reside in a suburban location (16.6 percent of Medicaid stays) than privately insured or uninsured patients (27.2 percent and 21.9 percent, respectively). Characteristics of Medicaid hospitalizations compared to privately insured and uninsured, 2008 Altogether, Medicaid hospitalizations cost $51.1 billion in 2008 (table 2)—14.0 percent of the total cost of hospitalizations in the U.S ($364.9 billion). The aggregate cost of privately insured hospital stays ($117.1 billion) was more than twice that of Medicaid stays. In 2008, the total cost for uninsured hospital stays was $15.5 billion or about 4.2 percent of the total cost of hospitalizations in the U.S. |
| Table 2. Characteristics of hospital stays covered by Medicaid, private insurance and the uninsured, 2008 | |||
| Medicaid | Private Insurance | Uninsured | |
|---|---|---|---|
| Number of discharges (in millions) | 7.4 | 14.1 | 2.1 |
| Average costs (in billions) | $51.1a,b | $117.1a | $15.5b |
| Cost per stay, mean | $6,900a | $8,400a | $7,300 |
| Length of stay, mean (in days) | 4.3a,b | 3.8a | 3.8b |
| In-hospital deaths (percentage) | 0.9a,b | 1.1a | 1.4b |
| Percentage distribution by: | |||
| Discharge status | |||
| Routine (percentage) | 86.9a | 85.1a | 87.1 |
| Another short-term hospital (percentage) | 1.8 | 1.8 | 1.9 |
| Another institution (percentage) | 4.1b | 4.3 | 3.4b |
| Home healthcare (percentage) | 4.9a,b | 7.2a | 2.7b |
| Against medical advice (percentage) | 1.5a,b | 0.5a | 3.4b |
| aMedicaid stays are significantly different from privately insured stays at p < 0.05 bMedicaid stays are significantly different from uninsured stays at p <0.05 Source: AHRQ, Center for Delivery, Organization, and Markets, Healthcare Cost and Utilization Project, Nationwide Inpatient Sample, 2008 | |||
Compared to privately insured hospitalizations, Medicaid hospitalizations typically cost less (average cost per stay of $6,900 versus $8,400), despite having a slightly longer average length of stay (4.3 days versus 3.8 days). There was no significant difference between the costs for Medicaid hospitalizations and uninsured hospital stays; however, Medicaid stays were longer on average than uninsured stays (4.3 days compared to 3.8 days).
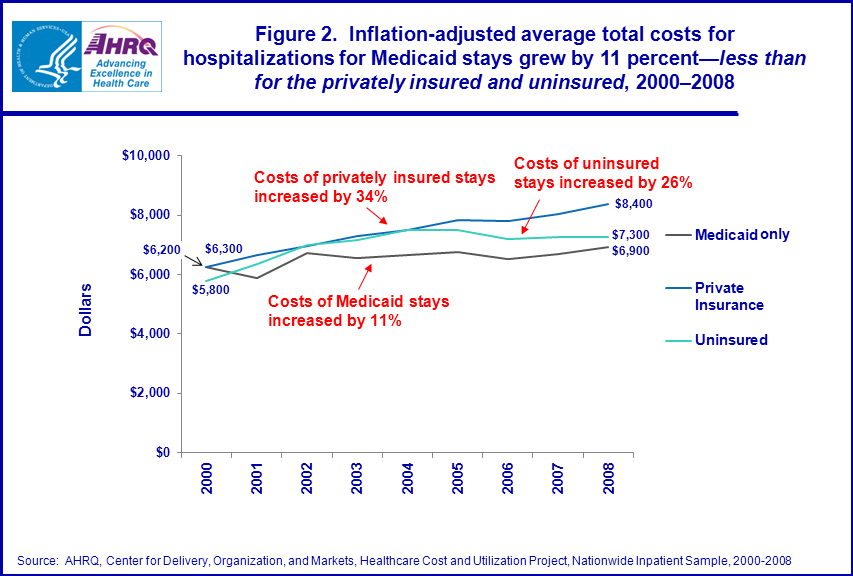
As shown in table 2, discharges against medical advice occurred for 1.5 percent of Medicaid stays, 0.5 percent of privately insured stays, and 3.4 percent of uninsured stays. Figure 2 shows that between 2000 and 2008, the average inflation-adjusted cost of a Medicaid hospital stay increased by 11 percent—from $6,200 to $6,900—less than the increase for privately insured or uninsured costs. During the same period, the average cost of a privately insured stay increased by 34 percent—from $6,300 to $8,400, while hospital costs for the uninsured increased by nearly 26 percent—from $5,800 to $7,300. |
Figure 2. Inflation-adjusted average total costs for hospitalizations for Medicaid stays grew by 11 percent—less than for the privately insured and uninsured, 2000–2008. Trend line; Dollar amount, in 1997, among those with private insurance, was $6,300; and in 2008, $8,400. Overall, the costs of privately insured stays increased by 34%. Dollar amount, in 1997, among those with Medicaid only, was $6,200; and in 2008, $6,900. Overall the costs of Medicaid stays increased by 11%. Dollar amount, in 1997, among the uninsured, was $5,800; and in 2008, $6,900. Overall the costs of uninsured stays increased by 26%. Source: AHRQ, Center for Delivery, Organization, and Markets, Healthcare Cost and Utilization Project, Nationwide Inpatient Sample, 2000-2008 |
Most common reasons for Medicaid hospitalizations, 2008
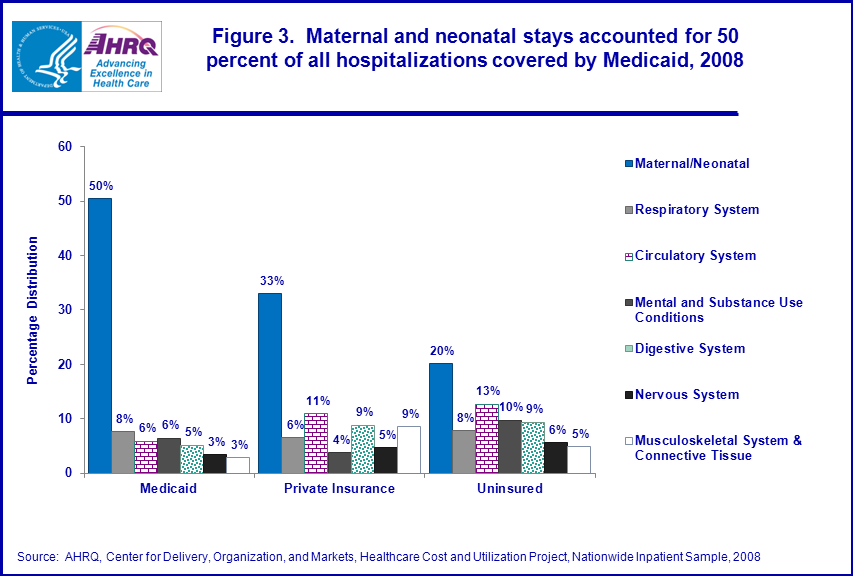
Figure 3 illustrates the most common reasons for hospital stays by body system. Half of all stays with Medicaid as the expected primary payer were for maternal or neonatal conditions. In comparison, these conditions accounted for 33 percent of privately insured hospitalizations and 20 percent of uninsured hospitalizations. Table 3 shows that five of the top ten most common specific diagnoses for Medicaid hospitalizations were related to pregnancy, childbirth, or newborns. These five principal diagnoses accounted for 34 percent of Medicaid hospitalizations. For privately insured patients, these conditions accounted for 22 percent of all hospitalizations and for the uninsured, they accounted for 15 percent of all stays and many ranked very low. For example, prolonged pregnancy ranked as the 7th most common condition among Medicaid-covered inpatients, but ranked 23rd for the privately insured and 47th among the uninsured. Two mental health conditions—mood disorders (210,000 Medicaid stays) and schizophrenia and other psychotic disorders (112,000 Medicaid stays)—ranked among the top ten most frequent reasons for Medicaid hospitalizations. While mood disorders was also a common reason for privately insured and uninsured stays (291,000 privately insured stays and 79,000 uninsured stays), schizophrenia was not (51,000 stays, ranked 62nd for privately insured and 20,000 stays, ranked 26th for uninsured). Alcohol and substance use conditions were common diagnoses for the uninsured (ranked 5th and 8th), but were the 31st and 21st most common reasons for hospital stays billed to Medicaid. |
Figure 3. Maternal and neonatal stays accounted for 50 percent of all hospitalizations covered by Medicaid, 2008. Bar chart; Percentage distribution of Medicaid; 50% maternal/neonatal; 8% respiratory system; 6% circulatory system; 6% mental and substance use conditions; 5% digestive system; 3% nervous system; 3% musculoskeletal system and connective tissue. Percentage distribution of private insurance; 33% maternal/neonatal; 6% respiratory system; 11% circulatory system; 4% mental and substance use conditions; 9% digestive system; 5% nervous system; 9% musculoskeletal system and connective tissue. Percentage distribution of uninsured; 20% maternal/neonatal; 8% respiratory system; 13% circulatory system; 10% mental and substance use conditions; 9% digestive system; 6% nervous system; 5% musculoskeletal system and connective tissue. Source: AHRQ, Center for Delivery, Organization, and Markets, Healthcare Cost and Utilization Project, Nationwide Inpatient Sample, 2008
|
Pneumonia was the 5th most common reason for a Medicaid-covered stay and was also a top ten condition among the privately insured (ranked 9th) and the uninsured (ranked 7th). Asthma was a top ten condition for Medicaid-covered stays (ranked 8th) but stays for this condition were less common for the privately insured (ranked 24th) and the uninsured (ranked 14th).
Skin and subcutaneous tissue infection was a top ten diagnosis for Medicaid (106,000 discharges, ranked 10th) and uninsured stays (67,000 stays, ranked 4th); it ranked 12th among privately insured stays (195,000 stays). Most common procedures performed during Medicaid hospitalizations, 2008 In 2008, seven of the ten most common procedures performed during Medicaid hospitalizations were related to pregnancy, childbirth, or newborns (table 4: C-section, repair of current obstetric laceration, circumcision, artificial rupture of membranes to assist delivery, fetal monitoring, treatment and ligation of fallopian tubes, and episiotomy). The first five of these were also among the ten most common procedures performed during privately insured hospitalizations. Three of the seven—C-section, repair of current obstetric laceration, and circumcision—were also among the top ten procedures for the uninsured. Blood transfusions, respiratory intubation, and upper gastrointestinal (UGI) endoscopy were also among the top ten most frequently performed procedures for Medicaid, privately insured, and uninsured hospital stays. |
| Table 3. Number of discharges, percentage distribution, and rank of the top ten most frequent principal diagnoses for inpatient hospital stays covered by Medicaid, private insurance, and the uninsured, 2008 | ||||||
| PRINCIPAL CCS DIAGNOSIS | NUMBER OF DISCHARGES IN THOUSANDS Percentage of discharges by payer |
RANK | ||||
|---|---|---|---|---|---|---|
| Medicaid | Private insurance | Uninsured | Medicaid | Private insurance | Uninsured | |
| All discharges | 7,355 100% |
14,108 100% |
2,126 100% |
|||
| Liveborn | 1,722 23% |
2,169 15% |
240 11% |
1 | 1 | 1 |
| Trauma to perineum and vulva | 288 4% |
476 3% |
28 1% |
2 | 2 | 17 |
| Previous C-section | 214 3% |
282 2% |
19 1% |
3 | 7 | 28 |
| Mood disorders | 210 3% |
291 2% |
79 4% |
4 | 6 | 2 |
| Pneumonia | 157 2% |
257 2% |
47 2% |
5 | 9 | 7 |
| Normal pregnancy and/or delivery | 138 2% |
119 1% |
13 1% |
6 | 27 | 42 |
| Prolonged pregnancy | 116 2% |
127 1% |
11 1% |
7 | 23 | 47 |
| Asthma | 115 2% |
126 1% |
32 1% |
8 | 24 | 14 |
| Schizophrenia and other psychotic disorders | 112 2% |
51 0% |
20 1% |
9 | 62 | 26 |
| Skin and subcutaneous tissue infections | 106 1% |
195 1% |
67 3% |
10 | 12 | 4 |
| Osteoarthritis | 23 0% |
358 3% |
6 0% |
53 | 3 | 77 |
| Spondylosis, intervertebral disc disorders, other back problems | 36 0% |
305 2% |
15 1% |
40 | 4 | 35 |
| Coronary atherosclerosis | 58 1% |
302 2% |
36 2% |
27 | 5 | 12 |
| Nonspecific chest pain | 86 1% |
257 2% |
68 3% |
16 | 8 | 3 |
| Cardiac dysrhythmias | 34 0% |
208 1% |
23 1% |
43 | 10 | 22 |
| Alcohol-related disorders | 54 1% |
86 1% |
61 3% |
31 | 41 | 5 |
| Diabetes mellitus with complications | 95 1% |
132 1% |
52 2% |
12 | 20 | 6 |
| Substance-related disorders | 70 1% |
60 0% |
43 2% |
21 | 55 | 8 |
| Biliary tract disease | 57 1% |
195 1% |
42 2% |
28 | 13 | 9 |
| Acute myocardial infarction | 35 0% |
187 1% |
40 2% |
41 | 16 | 10 |
| Source: AHRQ, Center for Delivery, Organization, and Markets, Healthcare Cost and Utilization Project, Nationwide Inpatient Sample, 2008 | ||||||
| Table 4. Number of discharges, percent distribution, and rank of the top ten most frequent all-listed procedures for inpatient hospital stays covered by Medicaid, private insurance, and the uninsured, 2008 | ||||||
| PRINCIPAL CCS DIAGNOSIS | NUMBER OF DISCHARGES IN THOUSANDS Percentage of discharges by payer |
RANK | ||||
|---|---|---|---|---|---|---|
| Medicaid | Private insurance | Uninsured | Medicaid | Private insurance | Uninsured | |
| All discharges | 7,355 100% |
14,108 100% |
2,126 100% |
|||
| Cesarean section | 527 7% |
762 5% |
42 2% |
1 | 2 | 8 |
| Repair of current obstetric laceration | 481 7% |
794 6% |
48 2% |
2 | 1 | 7 |
| Circumcision | 400 5% |
738 5% |
49 2% |
3 | 3 | 6 |
| Artificial rupture of membranes to assist delivery | 386 5% |
543 4% |
33 2% |
4 | 5 | 13 |
| Fetal monitoring | 385 5% |
506 4% |
32 1% |
5 | 7 | 15 |
| Blood transfusion | 286 4% |
666 5% |
97 5% |
6 | 4 | 1 |
| Respiratory intubation and mechanical ventilation | 241 3% |
366 3% |
75 4% |
7 | 8 | 4 |
| Ligation of fallopian tubes | 147 2% |
140 1% |
* * |
8 | 27 | 38 |
| Upper gastrointestinal endoscopy, biopsy | 126 2% |
336 2% |
68 3% |
9 | 10 | 5 |
| Episiotomy | 120 2% |
207 1% |
12 1% |
10 | 18 | 35 |
| Diagnostic cardiac catheterization, coronary arteriography | 106 1% |
518 4% |
85 4% |
13 | 6 | 2 |
| Hysterectomy, abdominal and vaginal | 46 1% |
365 3% |
17 1% |
26 | 9 | 23 |
| Alcohol and drug rehabilitation/detoxification | 97 1% |
121 1% |
76 4% |
14 | 32 | 3 |
| Appendectomy | 54 1% |
227 2% |
40 2% |
21 | 16 | 9 |
| Percutaneous coronary angioplasty (PTCA) | 42 1% |
274 2% |
40 2% |
31 | 11 | 10 |
| Source: AHRQ, Center for Delivery, Organization, and Markets, Healthcare Cost and Utilization Project, Nationwide Inpatient Sample, 2008 | ||||||
Data Source The estimates in this Statistical Brief are based upon data from the HCUP Nationwide Inpatient Sample, 1997–2008. Definitions Payer Payer is the expected primary payer for the hospital stay. To make coding uniform across all HCUP data sources, payer combines detailed categories into more general groups:
Diagnoses, Procedures, ICD-9-CM, and Clinical Classifications Software (CCS) The principal diagnosis is that condition established after study to be chiefly responsible for the patient’s admission to the hospital. Secondary diagnoses are concomitant conditions that coexist at the time of admission or that develop during the stay. The principal procedure is the procedure that was performed for definitive treatment rather than one performed for diagnostic or exploratory purposes (i.e., the procedure that was necessary to take care of a complication). If two procedures appear to meet this definition, the procedure most related to the principal diagnosis was selected as the principal procedure. All-listed procedures include all procedures performed during the hospital stay. ICD-9-CM is the International Classification of Diseases, Ninth Revision, Clinical Modification, which assigns numeric codes to diagnoses. There are about 12,000 ICD-9-CM diagnosis codes. Clinical Classifications Software (CCS) is a tool that categorizes ICD-9-CM diagnoses and procedures into clinically meaningful categories.7 This "clinical grouper" makes it easier to quickly understand patterns of diagnoses and procedures. Major Diagnosis Categories (MDCs) are broad groups of DRGs (Diagnosis Related Groups) that relate to an organ or a system (digestive system, for example) and not to an etiology. For example, MDC 01 - Diseases and Disorders of the Nervous System, MDC 02 - Diseases and Disorders of the Eye, MDC 03 - Diseases and Disorders of the Ear, Nose, Mouth and Throat. Each hospital stay has one DRG and one MDC assigned to it. Types of hospitals included in HCUP HCUP is based on data from community hospitals, defined as short-term, non-Federal, general and other hospitals, excluding hospital units of other institutions (e.g., prisons). HCUP data include OB-GYN, ENT, orthopedic, cancer, pediatric, public, and academic medical hospitals. They exclude long-term care, rehabilitation, psychiatric, and alcoholism and chemical dependency hospitals, but these types of discharges are included if they are from community hospitals. Unit of analysis The unit of analysis is the hospital discharge (i.e., the hospital stay), not a person or patient. This means that a person who is admitted to the hospital multiple times in one year will be counted each time as a separate "discharge" from the hospital. Costs and charges Total hospital charges were converted to costs using HCUP Cost-to-Charge Ratios based on hospital accounting reports from the Centers for Medicare and Medicaid Services (CMS).8 Costs will tend to reflect the actual costs of production, while charges represent what the hospital billed for the case. For each hospital, a hospital-wide cost-to-charge ratio is used because detailed charges are not available across all HCUP States. Hospital charges reflect the amount the hospital charged for the entire hospital stay and does not include professional (physician) fees. For the purposes of this Statistical Brief, costs are reported to the nearest hundreds. Median income of the patient’s ZIP Code Median community-level income is the median household income of the patient's ZIP Code of residence. The cut-offs for the quartile designation are determined using ZIP Code demographic data obtained from Claritas. The income quartile value is missing for homeless and foreign patients. In 2008, the lowest income quartile ranged from $1–$38,999, while the highest income quartile was defined as $64,000 or above. Patients in the lowest quartile were classified as living in the poorest communities; all others were classified as living in "relatively wealthier" or "other communities." Discharge status Discharge status indicates the disposition of the patient at discharge from the hospital, and includes the following six categories: routine (to home), transfer to another short-term hospital, other transfers (including skilled nursing facility, intermediate care, and another type of facility such as a nursing home), home healthcare, against medical advice (AMA), or died in the hospital. Location of patient's residence Based on an urban-rural designation of the patient's county of residence. The categorization is a simplified adaptation of the 2006 version of a system developed by the National Center for Health Statistics (NCHS) especially for use in healthcare research:
HCUP is a family of powerful healthcare databases, software tools, and products for advancing research. Sponsored by the Agency for Healthcare Research and Quality (AHRQ), HCUP includes the largest all-payer encounter-level collection of longitudinal healthcare data (inpatient, ambulatory surgery, and emergency department) in the United States, beginning in 1988. HCUP is a Federal-State-Industry Partnership that brings together the data collection efforts of many organizations—such as State data organizations, hospital associations, private data organizations, and the Federal government—to create a national information resource. HCUP would not be possible without the contributions of the following data collection Partners from across the United States: Arizona Department of Health Services Arkansas Department of Health California Office of Statewide Health Planning and Development Colorado Hospital Association Connecticut Hospital Association Florida Agency for Health Care Administration Georgia Hospital Association Hawaii Health Information Corporation Illinois Department of Public Health Indiana Hospital Association Iowa Hospital Association Kansas Hospital Association Kentucky Cabinet for Health and Family Services Louisiana Department of Health and Hospitals Maine Health Data Organization Maryland Health Services Cost Review Commission Massachusetts Division of Health Care Finance and Policy Michigan Health & Hospital Association Minnesota Hospital Association Missouri Hospital Industry Data Institute Montana MHA — An Association of Montana Health Care Providers Nebraska Hospital Association Nevada Department of Health and Human Services New Hampshire Department of Health & Human Services New Jersey Department of Health and Senior Services New Mexico Health Policy Commission New York State Department of Health North Carolina Department of Health and Human Services Ohio Hospital Association Oklahoma State Department of Health Oregon Association of Hospitals and Health Systems Pennsylvania Health Care Cost Containment Council Rhode Island Department of Health South Carolina State Budget & Control Board South Dakota Association of Healthcare Organizations Tennessee Hospital Association Texas Department of State Health Services Utah Department of Health Vermont Association of Hospitals and Health Systems Virginia Health Information Washington State Department of Health West Virginia Health Care Authority Wisconsin Department of Health Services Wyoming Hospital Association About the NIS The HCUP Nationwide Inpatient Sample (NIS) is a nationwide database of hospital inpatient stays. The NIS is nationally representative of all community hospitals (i.e., short-term, non-Federal, non-rehabilitation hospitals). The NIS is a sample of hospitals and includes all patients from each hospital, regardless of payer. It is drawn from a sampling frame that contains hospitals comprising about 95 percent of all discharges in the United States. The vast size of the NIS allows the study of topics at both the national and regional levels for specific subgroups of patients. In addition, NIS data are standardized across years to facilitate ease of use. For More Information For more information about HCUP, visit http://www.hcup-us.ahrq.gov. For additional HCUP statistics, visit HCUPnet, our interactive query system, at www.hcup.ahrq.gov. For information on other hospitalizations in the U.S., download HCUP Facts and Figures: Statistics on Hospital-based Care in the United States in 2008, located at http://www.hcup-us.ahrq.gov/reports.jsp. For a detailed description of HCUP, more information on the design of the NIS, and methods to calculate estimates, please refer to the following publications: Steiner, C., Elixhauser, A., Schnaier, J. The Healthcare Cost and Utilization Project: An Overview. Effective Clinical Practice 5(3):143–51, 2002. Introduction to the HCUP Nationwide Inpatient Sample, 2008. Online. May 2010. U.S. Agency for Healthcare Research and Quality. http://hcup-us.ahrq.gov/db/nation/nis/NIS_2008_INTRODUCTION.pdf. Houchens, R., Elixhauser, A. Final Report on Calculating Nationwide Inpatient Sample (NIS) Variances, 2001. HCUP Methods Series Report #2003-2. Online. June 2005 (revised June 6, 2005). U.S. Agency for Healthcare Research and Quality. http://www.hcup-us.ahrq.gov/reports/methods/2003_02.pdf. Suggested Citation Stranges, E. (Thomson Reuters), Ryan, K. (Thomson Reuters), and Elixhauser, A. (AHRQ). Medicaid Hospitalizations, 2008. HCUP Statistical Brief #104. January 2011. Agency for Healthcare Research and Quality, Rockville, MD. http://www.hcup-us.ahrq.gov/reports/statbriefs/sb104.pdf. *** AHRQ welcomes questions and comments from readers of this publication who are interested in obtaining more information about access, cost, use, financing, and quality of healthcare in the United States. We also invite you to tell us how you are using this Statistical Brief and other HCUP data and tools, and to share suggestions on how HCUP products might be enhanced to further meet your needs. Please e-mail us at hcup@ahrq.gov or send a letter to the address below:Irene Fraser, Ph.D., Director Center for Delivery, Organization, and Markets Agency for Healthcare Research and Quality 540 Gaither Road Rockville, MD 20850 1 The Kaiser Family Foundation. Statehealthfacts.org retrieved from: http://www.statehealthfacts.org/ 2 Center for Medicare and Medicaid Services. Medicaid Program-General Information retrieved from: http://www.medicaid.gov/ (accessed January 4, 2011) 3 Kaiser Commission on Medicaid and the Uninsured. Medicaid Coverage and Spending under Health Reform: National and State-by-State Results for Adults at or Below 133% FPL. Retrieved from: www.kff.org/wp-content/uploads/2013/01/medicaid-coverage-and-spending-in-health-reform-national-and-state-by-state-results-for-adults-at-or-below-133-fpl-executive-summary.pdf 4 Patients covered by both Medicare and Medicaid will tend to have the primary payer listed as "Medicare" and thus are less likely to be included in this report. 5 Calculated using population from the U.S. Bureau of the Census. Retrieved from: http://www.census.gov/popest/ (January 4, 2011) 6 Ellis ER, Roberts D, Rousseau DM, Schwartz T. Medicaid Enrollment in 50 States: June 2008 Data Update. The Kaiser Commission on Medicaid and the Uninsured. September 2009. http://kff.org/health-reform/report/report-and-briefing-on-medicaid-coverage-and/ 7 HCUP CCS. Healthcare Cost and Utilization Project (HCUP). May 2008. U.S. Agency for Healthcare Research and Quality, Rockville, MD. www.hcup-us.ahrq.gov/toolssoftware/ccs/ccs.jsp 8 HCUP Cost-to-Charge Ratio Files (CCR). Healthcare Cost and Utilization Project (HCUP). 2001–2007. U.S. Agency for Healthcare Research and Quality, Rockville, MD. www.hcup-us.ahrq.gov/db/state/costtocharge.jsp. |
| Internet Citation: Statistical Brief #104. Healthcare Cost and Utilization Project (HCUP). May 2016. Agency for Healthcare Research and Quality, Rockville, MD. hcup-us.ahrq.gov/reports/statbriefs/sb104.jsp. |
| Are you having problems viewing or printing pages on this website? |
| If you have comments, suggestions, and/or questions, please contact hcup@ahrq.gov. |
| If you are experiencing issues related to Section 508 accessibility of information on this website, please contact hcup@ahrq.gov. |
| Privacy Notice, Viewers & Players |
| Last modified 5/18/16 |