STATISTICAL BRIEF #103
|
|
December 2010
Lauren Wier, M.P.H., Anne Pfuntner, B.U.E.P., and Claudia Steiner, M.D., M.P.H.
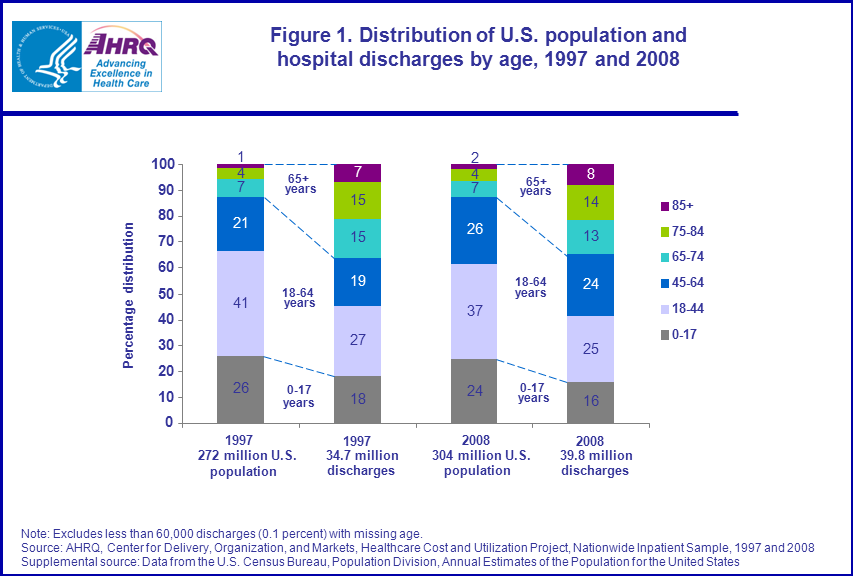
Introduction Between 2010 and 2030, the U.S. population age 65 and older is projected to grow by 79 percent from 40 million to 72 million, while the total U.S. population will grow by 20 percent.1 By 2030, about one in five Americans will be over 65, up from one in eight Americans in 2010. Among the elderly, the population 75 and older will increase by 77 percent between 2010 and 2030, accounting for nearly half of the growth in the elderly population. The growth of the elderly population has many implications for the U.S. healthcare system, including a higher demand for health services contributing to ever increasing healthcare costs. Adults 65 and older accounted for about 34 percent of personal healthcare spending in 2004,2 even though they comprised only 12 percent of the population.1 Health care costs for patients over 65 are three to five times higher than costs for patients under 65. As the elderly population grows, these higher costs are projected to result in a 25 percent increase in the United States’ healthcare spending by 2030.3 This growth has implications for spending through federal programs, such as Medicare, which accounted for $444 billion, or 23 percent of healthcare spending in 20084 and 13 percent of the U.S. federal budget.5 This Statistical Brief presents data from the Healthcare Cost and Utilization Project (HCUP) comparing patient characteristics and hospital utilization among the oldest adults, ages 75–84 and 85 plus, to those adults ages 65–74. In addition, this report examines the diagnoses most often associated with elderly hospitalizations and the procedures that are performed most frequently during these stays. All differences between estimates noted in the text are statistically significant at the 0.05 level or better. Findings In 2008, there were more than 14 million hospital stays among adults ages 65 years and older. These hospitalizations accounted for more than one-third of all U.S. community hospital stays and about 14 percent ($157.7 billion) of total hospital costs. Figure 1 shows the distribution of the U.S. population and hospital discharges by age in 1997 and 2008. In both years, adults 65 and older made up a larger share of hospital discharges (37 and 35 percent, respectively) relative to their population size (12 and 13 percent, respectively). This pattern was more pronounced with increasing age: in 2008, adults 85 and older accounted for only 1.8 percent of the population but 8.0 percent of all discharges—over four times higher. Adults 75–84 years old comprised 4.3 percent of the population but accounted for triple the proportion of all discharges (13.8 percent). In contrast, 65–74 year olds comprised 6.6 percent of the total population but accounted for twice the proportion of all discharges (13.2 percent). |
|
|
Figure 1. Distribution of U.S. population and hospital discharges by age, 1997 and 2008.
Stacked bar chart; Percentage distribution; 1997; 272 million U.S. population; ages 0 to 17, 26%; ages 18 to 44, 41%; ages 45 to 64; 21%; ages 65 to 74; 7%; ages 75 to 84; 4%; age 85 plus; 1%; Percentage distribution; 1997; 34.7 million discharges; ages 0 to 17, 18%; ages 18 to 44, 27%; ages 45 to 64; 19%; ages 65 to 74; 15%; ages 75 to 84; 15%; age 85 plus; 7%; Percentage distribution; 2008; 304 million U.S. population; ages 0 to 17, 24%; ages 18 to 44, 37%; ages 45 to 64; 26%; ages 65 to 74; 7%; ages 75 to 84; 4%; age 85 plus; 2%; Percentage distribution; 2008; 39.8 million discharges; ages 0 to 17, 16%; ages 18 to 44, 25%; ages 45 to 64; 24%; ages 65 to 74; 13%; ages 75 to 84; 14%; age 85 plus; 8%; Note: Excludes less than 60,000 discharges (0.1 percent) with missing age. Source: AHRQ, Center for Delivery, Organization, and Markets, Healthcare Cost and Utilization Project, Nationwide Inpatient Sample, 1997 and 2008. Supplemental source: Data from the U.S. Census Bureau, Population Division, Annual Estimates of the Population for the United States.
|
Characteristics of hospital stays among the older elderly Table 1 compares hospital utilization and patient characteristics of the oldest adults 75–84 and 85+ to patients age 65–74, in 2008. Adults 85+ accounted for a relatively small share of hospital discharges (8 percent overall), but were more than twice as likely to be hospitalized as 65–74 year olds (577 versus 264 stays per 1,000 population). Adults 75–84 years old had a 1.5 times higher rate of hospitalization relative to 65–74 year olds (418 versus 264 stays per 1,000 population, respectively). Stays for patients 75–84 and 85+ were slightly longer (5.6 days) than for 65–74 year olds (5.3 days). The average cost per stay for adults 85+ was about $3,000 less than the average cost of a stay for 65–74 year olds ($9,400 versus $12,400, respectively). |
| Table 1. Characteristics of hospital stays among patients ages 75–84 and 85+ compared to patients ages 65–74, 2008 | |||
| 65–74 years | 75–84 years | 85+ years | |
|---|---|---|---|
| Total number of discharges | 5,271,200 | 5,489,500‡ | 3,195,600 |
| Percentage of all discharges in U.S. community hospitals | 13.2% | 13.8% | 8.0% |
| Rate of hospitalization per 1,000 population* | 264.0 | 418.2 | 576.7 |
| Utilization characteristics | |||
| Mean length of stay, days | 5.3 | 5.6 | 5.6 |
| Mean hospital costs | $12,400 | $11,400 | $9,400 |
| Aggregate national costs, billions | $65.2 | $62.3‡ | $30.2 |
| Percentage of aggregate costs | 17.9% | 17.1% | 8.3% |
| Percentage of elective admissions | 28.5% | 21.0% | 12.5% |
| Patient characteristics | |||
| Sex (rate per 1,000 population*) | |||
| Male | 277.9 | 442.7 | 615.1 |
| Female | 252.1 | 401.0 | 558.7 |
| Community-level income (rate per 1,000 population*) | |||
| Quartile 1 (poorest) | 297.7 | 416.1 | 529.8 |
| Quartile 2 | 267.6 | 407.7 | 544.0 |
| Quartile 3 | 243.8 | 398.0 | 558.5 |
| Quartile 4 (wealthiest) | 221.9 | 424.3 | 665.5 |
| Patient residence (rate per 1,000 population*) | |||
| Large urban core | 259.0 | 431.4 | 610.5 |
| Large urban fringe (suburbs) | 230.0 | 350.4 | 470.2 |
| Small urban | 300.9 | 440.2 | 573.5 |
| Non-urban | 274.8 | 404.4 | 542.9 |
| Region (rate per 1,000 population*) | |||
| Northeast | 255.4 | 428.2 | 619.3 |
| Midwest | 284.7 | 457.5 | 608.6 |
| South | 283.8 | 431.3 | 579.1 |
| West | 215.6 | 342.7 | 491.3 |
| ‡ Values are not statistically different from values for 65–74 age group at p<0.05. * Denominator data for rates were based on Claritas Population Estimates, 2008. Source: AHRQ, Center for Delivery, Organization, and Markets, Healthcare Cost and Utilization Project, Nationwide Inpatient Sample, 2008 | |||
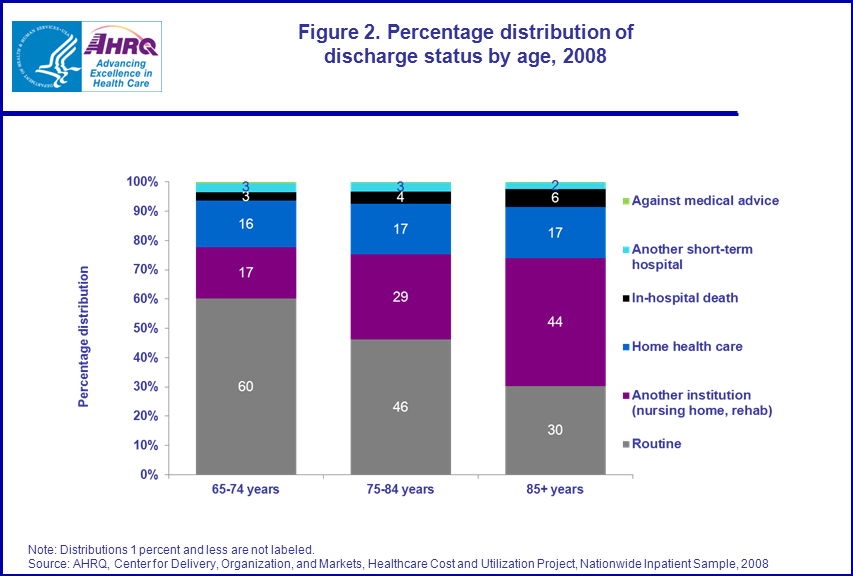
Across all three age groups, the rate of hospitalization was about 10 percent higher for males than females. Hospitalization rates for both sexes increased with age. Among patients 75–84 and 85 and older, hospitalization rates were higher in the wealthiest communities (424 and 666 stays per 1,000 population, respectively). Across all three age groups, hospitalization rates were lower in the suburbs and in the western region of the U.S. As age increased, the percentage of routine discharges decreased and discharges to long term care (e.g., nursing homes and rehab) increased (figure 2). Indeed, patients 85 and older were about 2.5 times more likely and patients 75–84 were about 1.7 times more likely to be discharged to long-term care than 65–74 year olds. In-hospital mortality was higher among patients 85 and older (6.2 percent) and 75–84 years old (4.2 percent) compared to stays for 65–74 year olds (2.9 percent). |
|
Figure 2. Percentage distribution of discharge status by age, 2008. Stacked bar chart;
Percentage distribution; ages 65 to 74 years, routine, 60%; another institution (nursing home, rehab), 17%; Home healthcare, 16%; In-hospital death, 3%; another short-term hospital, 3%; against medical advice, 1%; Percentage distribution; ages 75 to 84 years, routine, 46%; another institution (nursing home, rehab), 29%; Home healthcare, 17%; In-hospital death, 4%; another short-term hospital, 3%; against medical advice, 0%; Percentage distribution; age 85 plus years, routine, 30%; another institution (nursing home, rehab), 44%; Home healthcare, 17%; In-hospital death, 6%; another short-term hospital, 2%; against medical advice, 0%; Note: Distributions 1 percent and less are not labeled. Source: AHRQ, Center for Delivery, Organization, and Markets, Healthcare Cost and Utilization Project, Nationwide Inpatient Sample, 2008
|
Most frequent reasons for hospital stays
Table 2 highlights the 20 most frequent health conditions for which patients 75–84 and 85+ were hospitalized compared with 65–74 year olds. |
| Table 2. Most common principal diagnoses among hospitalized patients ages 75–84 and 85+ years, 2008 | |||||
| 75–84 years | 85+ years | ||||
|---|---|---|---|---|---|
| Top 20 principal diagnoses, CCS category | Rate per 1,000 population* | Relative rate** | Top 20 principal diagnoses, CCS category | Rate per 1,000 population* | Relative rate** |
| Congestive heart failure | 23.2 | 2.2 | Congestive heart failure | 44.4 | 4.3 |
| Pneumonia | 19.7 | 2.1 | Pneumonia | 35.9 | 3.8 |
| Irregular heart beat (cardiac dysrhythmias) | 17.3 | 1.8 | Blood infection (septicemia) | 26.8 | 3.4 |
| Blood infection (septicemia) | 15.5 | 2.0 | Urinary tract infections | 24.3 | 6.0 |
| Osteoarthritis | 14.7‡ | 1.0 | Irregular heart beat (cardiac dysrhythmias) | 22.6 | 2.4 |
| Chronic obstructive pulmonary disease and bronchiectasis | 14.6 | 1.4 | Fracture of hip | 22.4 | 10.2 |
| Coronary atherosclerosis and other heart disease | 14.3‡ | 1.1 | Stroke (acute cerebrovascular disease) | 19.3 | 3.4 |
| Stroke (acute cerebrovascular disease) | 11.7 | 2.0 | Heart attack (acute myocardial infarction) | 16.8 | 2.4 |
| Urinary tract infections | 11.0 | 2.7 | Fluid and electrolyte disorders | 15.5 | 3.9 |
| Heart attack (acute myocardial infarction) | 10.9 | 1.6 | Acute and unspecified renal failure | 15.0 | 3.4 |
| Rehabilitation care, fitting of prostheses, and adjustment of devices | 9.4 | 2.0 | Chronic obstructive pulmonary disease and bronchiectasis | 13.6 | 1.3 |
| Complication of device; implant or graft | 9.2 | 1.3 | Aspiration pneumonia | 12.4 | 8.9 |
| Acute and unspecified renal failure | 8.7 | 2.0 | Rehabilitation care, fitting of prostheses, and adjustment of devices | 12.2 | 2.6 |
| Fracture of hip | 8.3 | 3.8 | Gastrointestinal hemorrhage | 11.7 | 3.3 |
| Fluid and electrolyte disorders | 8.3 | 2.1 | Syncope | 9.4 | 3.8 |
| Respiratory failure | 7.7 | 1.4 | Respiratory failure | 9.2 | 1.7 |
| Nonspecific chest pain | 7.2 | 1.2 | Coronary atherosclerosis and other heart disease | 8.3 | 0.6 |
| Gastrointestinal hemorrhage | 7.0 | 2.0 | Delirium, dimentia, and amnestic and other cognitive disorders | 8.1 | 7.2 |
| Back problems (disorders of intervertebral discs and bones in spinal column) | 6.2‡ | 1.0 | Intestinal obstruction without hernia | 8.1 | 2.5 |
| Complications of surgical procedures or medical care | 5.7 | 1.2 | Skin and subcutaneous tissue infections | 8.0 | 2.3 |
| * Denominator data for rates were based on Claritas Population Estimates, 2008. ** Relative to 65–74 age group. Source: AHRQ, Center for Delivery, Organization, and Markets, Healthcare Cost and Utilization Project, Nationwide Inpatient Sample, 2008 | |||||
Congestive heart failure (CHF) was the most common reason for hospitalization among 75–84 year olds (23.2 stays per 1,000 population) and those 85+ (44.4 stays per 1,000 population); these rates of hospitalization were more than double and quadruple the rate of patients 65–74 years old. Of the top 20 diagnoses among patients 75–84 years old, six were cardiovascular conditions: CHF, cardiac dysrhythmias, coronary atherosclerosis, acute cerebrovascular disease, acute myocardial infarction, and nonspecific chest pain. Together these conditions accounted for nearly 100 stays for every 1,000 adults 75–84 years old. Infections were also common reasons for hospitalization. Pneumonia was the second most common reason for hospitalization among the 75–84 year olds and those over 85, accounting for 19.7 and 35.9 stays per 1,000 population, respectively. Again, these rates were two and four times higher than for patients 65–74 years old. Among 75–84 year olds, blood infection occurred in 15.5 stays per 1,000 population, which was twice the hospitalization rate for 65–74 year olds. For those 85+, the rate of hospitalization was nearly 3.5 times higher than among those 65–74 years old. Hospitalization for hip fracture was one of the top ten conditions for the 85+ year olds. The hospitalization rate for hip fractures was ten times higher for those 85 and older (22.4 stays per 1,000 population) than for 65–74 year olds. Among patients 85+, delirium and dementia occurred in 8.1 stays per 1,000 population, which was more than seven times the hospitalization rate for 65–74 year olds. Most frequent procedures performed during hospital stays Table 3 shows the most frequent procedures performed during hospitalization among 75–84 year olds and patients 85 and older compared to the rates for these procedures with patients age 65–74. |
| Table 3. Most common all-listed procedures among hospitalized patients ages 75–84 and 85+ years, 2008 | |||||
| 75–84 years | 85+ years | ||||
|---|---|---|---|---|---|
| Top 20 all-listed procedures, CCS category | Rate per 1,000 population* | Relative rate** | Top 20 all-listed procedures, CCS category | Rate per 1,000 population* | Relative rate** |
| Blood transfusion | 49.1 | 1.7 | Blood transfusion | 67.3 | 2.4 |
| Diagnostic cardiac catheterization, coronary arteriography | 22.6 | 1.2 | Upper GI endoscopy | 25.8 | 2.2 |
| Upper GI endoscopy | 20.7 | 1.7 | Respiratory intubation and mechanical ventilation | 22.1 | 1.6 |
| Respiratory intubation and mechanical ventilation | 20.0 | 1.5 | Diagnostic cardiac catheterization, coronary arteriography | 17.4 | 1.9 |
| Diagnostic ultrasound of heart (echocardiogram) | 14.5 | 1.6 | Treatment of fracture or dislocation of hip and femur | 16.1 | 7.4 |
| Hemodialysis | 11.3 | 1.2 | Colonoscopy and biopsy | 12.8 | 2.2 |
| Percutaneous transluminal coronary angioplasty (PTCA) | 11.2‡ | 1.1 | Diagnostic bronchoscopy and biopsy of bronchus | 11.9‡ | 0.6 |
| Arthroplasty knee | 10.6‡ | 0.9 | Insertion, revision, replacement, removal of cardiac pacemaker or cardioverter/defibrillator | 11.6 | 2.6 |
| Colonoscopy and biopsy | 10.5 | 1.8 | Hip replacement, total and partial | 11.0 | 2.1 |
| Insertion, revision, replacement, removal of cardiac pacemaker or cardioverter/defibrillator | 9.6 | 2.1 | Incision of lining of lungs (pleura), removal of fluid through a needle, chest drainage | 9.8 | 2.2 |
| Hip replacement, total and partial | 8.5 | 1.6 | Tube feeding (intravenous or intestinal) | 9.8 | 2.2 |
| Incision of lining of lungs (pleura), removal of fluid through a needle, chest drainage | 7.7 | 1.7 | Physical therapy exercises, manipulation, and other procedures | 9.5 | 2.9 |
| Tube feeding (intravenous or intestinal) | 7.2 | 1.6 | CT (CAT) scan of head | 8.8 | 3.7 |
| Treatment of fracture or dislocation of hip and femur | 6.5 | 3.0 | Hemodialysis | 8.1 | 0.9 |
| Physical therapy exercises, manipulation, and other procedures | 6.2 | 1.9 | Indwelling catheter | 7.9 | 3.9 |
| Diagnostic bronchoscopy and biopsy of bronchus | 5.7 | 1.3 | Gastronomy, temporary and permanent | 7.5 | 3.3 |
| Arterio- or venogram (not heart and head) | 5.7 | 1.4 | Percutaneous transluminal coronary angioplasty (PTCA) | 6.0 | 0.6 |
| Colorectal resection | 5.1 | 1.3 | Arterio- or venogram (not heart and head) | 4.9‡ | 1.2 |
| CT (CAT) scan of head | 4.9 | 2.1 | Conversion of cardiac rhythm | 4.6 | 1.5 |
| Contrast aortogram | 4.8 | 1.4 | Colorectal resection | 4.3 | 1.1 |
| * Denominator data for rates were based on Claritas Population Estimates, 2008. ** Relative to 65–74 age group. Source: AHRQ, Center for Delivery, Organization, and Markets, Healthcare Cost and Utilization Project, Nationwide Inpatient Sample, 2008 | |||||
Blood transfusion was, by far, the most common procedure performed on any patient 75–84 and 85+ (49.1 and 67.3 procedures per 1,000 population, respectively). Seven of the top twenty most frequent procedures among 75–84 year olds were diagnostic: cardiac catheterization, upper gastrointestinal endoscopy, echocardiogram, colonoscopy and biopsy, bronchoscopy, arteriogram or venogram, and CT (CAT) scan of head. Relative to 65–74 year olds, the rate of head CT scan was more than twice as high among patients 75–84 and was nearly four times higher among patients 85+. The rate of upper GI endoscopy and colonoscopy was about twice as high among patients 75–84 and 85+, compared to 65–74 year olds. Procedures related to degenerative bone and joint disorders were common among patients 75–84 and 85+. Compared to 65–74 year olds, treatment for fractured or dislocated hip or femur was much more common among patients 75–84 and 85+ (3.0 and 7.4 times higher, respectively). Similarly, hip replacement was more frequently performed on patients 75–84 and 85+. Physical therapy procedures were about two and three times more common among patients 75–84 and 85+, respectively, than among patients 65–74. Data Source The estimates in this Statistical Brief are based upon data from the HCUP 2008 NIS. Historical data were drawn from the 1997 NIS. Supplemental sources included population estimates from 2008 Claritas data and from "Table 1: Annual Estimates of the Resident Population for the United States, Regions, States, and Puerto Rico: April 1, 2000 to July 1, 2009 (NST-EST2009-01)", Population Division, U.S. Census Bureau, Release date: December 2009 (https://www.census.gov/programs-surveys/popest/data/tables.html). Definitions Diagnoses and Procedures, ICD-9-CM, and Clinical Classifications Software (CCS) The principal diagnosis is that condition established after study to be chiefly responsible for the patient’s admission to the hospital. Secondary diagnoses are concomitant conditions that coexist at the time of admission or that develop during the stay. The principal procedure is the procedure that was performed for definitive treatment rather than performed for diagnostic or exploratory purposes (i.e., the procedure that was necessary to take care of a complication). If two procedures appear to meet this definition, the procedure most related to the principal diagnosis was selected as the principal procedure. ICD-9-CM is the International Classification of Diseases, Ninth Revision, Clinical Modification, which assigns numeric codes to diagnoses and procedures. There are about 14,000 ICD-9-CM diagnosis codes and 3,900 ICD-9-CM procedure codes. CCS categorizes ICD-9-CM diagnosis and procedure codes into a manageable number of clinically meaningful categories.6 This "clinical grouper" makes it easier to quickly understand patterns of diagnoses and procedures. Types of hospitals included in HCUP HCUP is based on data from community hospitals, defined as short-term, non-Federal, general and other hospitals, excluding hospital units of other institutions (e.g., prisons). HCUP data include OB-GYN, ENT, orthopedic, cancer, pediatric, public, and academic medical hospitals. Excluded are long-term care, rehabilitation, psychiatric, and alcoholism and chemical dependency hospitals. Please note, a discharge of this nature will be included in the NIS if it occurred in a community hospital. Unit of analysis The unit of analysis is the hospital discharge (i.e., the hospital stay), not a person or patient. This means that a person who is admitted to the hospital multiple times in one year will be counted each time as a separate "discharge" from the hospital. Costs and charges Total hospital charges were converted to costs using HCUP Cost-to-Charge Ratios based on hospital accounting reports from the Centers for Medicare and Medicaid Services (CMS).7 Costs will tend to reflect the actual costs of production, while charges represent what the hospital billed for the case. For each hospital, a hospital-wide cost-to-charge ratio is used because detailed charges are not available across all HCUP States. Hospital charges reflect the amount the hospital charged for the entire hospital stay and does not include professional (physician) fees. For the purposes of this Statistical Brief, costs are reported to the nearest hundreds. Urban-rural location of patient residence Urban-rural measurement for patient residence was based on the U.S. Office of Management and Budget (OMB) definitions of Core-Based Statistical Areas. OMB classifies counties into metropolitan and micropolitan areas. For this Statistical Brief, the metropolitan areas were further divided into large and small metropolitan areas using the Urban Influence Codes (UIC). Thus, for this report, counties were classified into one of four categories:
Median community-level income is the median household income of the patient’s ZIP Code of residence. The cut-offs for the quartile designation are determined using ZIP Code demographic data obtained from Claritas. The income quartile is missing for homeless and foreign patients. Payer Payer is the expected primary payer for the hospital stay. To make coding uniform across all HCUP data sources, payer combines detailed categories into more general groups:
Region Region is one of the four regions defined by the U.S. Census Bureau:
Discharge status indicates the disposition of the patient at discharge from the hospital, and includes the following six categories: routine (to home), transfer to another short-term hospital, other transfers (including skilled nursing facility, intermediate care, and another type of facility such as a nursing home), home healthcare, against medical advice (AMA), or died in the hospital. About HCUP HCUP is a family of powerful healthcare databases, software tools, and products for advancing research. Sponsored by the Agency for Healthcare Research and Quality (AHRQ), HCUP includes the largest all-payer encounter-level collection of longitudinal healthcare data (inpatient, ambulatory surgery, and emergency department) in the United States, beginning in 1988. HCUP is a Federal-State-Industry Partnership that brings together the data collection efforts of many organizations-such as state data organizations, hospital associations, private data organizations, and the federal government-to create a national information resource. HCUP would not be possible without the contributions of the following data collection Partners from across the United States: Arizona Department of Health Services Arkansas Department of Health California Office of Statewide Health Planning and Development Colorado Hospital Association Connecticut Hospital Association Florida Agency for Health Care Administration Georgia Hospital Association Hawaii Health Information Corporation Illinois Department of Public Health Indiana Hospital Association Iowa Hospital Association Kansas Hospital Association Kentucky Cabinet for Health and Family Services Louisiana Department of Health and Hospitals Maine Health Data Organization Maryland Health Services Cost Review Commission Massachusetts Division of Health Care Finance and Policy Michigan Health & Hospital Association Minnesota Hospital Association Missouri Hospital Industry Data Institute Montana MHA — An Association of Montana Health Care Providers Nebraska Hospital Association Nevada Department of Health and Human Services New Hampshire Department of Health & Human Services New Jersey Department of Health and Senior Services New Mexico Health Policy Commission New York State Department of Health North Carolina Department of Health and Human Services Ohio Hospital Association Oklahoma State Department of Health Oregon Association of Hospitals and Health Systems Pennsylvania Health Care Cost Containment Council Rhode Island Department of Health South Carolina State Budget & Control Board South Dakota Association of Healthcare Organizations Tennessee Hospital Association Texas Department of State Health Services Utah Department of Health Vermont Association of Hospitals and Health Systems Virginia Health Information Washington State Department of Health West Virginia Health Care Authority Wisconsin Department of Health Services Wyoming Hospital Association About the NIS The HCUP Nationwide Inpatient Sample (NIS) is a nationwide database of hospital inpatient stays. The NIS is nationally representative of all community hospitals (i.e., short-term, non-Federal, non-rehabilitation hospitals). The NIS is a sample of hospitals and includes all patients from each hospital, regardless of payer. It is drawn from a sampling frame that contains hospitals comprising about 95 percent of all discharges in the United States. The vast size of the NIS allows the study of topics at both the national and regional levels for specific subgroups of patients. In addition, NIS data are standardized across years to facilitate ease of use. For More Information For more information about HCUP, visit http://www.hcup-us.ahrq.gov. For additional HCUP statistics, visit HCUPnet, our interactive query system, at www.hcup.ahrq.gov. For information on other hospitalizations in the U.S., download HCUP Facts and Figures: Statistics on Hospital-based Care in the United States in 2008, located at http://www.hcup-us.ahrq.gov/reports.jsp. For a detailed description of HCUP, more information on the design of the NIS, and methods to calculate estimates, please refer to the following publications: Steiner, C., Elixhauser, A., Schnaier, J.The Healthcare Cost and Utilization Project: An Overview. Effective Clinical Practice 5(3):143–51, 2002. Introduction to the HCUP Nationwide Inpatient Sample, 2008. Online. May, 2010. U.S. Agency for Healthcare Research and Quality. http://hcup-us.ahrq.gov/db/nation/nis/NIS_2008_INTRODUCTION.pdf. Houchens, R., Elixhauser, A. Final Report on Calculating Nationwide Inpatient Sample (NIS) Variances, 2001. HCUP Methods Series Report #2003-2. Online. June 2005 (revised June 6, 2005). U.S. Agency for Healthcare Research and Quality. http://www.hcup-us.ahrq.gov/reports/methods/2003_02.pdf. Suggested Citation Wier, L.M., (Thomson Reuters), Pfuntner, A. (Thomson Reuters), and Steiner, C. (AHRQ). Hospital Utilization among Oldest Adults, 2008. HCUP Statistical Brief #103. December 2010. Agency for Healthcare Research and Quality, Rockville, MD. http://www.hcup-us.ahrq.gov/reports/statbriefs/sb103.pdf. Acknowledgments The authors would like to acknowledge Mika Nagamine (Thomson Reuters) and Minya Sheng (Thomson Reuters) for programming assistance. *** AHRQ welcomes questions and comments from readers of this publication who are interested in obtaining more information about access, cost, use, financing, and quality of healthcare in the United States. We also invite you to tell us how you are using this Statistical Brief and other HCUP data and tools, and to share suggestions on how HCUP products might be enhanced to further meet your needs. Please e-mail us at hcup@ahrq.gov or send a letter to the address below:Irene Fraser, Ph.D., Director Center for Delivery, Organization, and Markets Agency for Healthcare Research and Quality 540 Gaither Road Rockville, MD 20850 1 Calculated using the 2008 National Population Projections from the U.S. Census Bureau. Projected Population by Single Year of Age, Sex, Race, and Hispanic Origin for the U.S.: July 1, 2000 to July 1, 2050. Released 2008. https://www.census.gov/data/tables/time-series/demo/popest/intercensal-2000-2010-state.html 2 National Health Expenditure Accounts. https://www.cms.gov/Research-Statistics-Data-and-Systems/Statistics-Trends-and-Reports/NationalHealthExpendData/Downloads/2010GenderandAgeTables.pdf 3 Centers for Disease Control and Prevention and The Merck Company Foundation. The State of Aging and Health in America 2007. Whitehouse Station, NJ: The Merck Company Foundation; 2007. 4 Medicare Payment Advisory Commission. A Data Book: Healthcare Spending and the Medicare Program. June 2010. http://www.medpac.gov/docs/default-source/reports/Jun10_EntireReport.pdf?sfvrsn=0 5 Calculated using the Budget of the United States Government, Fiscal Year 2008, Table S-7. Budget Summary by Category. Office of Management and Budget, Washington, D.C. 2007. http://www.gpo.gov/fdsys/pkg/BUDGET-2008-BUD/pdf/BUDGET-2008-BUD-30.pdf 6 HCUP CCS. Healthcare Cost and Utilization Project (HCUP). December 2009. U.S. Agency for Healthcare Research and Quality, Rockville, MD. www.hcup-us.ahrq.gov/toolssoftware/ccs/ccs.jsp 7 HCUP Cost-to-Charge Ratio Files (CCR). Healthcare Cost and Utilization Project (HCUP). 2001–2008. U.S. Agency for Healthcare Research and Quality, Rockville, MD. www.hcup-us.ahrq.gov/db/state/costtocharge.jsp. |
| Internet Citation: Statistical Brief #103. Healthcare Cost and Utilization Project (HCUP). February 2011. Agency for Healthcare Research and Quality, Rockville, MD. hcup-us.ahrq.gov/reports/statbriefs/sb103.jsp. |
| Are you having problems viewing or printing pages on this website? |
| If you have comments, suggestions, and/or questions, please contact hcup@ahrq.gov. |
| If you are experiencing issues related to Section 508 accessibility of information on this website, please contact hcup@ahrq.gov. |
| Privacy Notice, Viewers & Players |
| Last modified 2/17/11 |