STATISTICAL BRIEF #100
|
|
November 2010
Pamela L. Owens, Ph.D. and Ryan Mutter, Ph.D.
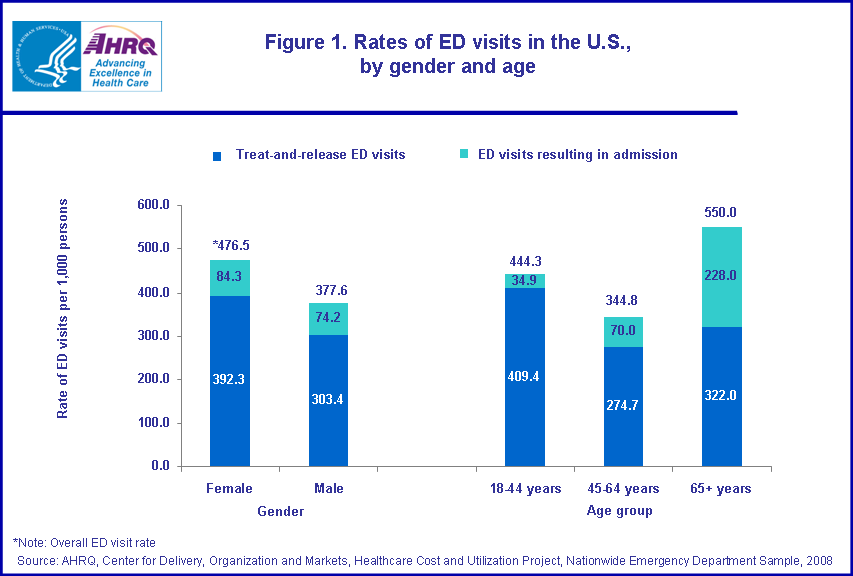
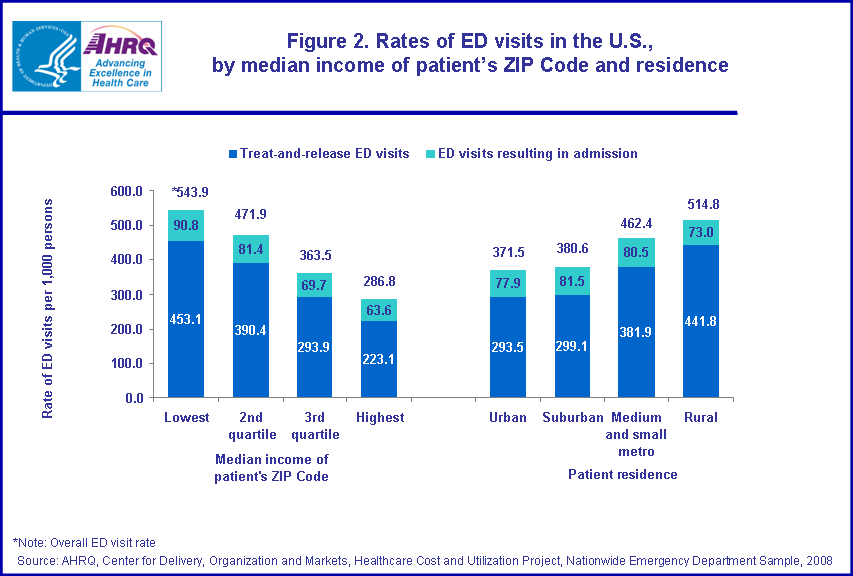
Introduction Between 1997 and 2007, the annual number of emergency department (ED) visits increased by 23 percent1. As visits to the ED rise, policymakers are increasingly concerned about the potential cost, quality, and long-term health and healthcare system consequences of ED overcrowding, overuse, and inappropriate use. This Statistical Brief presents nationally representative data from the Healthcare Cost and Utilization Project (HCUP) on ED visits for adults, ages 18 years and older. The information focuses on the reasons why people visited the ED in 2008. Variations in ED visits based on demographic characteristics, discharge status, and expected payer are also discussed. All differences between estimates noted in the text are statistically significant at the 0.05 level or better. Findings General findings In 2008, there were over 98.5 million ED visits for adults ages 18 and older (table 1). This represents more than three-quarters (78.8 percent) of the 124.9 million ED visits in the US. Four out of five ED visits for adults were "treat-and-release" in which the patient was released from the ED rather than being admitted to that hospital for further care. However, a substantial portion of ED visits (18.5 percent) resulted in hospital admission. Rates of ED visits varied by demographic characteristics with rates highest among women, individuals 65 years and older, those from the lowest income areas, and rural areas (figures 1 and 2). Overall ED utilization rates were 26 percent higher for women than men (476.5 visits per 1,000 women versus 377.6 visits per 1,000 men); 24 and 60 percent higher for adults 65 years and older than those 18–44 years and 45–64 years, respectively (550.0 visits per 1,000 65+ year olds versus 444.3 per 1,000 18–44 year olds and 344.8 per 1,000 45–64 year olds); 90 percent higher for adults from the lowest income areas than those from the highest income areas (543.9 per 1,000 adults versus 286.8 per 1,000 adults, respectively); and 39 percent higher for adults from rural areas than for those from urban areas (514.8 per 1,000 adults versus 371.5 per 1,000 adults, respectively). Many of these differences were still evident when treat-and-release ED visits and ED visits resulting in admission were examined separately. |
|
In terms of primary expected payer (table 1), about one-third of ED visits were billed to private insurance (33.1 percent) followed by Medicare (25.9 percent), uninsured (19.6 percent) and Medicaid (16.1 percent). Among treat-and-release ED visits, 35.3 percent were billed to private insurance followed by uninsured (22.3 percent), Medicare (19.8 percent) and Medicaid (16.9 percent). For ED visits resulting in hospital admission, more than half were billed to Medicare (52.9 percent), nearly a quarter to private insurance (23.7 percent), over a tenth to Medicaid (12.7 percent) and only 7.6 percent were billed as uninsured.
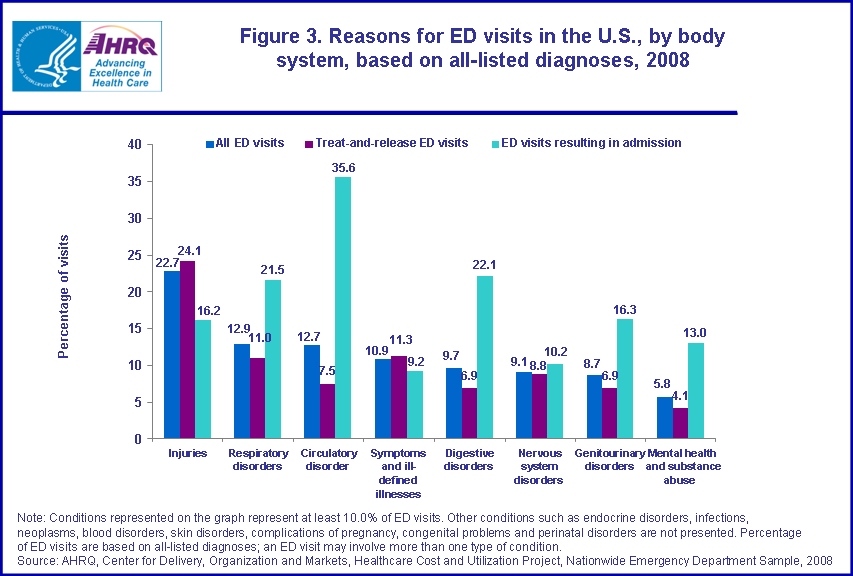
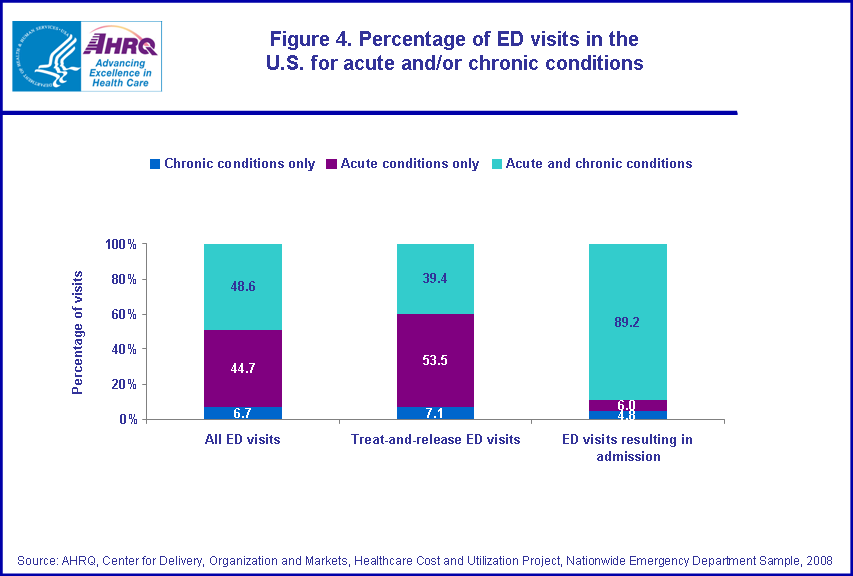
Most common all-listed reasons for ED visits among adults Figure 3 shows the reasons for ED visits, organized by body system, based on all-listed diagnoses. Injuries were the most common reason for all ED visits, comprising 22.7 percent of all ED visits. Respiratory and circulatory disorders were the next most common category of conditions: 12.9 percent and 12.7 percent of all ED visits, respectively. Ill-defined signs and symptoms, digestive disorders, and nervous system disorders each comprised roughly 10 percent of all ED visits. The proportion of visits related to each condition varied by the type of ED visit. For example, circulatory disorders were seen in only 7.5 percent of treat-and-release ED visits, while among those ED visits resulting in hospital admission, 35.6 percent were for circulatory disorders. The most common conditions for treat-and-release ED visits included injuries (24.1 percent), ill-defined signs and symptoms (11.3 percent), and respiratory conditions (11.0 percent). The most common conditions for ED visits resulting in hospital admission included circulatory disorders (35.6 percent), digestive disorders (22.1 percent), respiratory disorders (21.5 percent), genitourinary disorders (16.3 percent), injuries (16.2 percent) and mental health and substance abuse conditions (13.0 percent). Most common specific conditions Figure 4 shows that the majority of ED visits were for patients with acute conditions (93.3 percent—44.7 percent involved only acute conditions and 48.6 percent involved both acute and chronic conditions). Although the majority of treat-and-release ED visits and those resulting in hospital admission involved acute conditions, the distribution of visits associated with acute and chronic conditions varied by type of visit. Both acute and chronic conditions were seen in only 39.4 percent of treat-and-release ED visits, while 89.2 percent of ED visits resulting in hospital admission were related to both types of conditions. Only 6 percent of ED visits resulting in hospital admission were related solely to acute conditions. A remarkably small proportion of all ED visits—6.7 percent—were related solely to exacerbations of chronic conditions, which are potentially preventable with appropriate outpatient care. Table 2 provides details on the most frequent reasons for ED visits. These conditions accounted for approximately 52 percent of all ED visits, 53 percent of all treat-and-release ED visits, and 82 percent of ED visits resulting in hospital admission. Essential hypertension, a chronic condition, was the top most common condition for ED visits, being related to nearly 20 million (19.8 percent) ED visits. This was followed by several other chronic conditions including coronary atherosclerosis (11.9 percent), diabetes mellitus without complications (9.3 percent), and hyperlipidemia (8.0 percent). Top 10 specific reasons for ED visits also included acute conditions such as fluid and electrolyte disorders (8.8 percent), superficial injury (8.7 percent), abdominal pain (7.4 percent), and sprains and strains (7.2 percent). Dominated by acute conditions, the top 3 common conditions for treat-and-release ED visits were essential hypertension (14.9 percent), superficial injury (10.0 percent), and sprains and strains (8.7 percent). The top 3 common conditions for ED visits resulting in hospital admission included two chronic conditions—coronary atherosclerosis (42.6 percent) and essential hypertension (41.1 percent) followed by an acute condition—fluid and electrolyte disorders (35.4 percent). Data Source The estimates in this Statistical Brief are based upon data from the HCUP 2008 Nationwide Emergency Department Sample (NEDS). Population estimates were obtained from the US Census Bureau, Population Division, Table 2. Annual Estimates of the Resident Population by Sex and Selected Age Groups for the United States: April 1, 2000 to July 1, 2009 (NC-EST2009-02) as well as Claritas Population Estimates, 2008. Many of the statistics can also be generated from HCUPnet, a free, online query system that provides users with immediate access to the largest set of publicly available, all-payer national, regional, and State-level hospital care databases from HCUP. Definitions Types of hospitals included in HCUP HCUP is based on data from community hospitals, defined as short-term, non-Federal, general and other hospitals, excluding hospital units of other institutions (e.g., prisons). HCUP data include OB-GYN, ENT, orthopedic, cancer, pediatric, public, and academic medical hospitals. They exclude long-term care, rehabilitation, psychiatric, and alcoholism and chemical dependency hospitals, but these types of ED visits are included if they are from community hospitals. Unit of analysis The unit of analysis is the ED visit, not a person or patient. This means that a person who visits the ED multiple times in one year will be counted each time as a separate ED visit. Treat-and-release ED visits Treat-and-release ED visits were those ED visits in which patients are treated and released from that ED (i.e., they are not admitted to that specific hospital). While the majority of treat-and-release patients (93.7%) were discharged home, some were transferred to another acute care facility (1.7%), left against medical advice (1.7%), went to another type of long-term or intermediate care facility (nursing home or psychiatric treatment facility) (1.6%), referred to home healthcare (0.2%) or died (0.2%), or discharged alive but the destination is unknown (0.9%). ED visits resulting in hospital admission ED visits resulting in a hospital stay included those patients initially seen in the ED and then admitted to the same hospital. Urban-rural location of patient residence Urban-rural location is one of six categories as defined by the National Center for Health Statistics:
Median community-level income Median community-level income is the median household income of the patient’s ZIP Code of residence. The cut-offs for the quartile designation are determined using ZIP Code demographic data obtained from Claritas. The income quartile is missing for homeless and foreign patients. Payer Payer is the primary expected payer for the ED visit. To make coding uniform across all HCUP data sources, payer combines detailed categories into more general groups:
Diagnoses, ICD-9-CM, and Clinical Classifications Software (CCS) The principal diagnosis is that condition established after study to be chiefly responsible for the patient’s admission to the hospital. Secondary diagnoses are concomitant conditions that coexist at the time of admission or that develop during the stay. All-listed diagnoses include the principal diagnosis plus these additional secondary conditions. ICD-9-CM is the International Classification of Diseases, Ninth Revision, Clinical Modification, which assigns numeric codes to diagnoses. There are about 13,600 ICD-9-CM diagnosis codes. CCS categorizes ICD-9-CM diagnoses and procedures into clinically meaningful categories.2 This "clinical grouper" makes it easier to quickly understand patterns of diagnoses and procedures. Chronic Condition A chronic condition is defined as a condition that lasts 12 months or longer and meets one or both of the following tests: (a) it places limitations on self-care, independent living, and social interactions; (b) it results in the need for ongoing intervention with medical products, services, and special equipment. The identification of chronic conditions is based on all 5-digit ICD-9-CM codes. E Codes, or external cause of injury codes, are not classified because all injuries are assumed to be acute. Additional information on the Chronic Condition Indicator (CCI) HCUP tool can be found at http://www.hcup-us.ahrq.gov/toolssoftware/chronic/chronic.jsp. ED visits were further classified as having only chronic conditions listed, only acute conditions listed or both chronic and acute conditions listed on the record. About HCUP HCUP is a family of powerful healthcare databases, software tools, and products for advancing research. Sponsored by the Agency for Healthcare Research and Quality (AHRQ), HCUP includes the largest all-payer encounter-level collection of longitudinal healthcare data (inpatient, ambulatory surgery, and emergency department) in the United States, beginning in 1988. HCUP is a Federal-State-Industry Partnership that brings together the data collection efforts of many organizations—such as State data organizations, hospital associations, private data organizations, and the Federal government—to create a national information resource. HCUP would not be possible without the contributions of the following data collection Partners from across the United States: Arizona Department of Health Services Arkansas Department of Health California Office of Statewide Health Planning and Development Colorado Hospital Association Connecticut Hospital Association Florida Agency for Health Care Administration Georgia Hospital Association Hawaii Health Information Corporation Illinois Department of Public Health Indiana Hospital Association Iowa Hospital Association Kansas Hospital Association Kentucky Cabinet for Health and Family Services Louisiana Department of Health and Hospitals Maine Health Data Organization Maryland Health Services Cost Review Commission Massachusetts Division of Health Care Finance and Policy Michigan Health & Hospital Association Minnesota Hospital Association Missouri Hospital Industry Data Institute Montana MHA — An Association of Montana Health Care Providers Nebraska Hospital Association Nevada Department of Health and Human Services New Hampshire Department of Health & Human Services New Jersey Department of Health and Senior Services New Mexico Health Policy Commission New York State Department of Health North Carolina Department of Health and Human Services Ohio Hospital Association Oklahoma State Department of Health Oregon Association of Hospitals and Health Systems Pennsylvania Health Care Cost Containment Council Rhode Island Department of Health South Carolina State Budget & Control Board South Dakota Association of Healthcare Organizations Tennessee Hospital Association Texas Department of State Health Services Utah Department of Health Vermont Association of Hospitals and Health Systems Virginia Health Information Washington State Department of Health West Virginia Health Care Authority Wisconsin Department of Health Services Wyoming Hospital Association About the NEDS The HCUP Nationwide Emergency Department Sample (NEDS) is a nationwide database of hospital-based ED visits. The NEDS is nationally representative of all community hospital-based emergency departments (i.e., short-term, non-Federal, non-rehabilitation hospital-based emergency departments). The NEDS is a 20% stratified sample of hospital-based EDs and includes records on all patients, regardless of payer. The NEDS contains information on 26 million records (unweighted) on ED visits at over 950 hospitals. The vast size of the NEDS allows the study of topics at both the national and regional levels for specific subgroups of patients. The NEDS is produced annually, beginning with the 2006 data year. About HCUPnet HCUPnet is an online query system that offers instant access to the largest set of all-payer healthcare databases that are publicly available. HCUPnet has an easy step-by-step query system, allowing for tables and graphs to be generated on national and regional statistics, as well as trends for community hospitals in the U.S. HCUPnet generates statistics using data from HCUP's Nationwide Inpatient Sample (NIS), the Kids' Inpatient Database (KID), the Nationwide Emergency Department Sample (NEDS), the State Inpatient Databases (SID) and the State Emergency Department Databases (SEDD). For More Information For more information about HCUP, visit http://www.hcup-us.ahrq.gov. For additional HCUP statistics, visit HCUPnet, our interactive query system, at www.hcup.ahrq.gov. For information on other hospitalizations in the U.S., download HCUP Facts and Figures: Statistics on Hospital-based Care in the United States in 2008, located at http://www.hcup-us.ahrq.gov/reports.jsp. For a detailed description of HCUP, more information on the design of the NEDS, and methods to calculate estimates, please refer to the following publications: Steiner, C., Elixhauser, A., Schnaier, J.The Healthcare Cost and Utilization Project: An Overview. Effective Clinical Practice 2002 5(3):143–51. Introduction to the HCUP Nationwide Emergency Department Sample, 2008. Online. January, 2010. U.S. Agency for Healthcare Research and Quality. http://www.hcup-us.ahrq.gov/db/nation/neds/NEDS2008Introductionv3.pdf. Houchens, R., Elixhauser, A. Final Report on Calculating Nationwide Inpatient Sample (NIS) Variances, 2001. HCUP Methods Series Report #2003-2. Online. June 2005 (revised June 6, 2005). U.S. Agency for Healthcare Research and Quality. http://www.hcup-us.ahrq.gov/reports/methods/2003_02.pdf. Suggested Citation Owens P.L., Mutter R. Emergency Department Visits Abuse for Adults in Community Hospitals, 2008. HCUP Statistical Brief #100. November 2010. Agency for Healthcare Research and Quality, Rockville, MD. http://www.hcup-us.ahrq.gov/reports/statbriefs/sb100.pdf. AHRQ welcomes questions and comments from readers of this publication who are interested in obtaining more information about access, cost, use, financing, and quality of healthcare in the United States. We also invite you to tell us how you are using this Statistical Brief and other HCUP data and tools, and to share suggestions on how HCUP products might be enhanced to further meet your needs. Please e-mail us at hcup@ahrq.gov or send a letter to the address below: Irene Fraser, Ph.D., Director Center for Delivery, Organization, and Markets Agency for Healthcare Research and Quality 540 Gaither Road Rockville, MD 20850 1 Niska R, Bhuiya F, Xu J. National Hospital Ambulatory Medical Care Survey: 2007 Emergency Department Summary. National Health Statistics Reports: No. 26. Hyattsville, MD: National Center for Health Statistics. 2010. 2 HCUP CCS. Healthcare Cost and Utilization Project (HCUP). December 2009. U.S. Agency for Healthcare Research and Quality, Rockville, MD. www.hcup-us.ahrq.gov/toolssoftware/ccs/ccs.jsp. |
| Table 1: Overview of ED visits for adults 18 years and older in the U.S., 2008 | |||
| Characteristic | All ED visits | Treat-and-release ED visits** | ED visits resulting in hospital admission |
|---|---|---|---|
| Number of ED visits | 98,515,683 | 80,261,409 | 18,254,275 |
| Percentage of all ED visits1 | 100.0% | 81.5% | 18.5% |
| Percentage of visits2 | |||
| Age | |||
| 18–44 years | 51.1% | 57.8% | 21.7% |
| 45–64 years | 27.2% | 26.6% | 29.9% |
| 65+ years | 21.7% | 15.6% | 48.5% |
| Sex | |||
| Female | 57.1% | 57.6% | 54.4% |
| Male | 42.9% | 42.3% | 45.5% |
| Median income of patient's ZIP Code | |||
| First quartile (lowest income) | 30.6% | 31.3% | 27.6% |
| Second quartile | 29.1% | 29.5% | 27.1% |
| Third quartile | 20.7% | 20.5% | 21.4% |
| Fourth quartile (highest income) | 16.8% | 16.0% | 20.1% |
| Patient residence | |||
| Urban | 25.4% | 24.6% | 28.7% |
| Suburban | 21.6% | 20.8% | 25.0% |
| Medium and small metropolitan | 31.8% | 32.3% | 29.9% |
| Non-metropolitan (rural) | 20.3% | 21.4% | 15.5% |
| Expected payer | |||
| Medicare | 25.9% | 19.8% | 52.9% |
| Medicaid | 16.1% | 16.9% | 12.7% |
| Private insurance | 33.1% | 35.3% | 23.7% |
| Other | 5.2% | 5.7% | 3.1% |
| Uninsured | 19.6% | 22.3% | 7.6% |
| Source: AHRQ, Center for Delivery, Organization and Markets, Healthcare Cost and Utilization Project, Nationwide Emergency Department Sample, 2008. **Overall, with treat-and-release cases, the majority of patients (93.7%) were discharged home or to home healthcare (0.2%). Some were transferred to another acute care facility (1.7%), left against medical advice (1.7%), went to another type of long-term or intermediate care facility (nursing home or psychiatric treatment facility (1.6%) or died (0.2%). 1Row percentage 2Column percentage | |||
| Table 2. Most frequent all-listed conditions for all ED visits for adults 18 years and older in the U.S., 2008 | |||||||||
| All-Listed Condition (CCS code) | All ED visits | Treat-and-release ED visits | ED visits resulting in hospital admission | ||||||
|---|---|---|---|---|---|---|---|---|---|
| Rank | N | Percentage | Rank | N | Percentage | Rank | N | Percentage | |
| Essential hypertension (98) | 1 | 19,488,974 | 19.8% | 1 | 11,994,165 | 14.9% | 2 | 7,494,809 | 41.1% |
| Coronary atherosclerosis (101) | 2 | 11,697,463 | 11.9% | 1 | 7,784,801 | 42.6% | |||
| Diabetes mellitus without complications (49) | 3 | 9,142,200 | 9.3% | 6 | 5,545,055 | 6.9% | 8 | 3,597,145 | 19.7% |
| Fluid and electrolyte disorders (55) | 4 | 8,696,243 | 8.8% | 3 | 6,468,723 | 35.4% | |||
| Superficial injury, contusion (239) | 5 | 8,595,906 | 8.7% | 2 | 8,041,275 | 10.0% | |||
| Spondylosis, intervertebral disc (205) | 6 | 8,090,946 | 8.2% | 5 | 6,681,252 | 8.3% | |||
| Hyperlipidemia (53) | 7 | 7,873,956 | 8.0% | 4 | 4,917,653 | 26.9% | |||
| Abdominal pain (251) | 8 | 7,321,599 | 7.4% | 4 | 6,891,735 | 8.6% | |||
| Sprains and strains (232) | 9 | 7,048,283 | 7.2% | 3 | 6,952,372 | 8.7% | |||
| Cardiac dysrhthmias (106) | 10 | 7,012,136 | 7.1% | 5 | 4,371,218 | 23.9% | |||
| Other lower respiratory disease (133) | 7 | 4,594,735 | 5.7% | ||||||
| Nonspecific chest pain (102) | 8 | 4,547,271 | 5.7% | ||||||
| Other connective tissue disease (e.g., limb pain, swelling in limb) (211) | 9 | 4,529,287 | 5.6% | ||||||
| Headache, including migraine (84) | 10 | 4,414,780 | 5.5% | ||||||
| Congestive heart failure (108) | 6 | 4,037,396 | 22.1% | ||||||
| Anemia (59) | 7 | 3,860,365 | 21.1% | ||||||
| Other nutritional, endocrine and metabolic disorders (58) | 9 | 3,288,107 | 18.0% | ||||||
| Chronic obstructive pulmonary disease (127) | 10 | 3,134,901 | 17.2% | ||||||
| Total ED visits with at least one top 10 condition | 50,979,032 | 51.7% | 42,834,350 | 53.4% | 15,013,925 | 82.2% | |||
|
Note: The number and percentage of visits are based on all-listed conditions; an ED visit may involve more than one type of condition. Source: AHRQ, Center for Delivery, Organization and Markets, Healthcare Cost and Utilization Project, Nationwide Emergency Department Sample, 2008 | |||||||||
|
Figure 1. Rates of ED visits in the U.S., by patient demographics, 2008. Rate of ED visits per 1,000 persons, sex, female, Treat-and-release ED visits, 392.3; ED visits resulting in admission, 84.3; Total ED visits, 476.5*. Rate of ED visits per 1,000 persons, sex, male, Treat-and-release ED visits, 303.4; ED visits resulting in admission, 74.2; Total ED visits, 377.6. Rate of ED visits per 1,000 persons, age group, 18 through 44 years, Treat-and-release ED visits, 409.4; ED visits resulting in admission, 34.9; Total ED visits, 444.3.
Rate of ED visits per 1,000 persons, age group, 45 through 64 years, Treat-and-release ED visits, 274.7; ED visits resulting in admission, 70.0; Total ED visits, 344.8. Rate of ED visits per 1,000 persons, age group, 65 plus years, Treat-and-release ED visits, 322.0; ED visits resulting in admission, 228.0; Total ED visits, 550.0. *Note: Overall ED visit rate. Source: AHRQ, Center for Delivery, Organization and Markets, Healthcare Cost and Utilization Project, Nationwide Emergency Department Sample, 2008.
Figure 2. Rates of ED visits in the U.S., by patient demographics, 2008. Rate of ED visits per 1,000 persons, Median income of patient’s ZIP Code, Lowest, Treat-and-release ED visits, 453.1; ED visits resulting in admission, 90.8; Total ED visits, 543.9*. Rate of ED visits per 1,000 persons, Median income of patient’s ZIP Code, 2nd quartile, Treat-and-release ED visits, 390.4; ED visits resulting in admission, 81.4; Total ED visits, 471.9. Rate of ED visits per 1,000 persons, Median income of patient’s ZIP Code, 3rd quartile, Treat-and-release ED visits, 293.9; ED visits resulting in admission, 69.7; Total ED visits, 363.5. Rate of ED visits per 1,000 persons, Median income of patient’s ZIP Code, Highest, Treat-and-release ED visits, 223.1; ED visits resulting in admission, 63.6; Total ED visits, 286.8. Rate of ED visits per 1,000 persons, Patient residence; Urban, Treat-and-release ED visits, 293.5; ED visits resulting in admission, 77.9; Total ED visits, 371.5. Rate of ED visits per 1,000 persons, Patient residence; Suburban, Treat-and-release ED visits, 299.1; ED visits resulting in admission, 81.5; Total ED visits, 380.6. Rate of ED visits per 1,000 persons, Patient residence; Medium and small metro, Treat-and-release ED visits, 381.9; ED visits resulting in admission, 80.5; Total ED visits, 462.4. Rate of ED visits per 1,000 persons, Patient residence; Rural, Treat-and-release ED visits, 441.8; ED visits resulting in admission, 73.0; Total ED visits, 514.8. *Note: Overall ED visit rate. Source: AHRQ, Center for Delivery, Organization and Markets, Healthcare Cost and Utilization Project, Nationwide Emergency Department Sample, 2008.
Figure 3. Reasons for ED visits in the U.S., by body system, based on all-listed diagnoses, 2008. Percentage of visits, Injuries; All ED visits, 22.7.; Treat-and-release ED visits, 24.1; ED visits resulting in admission, 16.2; Percentage of visits, Respiratory disorders; All ED visits, 12.9.; Treat-and-release ED visits, 11.0; ED visits resulting in admission, 21.5; Percentage of visits, Circulatory disorder; All ED visits, 12.7.; Treat-and-release ED visits, 7.5; ED visits resulting in admission, 35.6; Percentage of visits, Symptoms and ill-defined illnesses; All ED visits, 10.9.; Treat-and-release ED visits, 11.3; ED visits resulting in admission, 9.2; Percentage of visits, Digestive disorders; All ED visits, 9.7.; Treat-and-release ED visits, 6.9; ED visits resulting in admission, 22.1; Percentage of visits, nervous system disorders; All ED visits, 9.1.; Treat-and-release ED visits, 8.8; ED visits resulting in admission, 10.2; Percentage of visits, genitourinary disorders; All ED visits, 8.7.; Treat-and-release ED visits, 6.9; ED visits resulting in admission, 16.3; Percentage of visits, mental health and substance abuse; All ED visits, 5.8.; Treat-and-release ED visits, 4.1; ED visits resulting in admission, 13.0. NOTE: Conditions represented on the graph represent at least 10.0% of one type of ED visit. Other conditions such as endocrinedisorders, infections, neoplasms, blood disorders, skin disorders, complications of pregnancy, congenital problems and perinataldisorders are not presented. Percentage of ED visits are based on all-listed diagnoses; an ED visit may involve more than one type of condition. Source: AHRQ, Center for Delivery, Organization and Markets, Healthcare Cost and Utilization Project, Nationwide Emergency Department Sample, 2008.
Figure 4. Percentage of ED visits in the U.S. for acute and/or chronic conditions. Percentage of ED visits, all ED visits; Chronic conditions, 6.7; acute conditions only, 44.7.; acute and chronic conditions, 48.6; Percentage of ED visits, treat and release ED visits; Chronic conditions, 7.1; acute conditions only, 53.5.; acute and chronic conditions, 39.4; Percentage of ED visits, all ED visits; Chronic conditions, 4.8; acute conditions only, 6.0.; acute and chronic conditions, 89.2; Source: AHRQ, Center for Delivery, Organization and Markets, Healthcare Cost and Utilization Project, Nationwide Emergency Department Sample, 2008.
|
| Internet Citation: Statistical Brief #100. Healthcare Cost and Utilization Project (HCUP). November 2010. Agency for Healthcare Research and Quality, Rockville, MD. hcup-us.ahrq.gov/reports/statbriefs/sb100.jsp. |
| Are you having problems viewing or printing pages on this website? |
| If you have comments, suggestions, and/or questions, please contact hcup@ahrq.gov. |
| If you are experiencing issues related to Section 508 accessibility of information on this website, please contact hcup@ahrq.gov. |
| Privacy Notice, Viewers & Players |
| Last modified 11/22/10 |