TABLE OF CONTENTS
HIGHLIGHTS
INTRODUCTION
HCUP PARTNERS
1. OVERVIEW
2. DIAGNOSES
3. PROCEDURES
4. COSTS
5. MHSA
SOURCES/METHODS
DEFINITIONS
FOR MORE INFO
ACKNOWLEDGMENTS
CITATION
FACTS & FIGURES 2008 PDF
|
EXHIBIT 3.1 Most Frequent All-listed Procedures (PDF)
Number, Percent Distribution, Rank, and Growth of Discharges for the Most Frequent All-listed Inpatient Hospital Procedures, 1997 and 2008
| ALL-LISTED CCS PROCEDURES |
NUMBER OF DISCHARGES WITH THE PROCEDURE IN THOUSANDS |
PERCENT OF DISCHARGES WITH THE PROCEDURE |
RANK |
CUMULATIVE GROWTH |
| 1997 |
2008 |
1997 |
2008 |
1997 |
2008 |
1997-2008 |
| All discharges (with and without procedures) |
34,679 |
39,885 |
|
|
|
|
15% |
| All discharges with any procedure |
21,257 |
25,118 |
100.0% |
100.0% |
|
|
18 |
| Percent of all discharges with a procedure |
61% |
63% |
|
|
|
|
|
| Discharges with maternal and newborn procedures |
| Prophylactic vaccinations and inoculations |
567 |
1,619 |
3.0 |
6.4 |
14 |
2 |
186 |
| Cesarean section |
800 |
1,378 |
4.0 |
5.5 |
9 |
5 |
72 |
| Repair of obstetric laceration |
1,137 |
1,371 |
5.0 |
5.5 |
3 |
6 |
21 |
| Circumcision |
1,164 |
1,231‡ |
5.0 |
4.9 |
2 |
8 |
6 |
| Artificial rupture of membranes to assist delivery |
747 |
1,000‡ |
4.0 |
4.0 |
10 |
9 |
34 |
| Fetal monitoring |
1,002 |
957‡ |
5.0 |
3.8 |
6 |
10 |
-4 |
| Episiotomy |
866 |
348 |
4.0 |
1.4 |
8 |
31 |
-60 |
| Discharges with all other procedures |
| Blood transfusion |
1,097 |
2,725 |
5.0 |
10.8 |
5 |
1 |
148 |
| Diagnostic cardiac catheterization, coronary arteriography |
1,461 |
1,521‡ |
7.0 |
6.1 |
1 |
3 |
4 |
| Respiratory intubation and mechanical ventilation |
919 |
1,444 |
4.0 |
5.8 |
7 |
4 |
57 |
| Upper gastrointestinal endoscopy |
1,105 |
1,256 |
5.0 |
5.0 |
4 |
7 |
14 |
| Echocardiogram |
632 |
839 |
3.0 |
3.3 |
11 |
11 |
33 |
| Hemodialysis |
473 |
794 |
2.2 |
3.2 |
17 |
12 |
68 |
| Percutaneous transluminal coronary angioplasty (PTCA) |
581 |
758 |
2.7 |
3.0 |
13 |
13 |
30 |
| Arthroplasty knee |
329 |
687 |
1.5 |
2.7 |
32 |
14 |
109 |
| Colonoscopy and biopsy |
531 |
587 |
2.5 |
2.3 |
16 |
15 |
10 |
‡ 2008 discharges are not statistically different from 1997 discharges at p‹0.05.
Source: AHRQ, Center for Delivery, Organization, and Markets, Healthcare Cost and Utilization Project, Nationwide Inpatient Sample, 1997 and 2008. |
At least one procedure was performed during almost two out of every three hospital stays in 2008 and often more than one procedure was performed. The number of discharges with procedures increased from 21.3 million in 1997 to 25.1 million in 2008, an 18-percent increase.
- Blood transfusion occurred in over ten percent of all hospital stays that included a procedure and was the most frequently performed procedure in 2008.
- While many of the fifteen most common procedures in 2008 were also frequently performed in 1997, there were some notable exceptions:
- Vaccinations rose in rank from fourteenth in 1997 to second in 2008. These vaccinations were overwhelmingly hepatitis B immunizations for liveborn infants.
- Episiotomy, a surgical incision to prevent traumatic tearing during vaginal delivery, fell from the list of top procedures, dropping in rank from eighth in 1997 to thirty-first in 2008, a 60-percent decrease.
- Discharges with arthroplasty of the knee procedures more than doubled from 329,000 in 1997 to 687,000 in 2008. Arthroplasty of the knee was the fourteenth most common inpatient procedure in 2008.
- Hemodialysis and colonoscopy/biopsy also rose in frequency to rank in the top 15 procedures performed in hospitals in 2008.
- C-section was the most frequent major operating room procedure—performed on 1.4 million women in 2008.

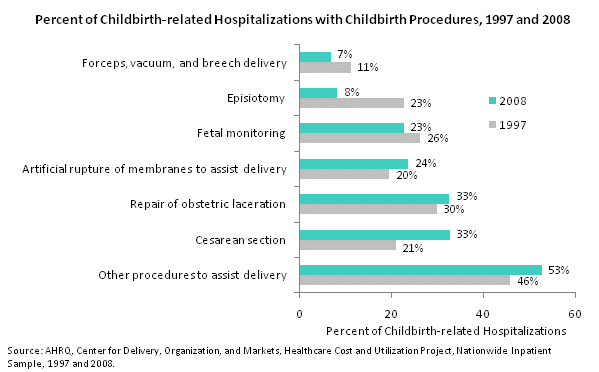
Percent of childbirth-related hospitalizations with childbirth procedures, 1997 and 2008. Bar chart. Percent of childbirth-related hospitalizations. Forceps, vacuum, and breech delivery: 1997: 11%; 2008: 7%; episiotomy: 1997: 23%; 2008: 8%; fetal monitoring: 1997: 26%; 2008: 23%; artificial rupture of membranes to assist delivery: 1997: 20%; 2008: 24%; repair of obstetric laceration: 1997: 30%; 2008: 33%; Cesarean section: 1997: 21%; 2008: 33%; other procedures to assist delivery: 1997: 46%; 2008: 53%.
- Only 8 percent of childbirth-related hospitalizations involved episiotomy procedures in 2008, down from 23 percent in 1997.
- Repair of obstetric laceration and C-section were each performed in one-third of childbirth-related hospitalizations in 2008.
- Artificial rupture of membranes to assist delivery was performed in 24 percent of all childbirths (up from 20 percent in 1997) and fetal monitoring was performed in 23 percent of all childbirths (compared with 26 percent in 1997).
- More than half (53 percent) of childbirth-related hospitalizations involved other procedures to assist delivery in 2008, up from 46 percent in 1997.

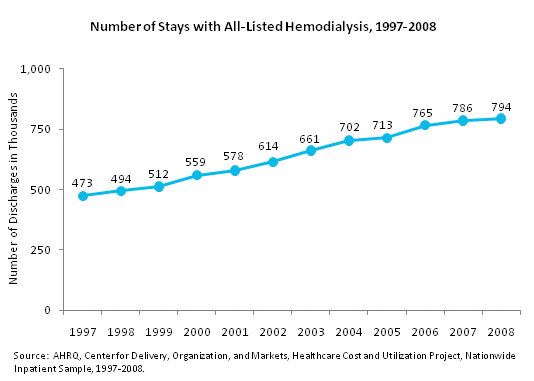
Number of stays with all-listed hemodialysis, 1997 through 2008. Line chart. Number of discharges in thousands. 1997: 473; 1998: 494; 1999: 512; 2000: 559; 2001: 578; 2002: 614; 2003: 661; 2004: 702; 2005: 713; 2006: 765; 2007: 786; 2008: 794.
- Discharges with hemodialysis grew 68 percent between 1997 and 2008. There were 473,000 stays for this procedure in 1997 and 794,000 in 2008.

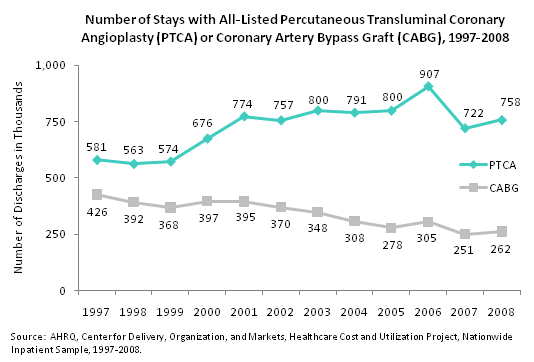
Number of stays with all-listed percutaneous transluminal coronary angioplasty (PTCA) or coronary artery bypass graft (CABG), 1997 through 2008. Line chart. Number of discharges in thousands. PTCA: 1997: 581; 1998: 563; 1999: 574; 2000: 676; 2001: 774; 2002: 757; 2003: 800; 2004: 791; 2005: 800; 2006: 907; 2007: 722; 2008: 758. CABG: 1997: 426; 1998: 392; 1999: 368; 2000: 397; 2001: 395; 2002: 370; 2003: 348; 2004: 308; 2005: 278; 2006: 305; 2007: 251; 2008: 262.
- PTCA—a procedure involving the use of a balloon-tipped catheter to enlarge a narrowed artery—grew 56 percent from 1997 to 2006. Between 2006 and 2008, however, there was a 17-percent decline in discharges with this procedure.
- Discharges with coronary artery bypass graft (CABG) procedures declined 38 percent between 1997 and 2008. There were 426,000 stays for this procedure in 1997 and 262,000 in 2008.

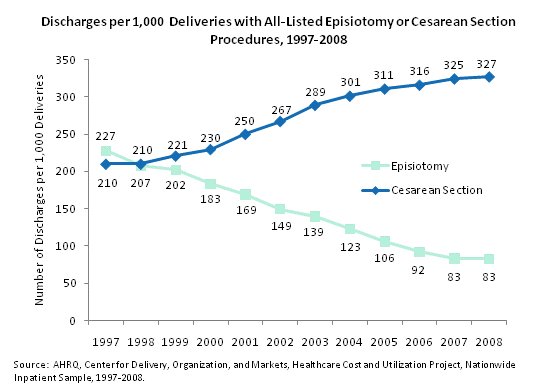
Discharges per 1,000 deliveries with all-listed episiotomy or Cesarean section procedures, 1997 through 2008. Line chart. Number of discharges per 1,000 deliveries. Episiotomy: 1997: 227; 1998: 207; 1999: 202; 2000: 183; 2001: 169; 2002: 149; 2003: 139; 2004: 123; 2005: 106; 2006: 92; 2007: 83; 2008: 83. Cesarean section: 1997: 210; 1998: 210; 1999: 221; 2000: 230; 2001: 250; 2002: 267; 2003: 289; 2004: 301; 2005: 311; 2006: 316; 2007: 325; 2008: 327.
- In 1997 there were 227 episiotomy procedures performed per 1,000 deliveries. By 2008, this procedure was performed during only 83 per 1,000 deliveries —a decline of 64 percent.
- The rate of C-sections increased by 56 percent between 1997 and 2008. There were 210 C-sections performed per 1,000 deliveries in 1997 and 327 per 1,000 deliveries in 2008.
Previous Next
|