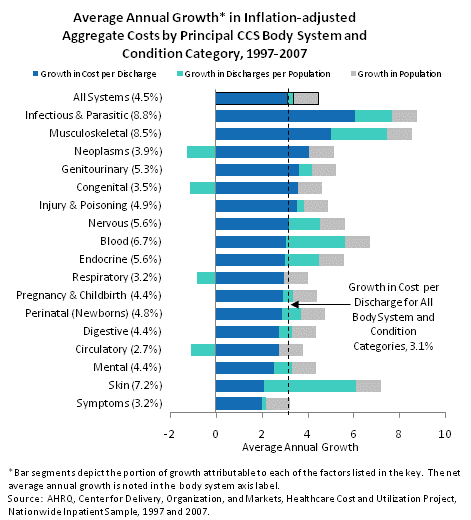
EXHIBIT 4.2 Cost by Diagnosis
PDF

(text version)
The growth in aggregate costs for stays in community hospitals averaged 4.5 percent annually between 1997 and 2007.
- The most important driver of cost increases was greater intensity of services (cost per discharge) provided during the hospital stay (averaging 3.1 percent annually), followed by population growth (up 1.1 percent annually). Growth in the number of stays per person (use) was responsible for an increase of only 0.3 percent annually.
- Growth in intensity of services accounted for 70 percent of the growth in aggregate costs, while population growth was responsible for 24 percent and an increased number of discharges per population for 6 percent.
- The cost growth for infectious and parasitic conditions, musculoskeletal conditions, neoplasms, genitourinary conditions, congenital anomalies and injury and poisoning was predominantly driven by higher than average growth in cost per discharge, indicating greater intensity of use of services and more expensive interventions.
- Although growth in stays per person is seldom a major factor in increasing costs, it was for one body system:
- Skin conditions were the only body condition where more than half of the growth in costs was attributable to growth in hospital use per person (discharges per population).
- In five additional body systems, the increase in use per person was also a relatively more important factor in cost growth than in other body systems. These five body system and condition categories were infectious and parasitic, musculoskeletal, nervous, blood, and endocrine body systems and conditions.
- Increases in the net cost of hospital stays for neoplasms, congenital conditions, respiratory conditions, and circulatory conditions were dampened by an actual decline in hospitalizations per population.
Cost, Growth and Contribution to CCS Body System Growth for Selected Principal Diagnoses, 1997-2007
| PRINCIPAL CCS BODY SYSTEM AND CONDITION CATEGORY & PRINCIPAL CCS DIAGNOSIS |
TOTAL INFLATION-ADJUSTED† HOSPITAL COSTS IN BILLIONS: 2007 DOLLARS |
AVERAGE ANNUAL GROWTH |
PERCENT CONTRIBUTION TO GROWTH IN AGGREGATE COSTS |
PERCENT CONTRIBUTION TO GROWTH IN BODY SYSTEM COSTS |
| 1997 |
2007 |
1997-2007 |
| Infectious and parasitic |
| Septicemia (blood infection) |
$4.1 |
$12.3 |
11.6% |
6.8% |
94.4% |
| Musculoskeletal |
| Osteoarthritis (degenerative joint disease) |
4.8 |
11.8 |
9.5 |
5.8 |
47.0 |
| Disorders of intervertebral discs and bones in spinal column (back problems) |
3.5 |
8.5 |
9.3 |
4.1 |
33.2 |
| Genitourinary |
| Acute renal failure |
1.0 |
4.0 |
15.3 |
2.5 |
56.5 |
| Injury and poisoning |
| Complication of device, implant or graft |
5.6 |
9.9 |
5.8 |
3.5 |
30.1 |
| Complication of surgical procedures or medical care |
2.9 |
5.4 |
6.2 |
2.0 |
17.1 |
| Respiratory |
| Respiratory failure |
3.3 |
7.8 |
8.8 |
3.6 |
52.8 |
| Perinatal (newborns) |
| Liveborn (newborn infant) |
8.1 |
12.7 |
4.6 |
3.8 |
80.3 |
| Circulatory |
| Congestive heart failure |
6.8 |
10.5 |
4.5 |
3.0 |
21.1 |
| Cardiac dysrhythmias (irregular heart beat) |
3.6 |
6.7 |
6.4 |
2.5 |
17.5 |
† Adjusted for inflation using the GDP deflator (http://www.bea.gov/national/nipaweb/SelectTable.asp, Table 1.1.4. Price Indexes for Gross Domestic Product).
Source: AHRQ, Center for Delivery, Organization, and Markets, Healthcare Cost and Utilization Project, Nationwide Inpatient Sample, 1997 and 2007. |
Ten specific CCS conditions with the greatest increase in costs drove more than one-third (38 percent) of the overall hospitalization inflation-adjusted cost increase between 1997 and 2007. In several body system or condition categories, a single condition was responsible for most of the growth for the entire body system.
- The cost of hospital stays for septicemia tripled—from $4.1 billion in 1997 to $12.3 billion in 2007. Septicemia was responsible for 7 percent of the increase in costs across all hospitalizations and for 94 percent of the increase in costs of infectious and parasitic conditions.
- Similarly, costs for osteoarthritis and back problems more than doubled, together contributing 10 percent to the growth in costs across all hospitalizations. Osteoarthritis accounted for 47 percent and back problems for 33 percent of the growth in costs for musculoskeletal conditions.
- Costs of hospitalizations for acute renal failure increased from $1 billion in 1997 to $4 billion in 2007, at an average annual growth rate of 15 percent. These hospitalizations accounted for 2.5 percent of the growth in aggregate costs and 57 percent of the growth in genitourinary costs during this period.
- Almost half of the increase (47 percent) in the costs of hospital stays for injury and poisoning were driven by two conditions: complication of device, implant or graft and complication of surgical procedures or medical care. Growth in the costs of stays for these two conditions contributed 5.5 percent to the total growth in hospitalization costs.
Previous Next