TABLE OF CONTENTS
HIGHLIGHTS
INTRODUCTION
HCUP PARTNERS
1. OVERVIEW
2. DIAGNOSES
3. PROCEDURES
4. COSTS
5. PAYERS
SOURCES/METHODS
DEFINITIONS
FOR MORE INFO
ACKNOWLEDGMENTS
CITATION
FACTS & FIGURES 2007 PDF
|
EXHIBIT 2.1 Most Frequent Principal Diagnoses PDF
Number of Discharges, Percent Distribution, Rank, and Growth of the Most Frequent Principal CCS Diagnoses for Inpatient Hospital Stays, 1997 and 2007
| PRINCIPAL CCS DIAGNOSIS |
NUMBER OF DISCHARGES IN THOUSANDS |
PERCENT OF DISCHARGES |
RANK1 |
CUMULATIVE GROWTH |
| 1997 |
2007 |
1997 |
2007 |
1997 |
2007 |
1997-2007 |
| All discharges |
34,679 |
39,542 |
100.0% |
100.0% |
— |
— |
14% |
| Chronic conditions† |
13,778 |
14,447‡ |
39.7 |
36.5 |
— |
— |
5 |
| Pregnancy, childbirth, and newborn infants |
8,236 |
9,732 |
23.7 |
24.6 |
— |
— |
18 |
| All maternal discharges* |
4,338 |
5,031 |
12.5 |
12.7 |
— |
— |
16 |
| Trauma to external female genitals (vulva) and area between anus and vagina (perineum) due to childbirth |
713 |
868 |
2.1 |
2.2 |
— |
— |
22 |
| Previous C-section |
271 |
562 |
0.8 |
1.4 |
— |
— |
107 |
| Normal pregnancy and/or delivery |
544 |
312 |
1.6 |
0.8 |
— |
— |
-43 |
| Prolonged pregnancy |
§ |
276 |
§ |
0.7 |
— |
— |
§ |
| Fetal distress and abnormal forces of labor |
§ |
246 |
§ |
0.6 |
— |
— |
§ |
| Hypertension complicating pregnancy, childbirth and the puerperium (high blood pressure during pregnancy) |
185 |
238 |
0.5 |
0.6 |
— |
— |
28 |
| Early or threatened labor |
261 |
235‡ |
0.8 |
0.6 |
— |
— |
-10 |
| Umbilical cord complication |
259 |
219 |
0.7 |
0.6 |
— |
— |
-15 |
| Polyhydramnios and other problems of amniotic cavity (excess amniotic fluid and other problems of amniotic cavity) |
202 |
209‡ |
0.6 |
0.5 |
— |
— |
3 |
| All infant discharges |
3,898 |
4,701 |
11.2 |
11.9 |
— |
— |
21 |
| Pneumonia |
1,232 |
1,172 |
3.6 |
3.0 |
2 |
1 |
-5 |
| Congestive heart failure |
991 |
1,025‡ |
2.9 |
2.6 |
3 |
2 |
3 |
| Coronary atherosclerosis (coronary artery disease) |
1,407 |
964 |
4.1 |
2.4 |
1 |
3 |
-31 |
| Osteoarthritis (degenerative joint disease) |
418 |
815 |
1.2 |
2.1 |
15 |
4 |
95 |
| Non-specific chest pain |
538 |
788 |
1.6 |
2.0 |
9 |
5 |
47 |
| Mood disorders (depression and bipolar disorder) |
641 |
774 |
1.8 |
2.0 |
5 |
6 |
21 |
| Cardiac dysrhythmias (irregular heart beat) |
572 |
731 |
1.7 |
1.8 |
7 |
7 |
28 |
| Septicemia (blood infection) |
413 |
675 |
1.2 |
1.7 |
16 |
8 |
63 |
| Disorders of intervertebral discs and bones in spinal column (back problems) |
536 |
634 |
1.5 |
1.6 |
10 |
9 |
18 |
| Acute myocardial infarction (heart attack) |
732 |
625 |
2.1 |
1.6 |
4 |
10 |
-15 |
| Acute cerebrovascular disease |
616 |
527 |
1.8 |
1.3 |
6 |
15 |
-14 |
| Chronic obstructive pulmonary disease and bronchiectasis |
551 |
593 |
1.6 |
1.5 |
8 |
13 |
8 |
1Rankings for principal diagnoses other than pregnancy, childbirth, or newborn infant.
— Rank not applicable.
† Includes the number of discharges with a principal diagnosis that is considered to be a chronic condition.
‡ 2007 discharges are not statistically different from 1997 discharges at p‹0.05.
* Includes additional maternal CCS diagnoses not shown on this table but listed in the Sources and Methods of this report.
§ Consistent data are not available for this diagnosis due to coding changes that took place between 1997 and 2007.
Source: AHRQ, Center for Delivery, Organization, and Markets, Healthcare Cost and Utilization Project, Nationwide Inpatient Sample, 1997 and 2007. |
In 2007, there were 39.5 million hospital stays, an increase of 14 percent since 1997. Trends in these stays are displayed for chronic conditions, for pregnancy, childbirth and newborn infants, and for specific other conditions.
Chronic conditions:
- Chronic conditions were the main reason for 40 percent of all hospitalizations in 1997 and for 37 percent in 2007.
- The number of discharges with principal chronic condition diagnoses remained relatively stable between 1997 and 2007, despite the growth in discharges overall (up 14 percent).
Pregnancy, childbirth, and newborn infants:
- Conditions related to pregnancy, childbirth, and newborn infants were by far the most frequent reasons for hospitalization, accounting for 25 percent of discharges (nearly one in four) in 2007.
- There were 5.0 million maternal discharges in 2007, a 16-percent increase since 1997. Not all of these maternal discharges involved the birth of an infant; some dealt with complications during pregnancy.
- The most common principal diagnosis among maternal discharges was trauma to external female genitals during childbirth, which increased 22 percent between 1997 and 2007.
- Stays for normal pregnancy declined by 43 percent from 1997 to 2007. More maternal stays in 2007 had a principal diagnosis that indicated some problem in pregnancy or delivery than in 1997.
- In contrast, the principal diagnosis of previous C-section increased 107 percent between 1997 and 2007.
- Stays with a principal diagnosis of high blood pressure during pregnancy increased by 28 percent between 1997 and 2007.
- Stays with a principal diagnosis of umbilical cord complications declined by 15 percent.
- There were 4.7 million infant discharges in 2007, a 21-percent increase since 1997.
CCS principal diagnoses:
- The 10 most frequently occurring principal diagnoses outside of pregnancy, childbirth and newborn infants accounted for about one-fifth of all discharges in 2007.
- Pneumonia (3.0 percent of all discharges) and congestive heart failure (2.6 percent) were the most common principal diagnoses.
- Two of the 10 most frequent principal diagnoses in 2007 were not among the most frequent diagnoses in 1997, but were added to the list because of their rapid growth. Stays for treatment of osteoarthritis (degenerative joint disease) increased 95 percent over the 1997-2007 period. Similarly, septicemia discharges increased by 63 percent.
- Five circulatory diseases—congestive heart failure, coronary artery disease, non-specific chest pain, irregular heartbeat, and acute myocardial infarction (heart attack)—were among the top 10 most frequent principal diagnoses in 2007.
- Stays for non-specific chest pain increased 47 percent between 1997 and 2007 while those for irregular heart beat increased 28 percent. Stays for coronary artery disease declined 31 percent and for heart attack by 15 percent. Stays for congestive heart failure changed very little from 1997 to 2007.
- Two conditions were among the top 10 in 1997, but were not among the top 10 conditions in 2007.
- Hospital stays for acute cerebrovascular disease declined 14 percent. This condition ranked 6th in 1997, but dropped to 15th by 2007.
- Chronic obstructive pulmonary disease ranked 8th among the most common conditions in 1997. Discharges with this diagnosis increased by 42,000 between 1997 and 2007, but still dropped in rank to 13th.

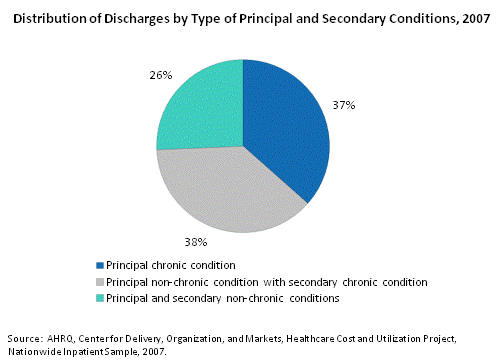
Distribution of discharges by type of principal and secondary conditions, 2007. Pie chart. Principal chronic condition: 37%; principal non-chronic condition with secondary chronic condition: 38%; principal and secondary non-chronic conditions: 26%.
A chronic condition is defined as a condition that lasts 12 months or longer and limits an individual’s self-care, independent living, and social interactions or results in the need for ongoing intervention with medical products, services, and special equipment.1 More than 40 percent of the non-institutionalized population has at least one chronic condition—a share that has risen over time, particularly in the mid to older age population.2 The incidence of chronic conditions and the ability to manage these conditions in an outpatient setting will determine the extent to which chronic conditions are the cause or contributing diagnosis for hospital stays.
- Chronic conditions3 were a principal or secondary diagnosis for 74 percent of all hospital stays in 2007.
- Thirty-seven percent of all discharges had a principal chronic condition.
- Another 38 percent of all discharges had a secondary chronic condition that could complicate treatment and recovery for an acute condition (the reason for the hospital stay).
- Hospital stays with no mention of a chronic condition on the discharge record accounted for just 26 percent of all stays.

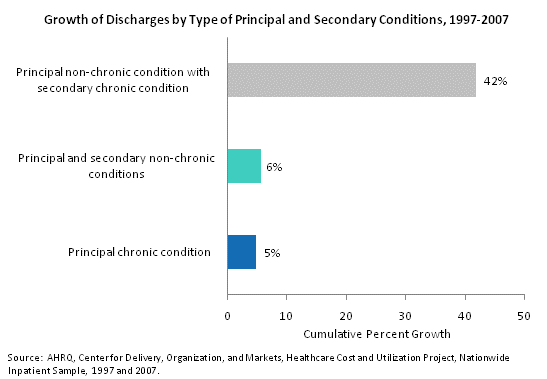
Growth of discharges by type of principal and secondary conditions, 1997 through 2007. Bar chart. Cumulative percent growth. Principal non-chronic condition with secondary chronic condition: 42%; principal and secondary non-chronic conditions: 6%; principal chronic condition: 5%.
Increasingly in recent years, persons with chronic conditions have difficulty paying for care, which can result in hospitalizations when care is delayed and medicines are not purchased because of concerns about cost.4
- Hospital stays for principal non-chronic conditions with a noted secondary chronic condition grew by 42 percent between 1997 and 2007.
- During the same period, hospital stays with a principal chronic condition or with no mention of chronic conditions remained relatively unchanged.
- There are a number of possible reasons why the growth in discharges with secondary chronic conditions is outpacing other discharge types, including increased reporting of secondary chronic conditions and a rise in the incidence of chronic conditions.
1Perrin EC, Newacheck P, Pless IB, Drotar D, Gortmaker SL, Leventhal J, Perrin JM, Stein RE, Walker DK, Weitzman M. Issues Involved in the Definition and Classification of Chronic Health Conditions. Pediatrics 91(4):787-793, 1993.
2 Paez KA, Zhao L, and Hwang W. Rising Out-Of-Pocket Spending For Chronic Conditions: A Ten-Year Trend. Health Affairs 28(1): 15-25, 2009.
3For more information on the chronic condition tool, see http://www.hcup-us.ahrq.gov/toolssoftware/chronic/chronic.jsp.
4Tu H, Cohen G. Financial and health burdens of chronic conditions grow. Track Report Apr;(24):1-6, 2009.
|