| |
Healthcare Cost and Utilization Project (HCUP): Overview of the HCUP Databases and Resources
Select to access the presentation in PDF format (PDF file, 4 MB).
Slide 1
The Healthcare Cost and Utilization Project (HCUP)
HCUP Overview Presentation
Agency for Healthcare Research and Quality (AHRQ)
|
| |
Slide 2
 Introduction to HCUP
What is HCUP?
|
| |
Slide 3
 The HCUP Partnership
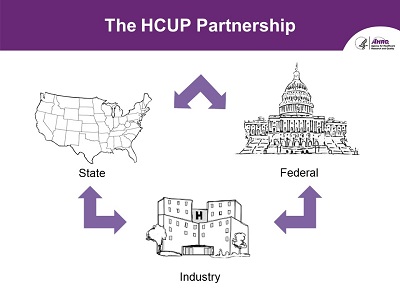
HCUP is a three-way cooperation between States, Federal government, and Industry
|
| |
Slide 4
 Sponsored by the Agency for Healthcare Research and Quality (AHRQ)
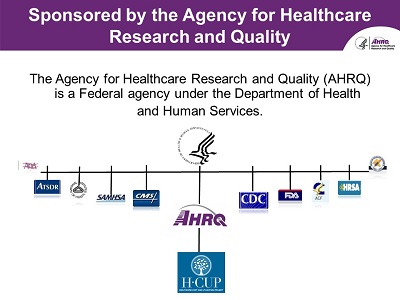
The Agency for Healthcare Research and Quality (AHRQ) is a Federal agency under the Department of Health and Human Services.
|
| |
Slide 5
 Available HCUP Resources
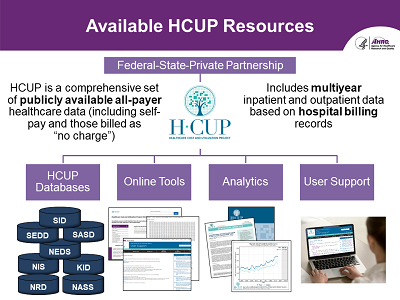
- HCUP is a comprehensive set of publicly available all-payer healthcare data (including self-pay and those billed as 'no charge').
- Includes multiyear inpatient and outpatient data based on hospital billing records.
- Includes:
- HCUP Databases
- Online Tools
- Analytics
- User Support
|
| |
Slide 6
 Research Using HCUP Data
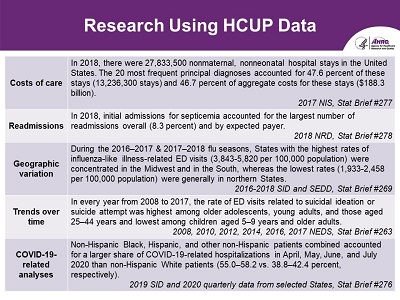
- Costs of care
- In 2018, there were 27,833,500 nonmaternal, nonneonatal hospital stays in the United States. The 20 most frequent principal diagnoses accounted for 47.6 percent of these stays (13,236,300 stays) and 46.7 percent of aggregate costs for these stays ($188.3 billion). 2017 NIS, Stat Brief #277
- Readmissions
- In 2018, initial admissions for septicemia accounted for the largest number of readmissions overall (8.3 percent) and by expected payer. 2018 NRD, Stat Brief #278
- Geographic variation
-
During the 2016-2017 & 2017-2018 flu seasons, States with the highest rates
of influenza-like illness-related ED visits (3,843-5,820 per 100,000 population)
were concentrated in the Midwest and in the South, whereas the lowest rates
(1,933-2,458 per 100,000 population) were generally in northern States. 2016-2018
SID and SEDD, Stat Brief #269
- Trends over time
-
In every year from 2008 to 2017, the rate of ED visits related to suicidal
ideation or suicide attempt was highest among older adolescents, young adults,
and those aged 25-44 years and lowest among children aged 5-9 years and older
adults. 2008, 2010, 2012, 2014, 2016, 2017 NEDS, Stat Brief #263
- COVID-19- related analyses
- Non-Hispanic Black, Hispanic, and other non-Hispanic patients combined accounted for a larger share of COVID-19-related hospitalizations in April, May, June, and July 2020 than non-Hispanic White patients (55.0-58.2 vs. 38.8-42.4 percent, respectively). 2019 SID and 2020 quarterly data from selected States, Stat Brief #276
|
| |
Slide 7
 Research Using HCUP Data (Continued)
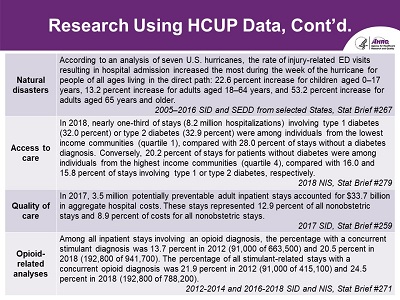
- Natural disasters
- According to an analysis of seven U.S. hurricanes, the rate of injury-related ED visits resulting in hospital admission increased the most during the week of the hurricane for people of all ages living in the direct path: 22.6 percent increase for children aged 0-17 years, 13.2 percent increase for adults aged 18-64 years, and 53.2 percent increase for adults aged 65 years and older. 2005-2016 SID and SEDD from selected States, Stat Brief #267
- Access to care
- In 2018, nearly one-third of stays (8.2 million hospitalizations) involving type 1 diabetes (32.0 percent) or type 2 diabetes (32.9 percent) were among individuals from the lowest income communities (quartile 1), compared with 28.0 percent of stays without a diabetes diagnosis. Conversely, 20.2 percent of stays for patients without diabetes were among individuals from the highest income communities (quartile 4), compared with 16.0 and 15.8 percent of stays involving type 1 or type 2 diabetes, respectively. 2018 NIS, Stat Brief #279
- Quality of care
- In 2017, 3.5 million potentially preventable adult inpatient stays accounted for $33.7 billion in aggregate hospital costs. These stays represented 12.9 percent of all nonobstetric stays and 8.9 percent of costs for all nonobstetric stays. 2017 SID, Stat Brief #259
- Opioid-related stays
- Among all inpatient stays involving an opioid diagnosis, the percentage with a concurrent stimulant diagnosis was 13.7 percent in 2012 (91,000 of 663,500) and 20.5 percent in 2018 (192,800 of 941,700). The percentage of all stimulant-related stays with a concurrent opioid diagnosis was 21.9 percent in 2012 (91,000 of 415,100) and 24.5 percent in 2018 (192,800 of 788,200). 2012-2014 and 2016-2018 SID and NIS, Stat Brief #271
|
| |
Slide 8
 HCUP Data Partners
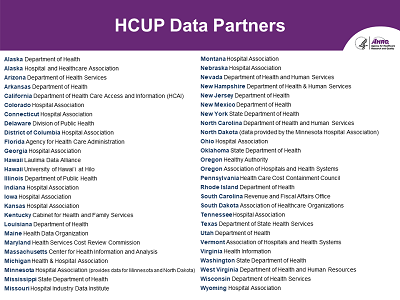
- Alaska Department of Health
- Alaska Hospital and Healthcare Association
- Arizona Department of Health Services
- Arkansas Department of Health
- California Department of Health Care Access and Information (HCAI)
- Colorado Hospital Association
- Connecticut Hospital Association
- Delaware Division of Public Health
- District of Columbia Hospital Association
- Florida Agency for Health Care Administration
- Georgia Hospital Association
- Hawaii Laulima Data Alliance
- Hawaii University of Hawaii at Hilo
- Illinois Department of Public Health
- Indiana Hospital Association
- Iowa Hospital Association
- Kansas Hospital Association
- Kentucky Cabinet for Health and Family Services
- Louisiana Department of Health
- Maine Health Data Organization
- Maryland Health Services Cost Review Commission
- Massachusetts Center for Health Information and Analysis
- Michigan Health and Hospital Association
- Minnesota Hospital Association (provides data for Minnesota and North Dakota)
- Mississippi State Department of Health
- Missouri Hospital Industry Data Institute
- Montana Hospital Association
- Nebraska Hospital Association
- Nevada Department of Health and Human Services
- New Hampshire Department of Health & Human Services
- New Jersey Department of Health
- New Mexico Department of Health
- New York State Department of Health
- North Carolina Department of Health and Human Services
- North Dakota (data provided by the Minnesota Hospital Association)
- Ohio Hospital Association
- Oklahoma State Department of Health
- Oregon Healthy Authority
- Oregon Association of Hospitals and Health Systems
- Pennsylvania Health Care Cost Containment Council
- Rhode Island Department of Health
- South Carolina Revenue and Fiscal Affairs Office
- South Dakota Association of Healthcare Organizations
- Tennessee Hospital Association
- Texas Department of State Health Services
- Utah Department of Health
- Vermont Association of Hospitals and Health Systems
- Virginia Health Information
- Washington State Department of Health
- West Virginia Department of Health and Human Services
- Wisconsin Department of Health Services
- Wyoming Hospital Association
|
| |
Slide 9
 HCUP Partners Providing Inpatient Data
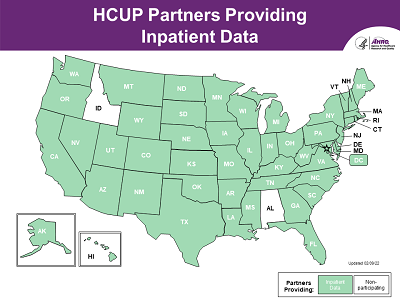
- A map of the United States shows those Partners that participate in HCUP by providing inpatient data. All States are participating except Idaho and Alabama.
- HCUP data are collected on the State-level. All States that participate in HCUP provide us with inpatient data. Currently, we collect data from 48 States and the District of Columbia, representing 97% of the U.S. population and more than 97% of all hospital discharges.
|
| |
Slide 10
 HCUP Partners Providing Ambulatory Surgery and Services Data
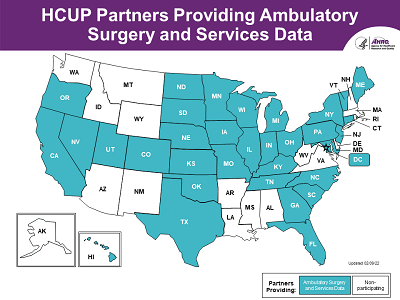
-
A map of the United States shows those 34 Partners that participate in HCUP by providing
ambulatory surgery and services data. States include CA, CO, CT, the District of Columbia
(DC), FL, GA, HI, IA, IL, IN, KS, KY, ME, MD, MI, MN, MO, NC, ND, NE, NJ, NV, NY, OH,
OK, OR, PA, SC, SD, TN, TX, UT, VT, WI.
|
| |
Slide 11
 HCUP Partners Providing Emergency Department Data
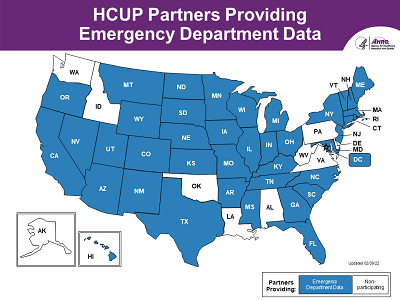
- A map of the United States shows those 41 Partners that participate in HCUP by providing emergency department data. States include AR, AZ, CA, CO, CT, the District of Columbia (DC), FL, GA, HI, IA, IL, IN, KS, KY, MA, MD, ME, MI, MO, MN, MS, MT, NC, ND, NE, NH, NJ, NM, NV, NY, OH, OR, RI, SC, SD, TN, TX, UT, VT, WI, WY.
|
| |
Slide 12
 HCUP Participation by Data Type
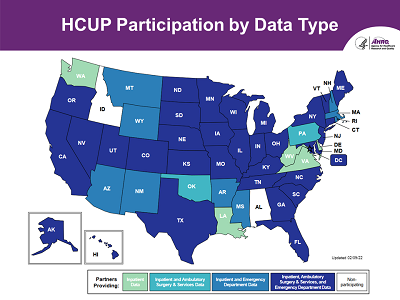
- A map of the United States that shows HCUP participation by State and data type (inpatient, emergency department, and ambulatory surgery & services combined).
|
| |
Slide 13
 Introduction to HCUP
What is the Foundation of HCUP Data?
|
| |
Slide 14
 The Foundation of HCUP Data is Hospital Billing Data
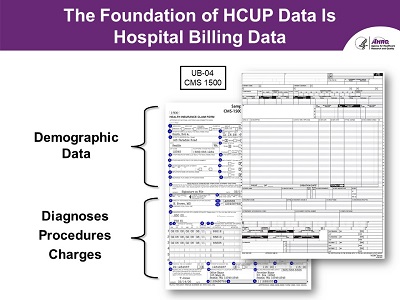
- Screenshots of two examples of patient billing forms in UB-04 and CMS 1500 formats
-
Uniform billing forms, such as the UB-04 and the CMS 1500, are used
by many hospitals and are the basis of HCUP data. These forms contain
the information used in the billing process, which includes the collection
of basic demographic data, such as patient age and sex. More detailed
information about the patient's hospital stay, such as the patient's
diagnosis and the medical procedures performed, as well as facility
charges are also included.
-
So, when thinking about HCUP data, it's important to remember that a large
portion of these data are produced for "billing" purposes and not specifically
to support research or policy development. However, some States add data
elements that are intended to support research and public health, not billing
purposes. The addition of information on race/ethnicity is one example.
|
| |
Slide 15
 From Patient Hospital Visit to Administrative Record
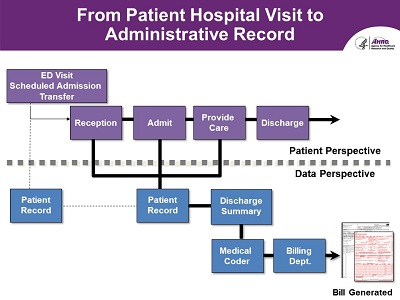
- Visual diagram of patient visit capture into a patient record
-
It is helpful to review an inpatient patient flow diagram-from the patient's
perspective and from a data perspective. From a patient's perspective, a
patient may have been admitted from the emergency department of the same
hospital, had a scheduled admission, or is transferred from another hospital
or emergency department. Once admitted, the patient receives inpatient care
and is discharged.
-
For the purposes of this presentation, it is important to understand this
process from a data perspective, as well. While this perspective varies
by hospital, generally a patient record is created that contains demographic
information about the patient, as well as medical/clinical information about
his or her inpatient services. From that patient record, a discharge summary
is generated and given to a medical coder. The medical coder classifies the
inpatient care into ICD-10-CM/PCS diagnosis and procedure codes. The billing
department then uses the medical codes assigned by the coder to generate a
hospital bill, such as a UB-04 form. The foundation of HCUP data is based on
this type of billing data, also known as administrative data.
|
| |
Slide 16
 The Making of HCUP Data
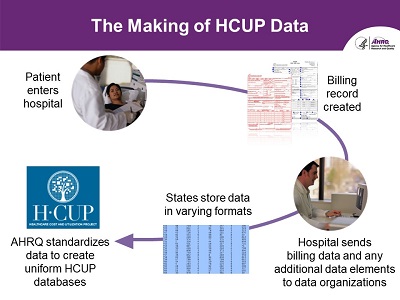
- Patient enters hospital → Billing record created → Hospital sends billing data and any additional data elements to data organizations → States store data in varying formats → AHRQ standardizes data to create uniform HCUP databases
- In general, a patient enters the hospital and a billing record (also called a discharge record) is generated. The hospital may add additional data elements to the record and then the hospital sends the data to their State-level Data Organization. These organizations then store the data in varying formats. From State to State, there is also some significant variation in the definition of data elements. For example, information as simple as sex may be coded in several different ways across the States. So, one of HCUP's most important jobs is the programming effort required to turn data coming from
49 different sources into a uniform collection of information.
|
| |
Slide 17
 The HCUP Data Process
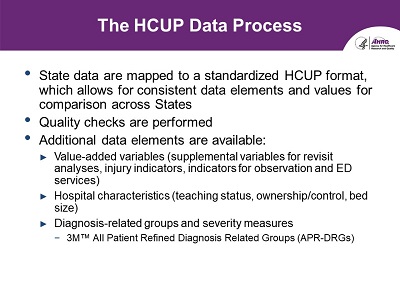
- State data are mapped to a standardized HCUP format, which allows for consistent data elements and values for comparison across States
- Quality checks are performed
- Additional data elements are available:
- Value-added variables (supplemental variables for revisit analyses, injury indicators, indicators for observation and ED services)
- Hospital characteristics (teaching status, ownership/control, bed size)
- Diagnosis-related groups and severity measures
- 3M™ All Patient Refined Diagnosis Related Groups (APR-DRGs)
|
| |
Slide 18
 Introduction to HCUP
What Types of Hospitals are Included in the HCUP Databases?
|
| |
Slide 19
 HCUP Data Come Mostly From Community Hospitals
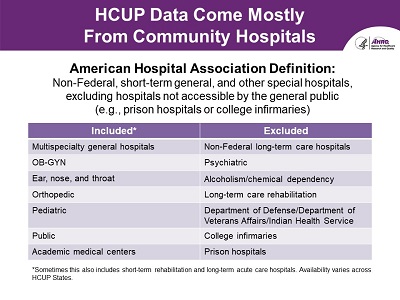
American Hospital Association Definition: Non-Federal, short-term general, and other special hospitals, excluding hospitals not accessible by the general public (e.g., prison hospitals or college infirmaries)
- Included*:
- Multispecialty general hospitals
- OB-GYN
- Ear, nose, and throat
- Orthopedic
- Pediatric
- Public
- Academic medical centers
- Excluded:
- Non-Federal long-term care hospitals
- Psychiatric
- Alcoholism/chemical dependency
- Long-term care rehabilitation
- Department of Defense/Department of Veterans Affairs/Indian Health Services
- College infirmaries
- Prison hospitals
*Sometimes this also includes short-term rehabilitation and long-term acute care hospitals. Availability varies across HCUP States.
|
| |
Slide 20
 Hospitals in the United States
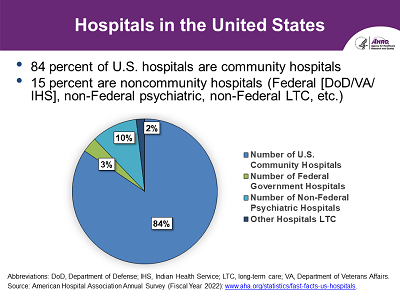
- 84 percent of U.S. hospitals are community hospitals
- 15 percent non-community hospitals (Federal [DoD/VA/IHS], non-Federal psychiatric, non-Federal long-term Care, etc.)
- Abbreviations: DoD, Department of Defense; IHS, Indian Health Service; LTC, long-term care; VA, Department of Veterans Affairs.
Source: American Hospital Association (AHA) Annual Survey, Fiscal Year 2022:
www.aha.org/statistics/fast-facts-us-hospitals
|
| |
Slide 21
 Community Hospitals Provide a Range of Services
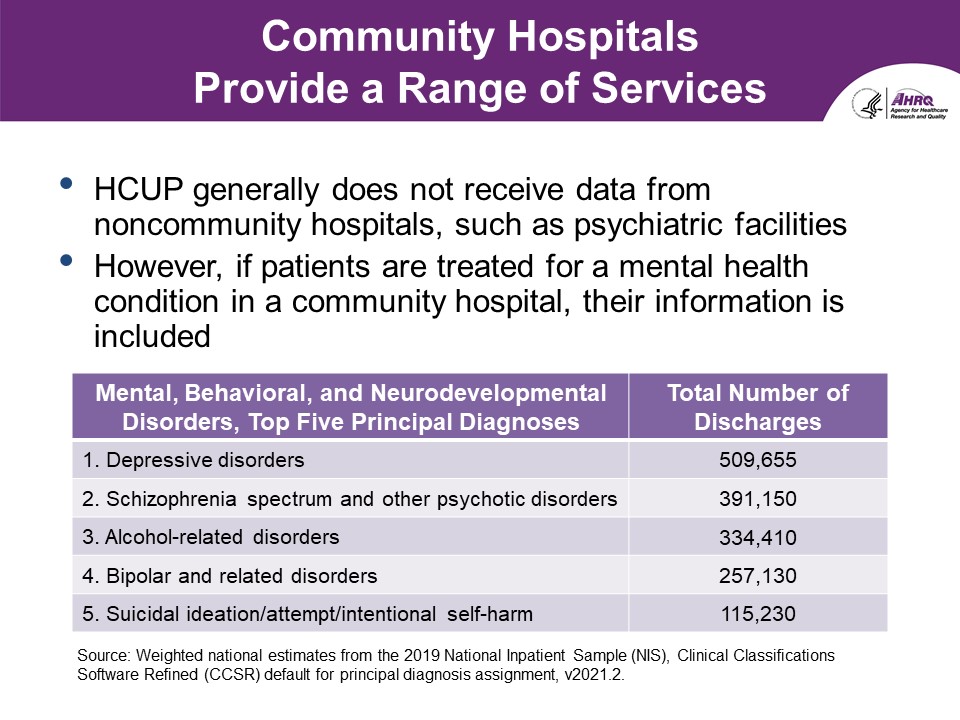
- HCUP generally does not receive data from noncommunity hospitals, such as psychiatric facilities.
- However, if patients are treated for a mental health condition in a community hospital, their information is included.
- Mental, Behavioral, and Neurodevelopmental Disorders, Top Five Principal Diagnoses
- Depressive disorders, Total Number of Discharges: 509,655
- Schizophrenia spectrum and other psychotic disorders, Total Number of Discharges: 391,150
- Alcohol-related disorders, Total Number of Discharges: 334,410
- Bipolar and related disorders, Total Number of Discharges: 257,130
- Suicidal ideation/attempt/intentional self-harm, Total Number of Discharges: 115,230
Source: Weighted national estimates from the 2019 National
Inpatient Sample (NIS), Clinical Classifications Software
Refined (CCSR) default for principal diagnosis assignment,
v2021.2
|
| |
Slide 22
 Overview of the HCUP Databases
What Types of HCUP Databases Are Available?
|
| |
Slide 23
 HCUP Includes Inpatient and Outpatient Databases
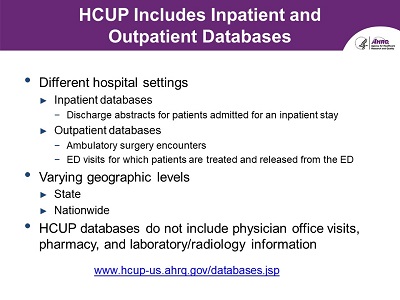
- Different hospital settings
- Inpatient databases
- Discharge abstracts for patients admitted for an inpatient stay
- Outpatient databases
- Ambulatory surgery encounters
- ED visits during which patients are treated and released from the ED
- Varying geographic levels
- HCUP databases do not include physician office visits, pharmacy, and laboratory/radiology information
www.hcup-us.ahrq.gov/databases.jsp
|
| |
Slide 24
 HCUP State Databases
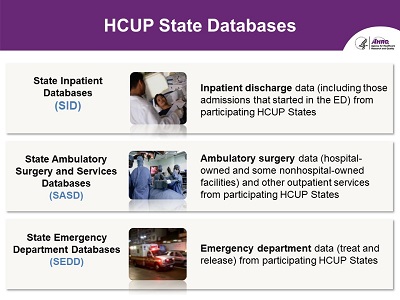
- State Inpatient Databases (SID)
- Inpatient discharge data (including those admissions that started in the ED) from participating HCUP States
- State Ambulatory Surgery and Services Databases (SASD)
-
Ambulatory surgery data (hospital-owned and some nonhospital-owned
facilities) and other outpatient services from participating HCUP States
- State Emergency Department Databases (SEDD)
- Emergency department data (treat and release) from participating HCUP States
|
| |
Slide 25
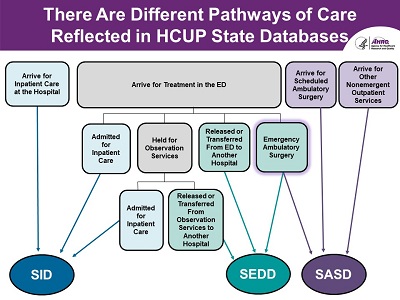 There Are Different Pathways of Care Reflected in HCUP State Databases
- Visual diagram on this slide provides a depiction of the pathways of care that are reflected in the HCUP State Databases.
-
Now that we have defined each of the HCUP State Databases, let's
take a moment to understand the types of records they include. On
this slide is a diagram that provides a depiction of the pathways
of care that are reflected in the HCUP State Databases.
-
The SID, represented with the blue oval on the slide, includes three pathways of care:
- Patients arrive for inpatient care at the hospital, either direct admission or transfer from another hospital
- Patients who initially were seen in the emergency department, but later admitted as an inpatient to the same hospital
- Patients who initially were seen in the emergency department, were held for observations services, and then later admitted as an inpatient to the same hospital.
-
In the SEDD, represented with the green oval on the slide, there are also three pathways of care:
- Patients who arrive for treatment in the emergency department and are either released or transferred from that ED to another hospital
- Patients who arrive for treatment in the emergency department, were held for observation services, and then released or transferred from that ED to another hospital
-
Patients who arrive for treatment in the emergency department and then undergo
emergency ambulatory surgery. The same record is also included in the SASD,
which is represented with the purple oval.
-
The SASD also includes two additional pathways of care:
- Patients scheduled for an ambulatory surgery
- Patients with non-emergent outpatient services
|
| |
Slide 26
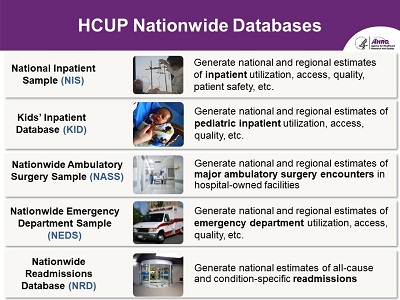 HCUP Nationwide Databases
-
National Inpatient Sample (NIS)
- Generate national and regional estimates of inpatient utilization, access, quality, patient safety, etc.
-
Kids' Inpatient Database (KID)
- Generate national and regional estimates of pediatric inpatient utilization, access, quality, etc.
-
Nationwide Ambulatory Surgery Sample (NASS)
- Generate national and regional estimates of major ambulatory surgery encounters in hospital-owned facilities
-
Nationwide Emergency Department Sample (NEDS)
- Generate national and regional estimates of emergency department utilization, access, quality, etc.
-
Nationwide Readmissions Database (NRD)
- Generate national estimates of all-cause and condition-specific readmissions
|
| |
Slide 27
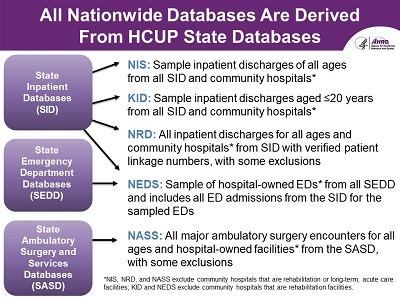 All Nationwide Databases Are Derived from HCUP State Databases
-
State Inpatient Databases (SID)
- NIS: Sample inpatient discharges of all ages from all SID and community hospitals*
- KID: Sample inpatient discharges aged ≤ 20 years old from all SID and community hospitals*
- NRD: All inpatient discharges for all ages and community hospitals* from SID with verified patient linkage numbers, with some exclusions
- NEDS: Sample of hospital-owned EDs* from all SEDD and includes all ED admissions from the SID for the sampled EDs
-
State Emergency Department Databases (SEDD)
- NEDS: Sample of hospital-owned EDs* from all SEDD and includes all ED admissions from the SID for the sampled EDs
-
State Ambulatory Surgery and Services Databases (SASD)
- NASS: All major ambulatory surgery encounters for all ages and hospital-owned facilities* from the SASD, with some exclusions
* NIS, NRD, and NASS exclude community hospitals that are rehabilitation or long-term,
acute-care facilities; KID and NEDS exclude community hospitals that are rehabilitation facilities.
|
| |
Slide 28
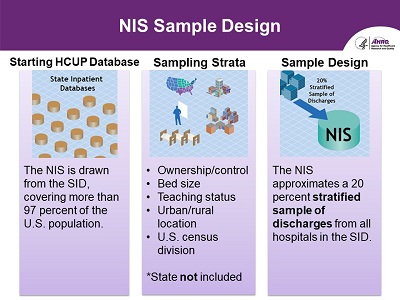
-
Starting HCUP Database
- The NIS is drawn from the SID, covering more than 97 percent of the U.S. population.
-
Sampling Strata
- Ownership/control
- Bed side
- Teaching status
- Urban/rural location
- U.S. census division
- *State not included
-
Sample Design
- The NIS approximates a 20 percent stratified sample of discharges from all hospitals in the SID.
|
| |
Slide 29
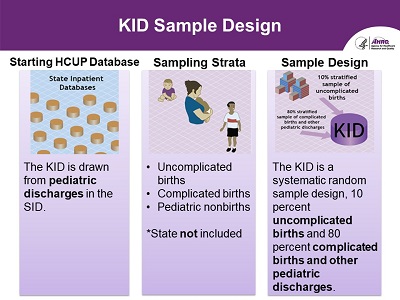 KID Sample Design
-
Starting HCUP Database
- The KID is drawn from pediatric discharges in the SID.
-
Sampling Strata
- Uncomplicated births
- Complicated births
- Pediatric nonbirths
- *State not included
-
Sample Design
- The KID is a systematic random sample design, 10 percent uncomplicated births and 80 percent complicated births and other pediatric discharges.
|
| |
Slide 30
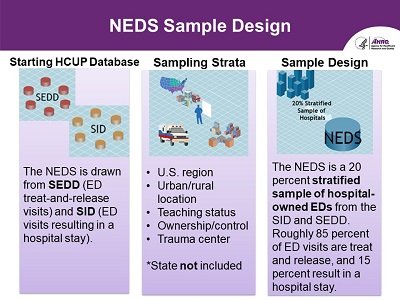 NEDS Sample Design
-
Starting HCUP Database
- The NEDS is drawn from the SEDD (ED treat-and-release visits) and SID (ED visits resulting in a hospital stay).
-
Sampling Strata
- U.S. region
- Urban/rural location
- Teaching status
- Ownership/control
- Trauma center
- *State not included
-
Sample Design
-
The NEDS is a 20 percent stratified sample of hospital-owned EDs from the
SID and SEDD. Roughly 85 percent of ED visits are treat-and-release, and
15 percent results in a hospital stay.
|
| |
Slide 31
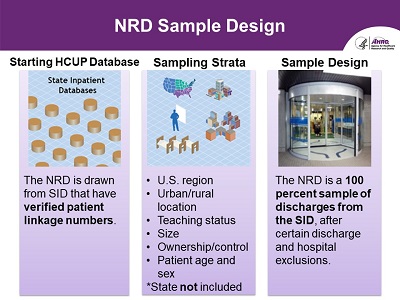 NRD Sample Design
-
Starting HCUP Database
- The NRD is drawn from SID that have verified patient linkage numbers.
-
Sampling Strata
- U.S. region
- Urban/rural location
- Teaching status
- Size
- Ownership/control
- Patient age and sex
- *State not included
-
Sample Design
- The NRD is a 100 percent sample of discharges from the SID, after certain discharge and hospital exclusions.
|
| |
Slide 32
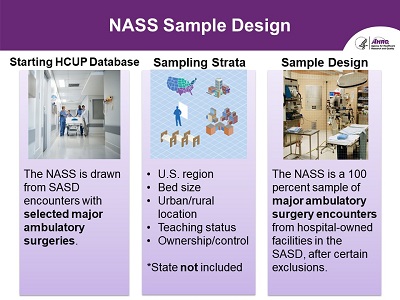 NASS Sample Design
-
Starting HCUP Database
- The NASS is drawn from SASD encounters with selected major ambulatory surgeries.
-
Sampling Strata
- U.S. region
- Bed size
- Urban/rural location
- Teaching status
- Ownership/control
- *State not included
-
Sample Design
-
The NASS is a 100 percent sample of major ambulatory surgery encounters
from hospital-owned facilities in the SASD, after certain exclusions.
|
| |
Slide 33
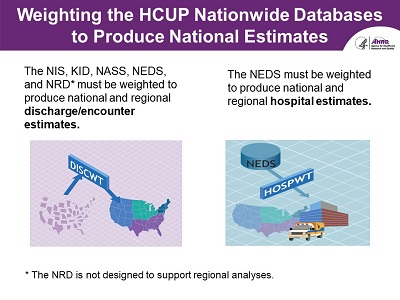 Weighting the HCUP Nationwide Databases to Produce National Estimates
- The NIS, KID, NASS, NEDS, and NRD* must be weighted to produce national and regional discharge/encounter estimates.
- The NEDS must be weighted to produce national and regional hospital estimates.
*The NRD is not designed to support regional analyses.
|
| |
Slide 34
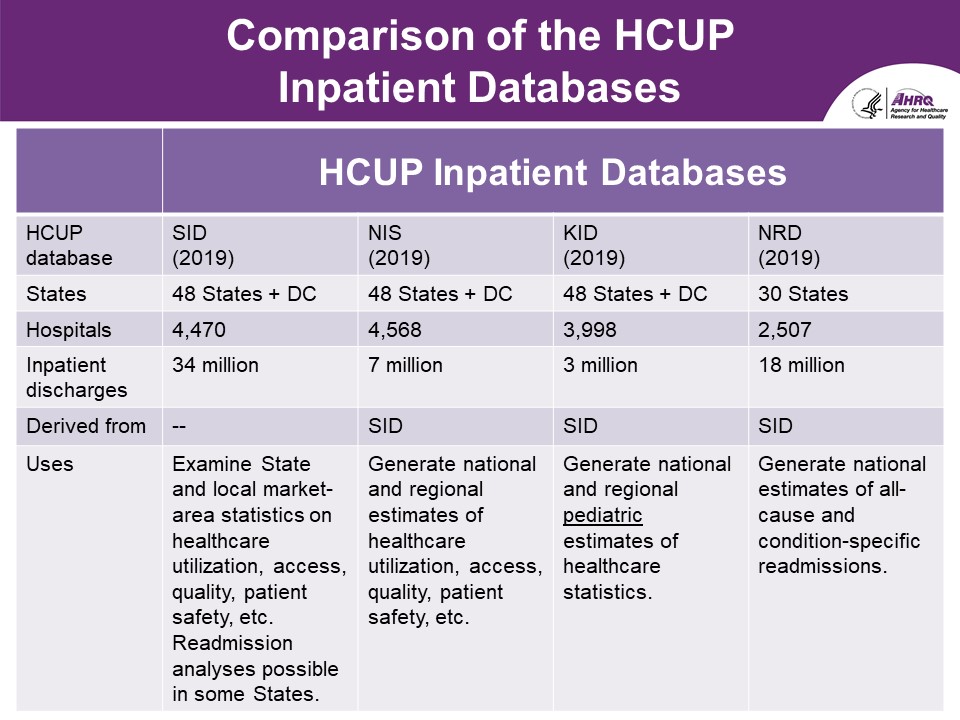 Comparison of the HCUP Inpatient Databases
| |
State Inpatient Databases |
National Inpatient Sample |
Kids' Inpatient Database |
Nationwide Readmissions Database |
| HCUP Database |
SID (2019) |
NIS (2019) |
KID (2019) |
NRD (2019) |
| States |
48 States + DC |
48 States + DC |
48 States + DC |
30 States |
| Hospitals |
4,470 |
4,568 |
3,998 |
2,507 |
| Inpatient Discharges |
34 million |
7 million |
3 million |
18 million |
| Derived From |
- |
SID |
SID |
SID |
| Uses |
Examine State and local market area statistics on healthcare
utilization, access, quality, patient safety, etc. Readmission
analyses possible in some States.
|
Generate national and regional estimates of healthcare
utilization, access, quality, patient safety, etc.
|
Generate national and regional pediatric estimates of
healthcare statistics.
|
Generate national estimates of all-cause and condition-specific
readmissions.
|
|
| |
Slide 35
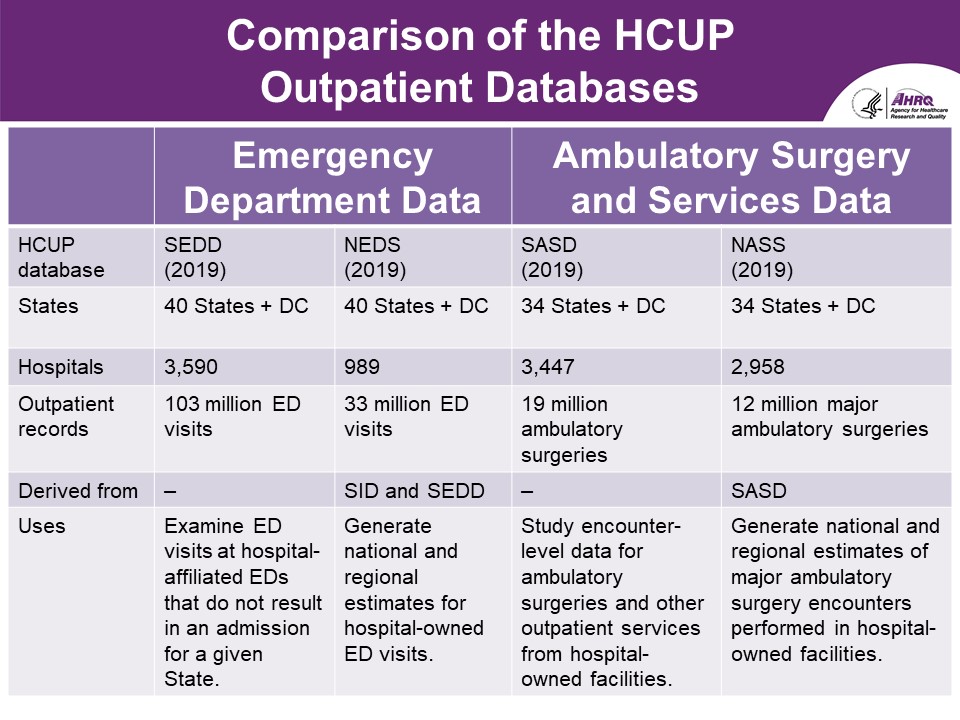 Comparison of the HCUP Outpatient Databases
| |
Emergency Department Data |
Ambulatory Surgery and Services Data |
| HCUP Database |
SEDD (2019) |
NEDS (2019) |
SASD (2019) |
NASS (2019) |
| States |
40 States + DC |
40 States + DC |
34 States + DC |
34 States + DC |
| Hospitals |
3,590 |
989 |
3,447 |
2,958 |
| Outpatient Records |
103 million ED visits |
33 million ED visits |
19 million ambulatory surgeries |
12 million major ambulatory surgeries |
| Derived from |
- |
SID and SEDD |
- |
SASD |
| Uses |
Examine ED visits at hospital-affiliated EDs that do not result in an admission for a given State. |
Generate national and regional estimates for hospital-owned ED visits. |
Study encounter-level data for ambulatory surgeries and other outpatient services from hospital-owned facilities. |
Generate national and regional estimates of major ambulatory surgery encounters performed in hospital-owned facilities. |
|
| |
Slide 36
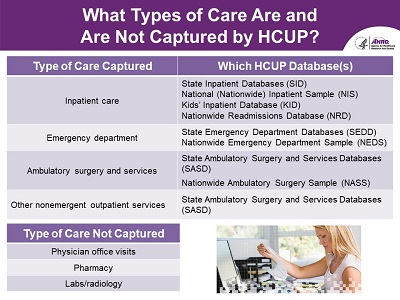 What Types of Care Are and Are Not Captured by HCUP?
-
Type of Care Captured:
-
Inpatient care
- Which HCUP Database(s):
- State Inpatient Databases (SID)
- National (Nationwide) Inpatient Sample (NIS)
- Kids' Inpatient Database (KID)
- Nationwide Readmissions Database (NRD)
-
Emergency department
- Which HCUP Database(s):
- State Emergency Department Databases (SEDD)
- Nationwide Emergency Department Sample (NEDS)
-
Ambulatory surgery and services
- Which HCUP Database(s):
- State Ambulatory Surgery and Services Databases (SASD)
- Nationwide Ambulatory Surgery Sample (NASS)
-
Other nonemergent outpatient services
- Which HCUP Database(s):
- State Ambulatory Surgery and Services Databases (SASD)
Type of Care Not Captured:
- Physician office visits
- Pharmacy
- Labs/radiology
|
| |
Slide 37
 Benefits and Limitations of HCUP Databases
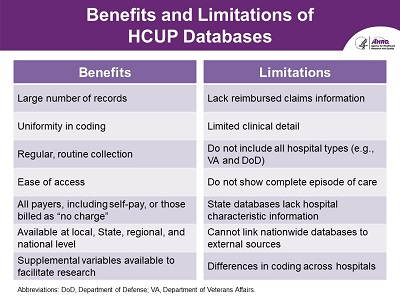
-
Benefits
- Large number of records
- Uniformity in coding
- Regular, routine collection
- Ease of access
- All payers, including self-pay or those billed as 'no charge'
- Available at local, State, regional, and national level
- Supplemental variables available to facilitate research
-
Limitations
- Lack reimbursed claims information
- Limited clinical detail
- Do not include all hospital types (e.g., VA and DoD)
- Do not show complete episode of care
- State databases lack hospital characteristic information
- Cannot link nationwide databases to external sources
- Differences in coding across hospitals
Abbreviations: DoD, Department of Defense; VA, Department of Veterans Affairs.
|
| |
Slide 38
 Overview of the HCUP Databases
What Data Elements Are Available in the HCUP Databases?
|
| |
Slide 39
 Data Elements Common to the HCUP Databases
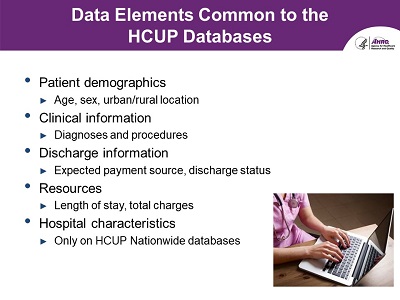
-
Patient demographics
- Age, sex, urban/rural location
-
Clinical information
-
Discharge information
- Expected payment source, discharge status
-
Resources
- Length of stay, total charges
-
Hospital characteristics
- Only on HCUP Nationwide databases
|
| |
Slide 40
 Some Data Elements Vary by State
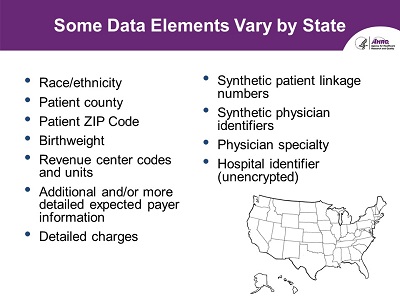
- Race/ethnicity
- Patient county
- Patient ZIP Code
- Birthweight
- Revenue center codes and units
- Additional and/or more detailed expected payer information
- Detailed charges
- Synthetic patient linkage numbers
- Synthetic physician identifiers
- Physician specialty
- Hospital identifier (unencrypted)
|
| |
Slide 41
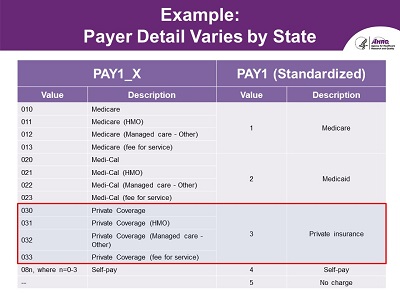 Example: Payer Detail Varies by State
A screenshot shows the different values and descriptions for the variable PAY1_X and PAY1 (Standardized).
|
| |
Slide 42
 Overview of HCUP Databases
Interested in Purchasing an HCUP Database?
|
| |
Slide 43
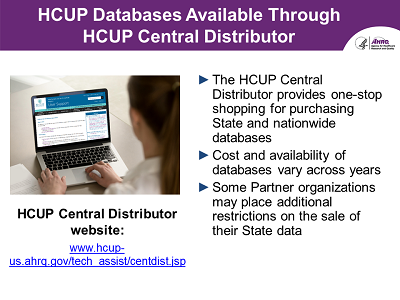 HCUP Databases Available Through HCUP Central Distributor
-
HCUP Central Distributor website:
www.hcup-us.ahrq.gov/tech_assist/centdist.jsp
- The Central Distributor provides one-stop shopping for purchasing State and nationwide databases.
- Cost and availability of databases vary across years
- Some Partner organizations may place additional restrictions on the sale of their State data.
|
| |
Slide 44
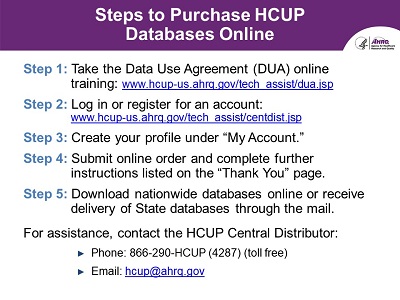 Steps to Purchase HCUP Databases Online
-
Step 1: Take the Data Use Agreement (DUA) online training:
-
Step 2: Log in or register for an account
- Step 3: Create your profile under "My Account."
- Step 4: Submit online order and complete further instructions listed on the "Thank You" page.
- Step 5: Download nationwide databases online or receive delivery of State databases through the mail.
-
For assistance, contact the HCUP Central Distributor:
|
| |
Slide 45
 Additional Requirement: Electronic DUA Course
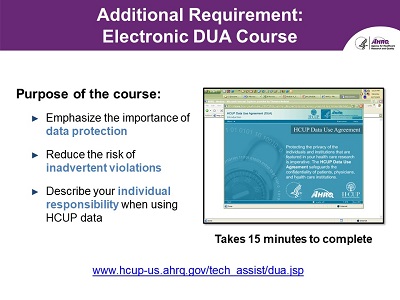
-
Purpose of the course:
- Emphasize the importance of data protection
- Reduce the risk of inadvertent violations
- Describe your individual responsibility when using HCUP data
Takes 15 minutes to complete
www.hcup-us.ahrq.gov/tech_assist/dua.jsp
|
| |
Slide 46
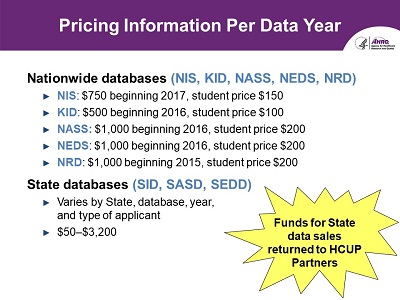 Pricing Information Per Data Year
-
Nationwide Databases (NIS, KID, NASS, NEDS, NRD)
- NIS: $750 beginning 2017, student price $150
- KID: $500 beginning 2016, student price $100
- NASS: $1,000 beginning 2016, student price $200
- NEDS: $1,000 beginning 2016, student price $200
- NRD: $1,000 beginning 2015, student price $200
-
State Databases (SID, SASD, SEDD)
- Varies by State, database, year, and type of applicant
- $50 - $3,200
Funds for State data sales returned to HCUP Partners
|
| |
Slide 47
 Partners Releasing Databases Through HCUP Central Distributor
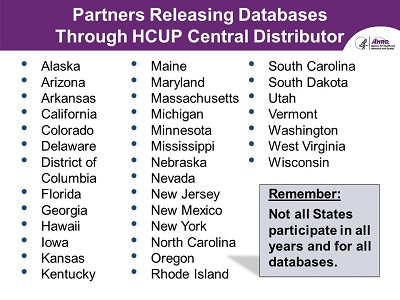
- Alaska
- Arizona
- Arkansas
- California
- Colorado
- Delaware
- District of Columbia
- Florida
- Georgia
- Hawaii
- Iowa
- Kansas
- Kentucky
- Maine
- Maryland
- Massachusetts
- Michigan
- Minnesota
- Mississippi
- Nebraska
- Nevada
- New Jersey
- New Mexico
- New York
- North Carolina
- Oregon
- Rhode Island
- South Carolina
- South Dakota
- Utah
- Vermont
- Washington
- West Virginia
- Wisconsin
Remember: Not all States participate in all years and for all databases.
|
| |
Slide 48
 Software Requirements for Working With the Full HCUP Files
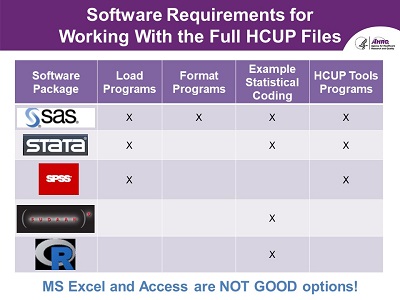
-
Software Package:
-
SAS
- Load programs
- Format programs
- Example Statistical Coding
- HCUP Tools Programs
-
STATA
- Load programs
- Example Statistical Coding
- HCUP Tools Programs
-
SPSS
- Load programs
- HCUP Tools Programs
-
SUDAAN
- Example Statistical Coding
-
R
- Example Statistical Coding
Microsoft Excel and Access are NOT GOOD options!
|
| |
Slide 49
 Overview of HCUP Resources
What Types of Online Resources Does HCUP Have Available?
|
| |
Slide 50
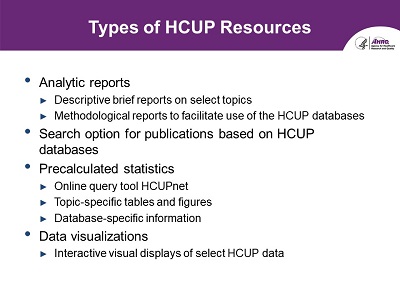 Types of HCUP Resources
-
Analytic reports
- Descriptive brief reports on select topics
- Methodological reports to facilitate use of the HCUP databases
- Search option for publications based on HCUP databases
-
Pre-calculated statistics
- Online query tool HCUPnet
- Topic-specific tables and figures
- Database-specific information
-
Data visualizations
- Interactive visual displays of select HCUP data
|
| |
Slide 51
 Analytic Reports
What Types of Analytic Reports Does HCUP Offer?
|
| |
Slide 52
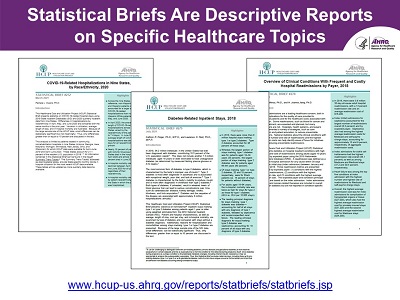 Statistical Briefs Are Descriptive Reports on Specific Healthcare Topics
- Screenshots of three HCUP statistical briefs.
-
www.hcup-us.ahrq.gov/reports/statbriefs/statbriefs.jsp
-
HCUP Statistical Briefs are descriptive reports on specific healthcare topics
related to specific conditions, procedures, or populations. Statistical
Briefs are useful to a wide variety of audiences, including policy analysts,
decision makers, media personnel, and others in need of summary facts and
figures on current healthcare issues.
-
To date, AHRQ has released 302 Statistical Briefs spanning a range of topics.
More recent topics focus on COVID-19-related hospitalizations, trends in
opioid-related and stimulant-related inpatient stays and ED visits, and
cancer-related hospitalizations for adults.
|
| |
Slide 53
 HCUP Findings-At-A-Glance Are Focused Reports on Select Topics
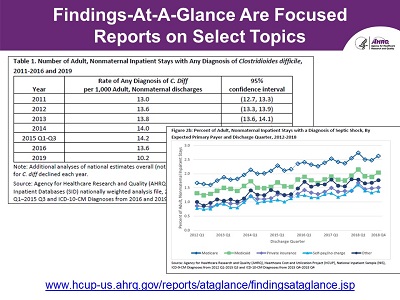
- Screenshots of a table and graph from two HCUP Findings-At-A-Glance Reports
-
www.hcup-us.ahrq.gov/reports/ataglance/findingsataglance.jsp
-
HCUP Findings-At-A-Glance descriptive reports on specific healthcare topics
related to specific conditions, procedures, or populations. Statistical
Briefs are useful to a wide variety of audiences, including policy analysts,
decision makers, media personnel, and others in need of summary facts and
figures on current healthcare issues.
|
| |
Slide 54
 HCUP Methods Series Reports Provide Technical Guidance on Using HCUP Data
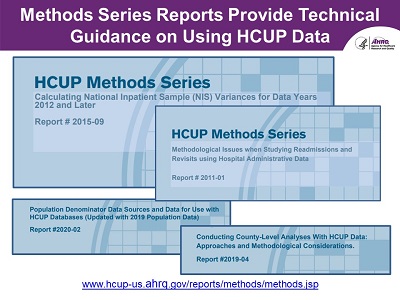
- Screenshots of four HCUP Methods Series Report topics
-
www.hcup-us.ahrq.gov/reports/methods/methods.jsp
-
The HCUP Methods Series Reports feature a broad array of methodological
information on the HCUP databases and software tools. Some examples include:
- Calculating Variances when using the NIS (also available for the NRD and SID)
- Studying readmissions
- Population denominator data sources
- And conducting county-level analyses with HCUP data
|
| |
Slide 55
 Search Option for Publications That Use HCUP Databases
What is the HCUP Publications Search?
|
| |
Slide 56
 Search for Publications Using HCUP Databases
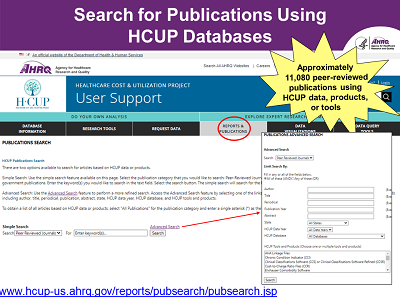
-
Screenshot of the Publications Search home page on the HCUP-US website that features a page
where users can search for publications that involve HCUP databases or products. The
advanced search allows users to search by a variety of fields, such as title, abstract,
publication, HCUP database, data year, or State.
-
www.hcup-us.ahrq.gov/reports/pubsearch/pubsearch.jsp
- Approximately 12,000 peer-reviewed publications using HCUP data, products, or tools
|
| |
Slide 57
 Pre-Calculated Statistics
What Pre-Calculated Statistics Are Available?
|
| |
Slide 58
 HCUPnet Provides Quick, Free Access to HCUP Statistics
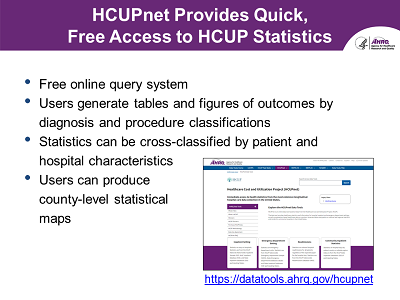
- Free online query system
- Users generate tables and figures of outcomes by diagnosis and procedure classifications
- Statistics can be cross-classified by patient and hospital characteristics
- Can produce county-level statistical maps
datatools.ahrq.gov/hcupnet
|
| |
Slide 59
 HCUPnet Can Answer a Variety of Questions
- What percentage of hospitalizations are billed to Medicaid as the expected primary payer?
- What are the most expensive conditions treated in U.S. hospitals?
- What is the trend in the number of hospitalizations related to depression?
- How do my estimates using an HCUP database compare with HCUPnet (validation)?
|
| |
Slide 60
 HCUP Summary Trend Tables (NEW)
-
Downloadable tables containing State-specific monthly trends in hospital
utilization provided overall as well as by three key reporting categories:
- Inpatient stays by select priority conditions
-
Inpatient encounter type (including normal newborns, deliveries,
nonelective and elective inpatient stays)
-
Inpatient service line (including maternal and neonatal conditions,
mental health and substance use disorders, injuries, surgeries,
other medical conditions)
www.hcup-us.ahrq.gov/reports/trendtables/summarytrendtables.jsp
|
| |
Slide 61
 HCUP Fast Stats
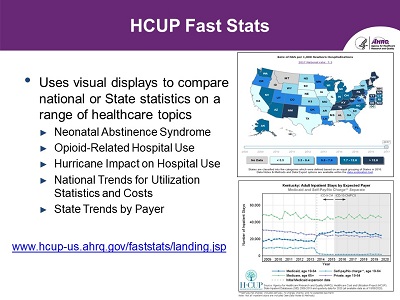
- Screenshots from HCUP Fast Stats homepage featuring topical nationwide heat map and graph.
-
Uses visual statistical displays to compare national or State statistics
on a range of healthcare topics
- Neonatal Abstinence Syndrome
- Opioid-Related Hospital Use
- Hurricane Impact on Hospital Use
- National Trends for Utilization Statistics and Costs
- State Trends by Payer
https://datatools.ahrq.gov/hcup-fast-stats
|
| |
Slide 62
 HCUP Summary Statistics
- Available for all HCUP databases by year
- Provide descriptive statistics for most data elements
-
Use before purchase of HCUP database
- Allows users to preview the type of information available in the respective HCUP database
-
Use after purchase of HCUP database
- Allows users to validate results
- Found under database-specific documentation pages of HCUP-US website
-
www.hcup-us.ahrq.gov/databases.jsp
|
| |
Slide 63
 Diagnosis and Procedure Frequency Tables
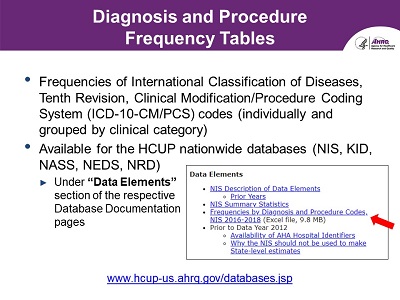
-
Frequencies of International Classification of Diseases, Tenth Revision,
Clinical Modification/Procedure Coding System (ICD-10-CM/PCS) codes
(individually and grouped by clinical category)
-
Available for the HCUP nationwide databases (NIS, KID, NASS, NEDS, NRD)
Screenshot shows example for the NIS
|
| |
Slide 64
 HCUP's Precalculated Statistics Meeting Varying Analytic Needs
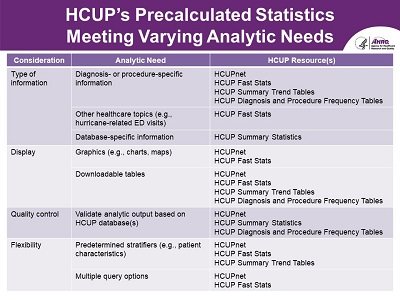
| Consideration |
Analytic Need |
HCUP Resource(s) |
| Type of information |
Diagnosis- or procedure-specific information |
- HCUPnet
- HCUP Fast Stats
- HCUP Summary Trend Tables
- HCUP Diagnosis and Procedure Frequency Tables
|
| Other healthcare topics (e.g., hurricane-related ED visits) |
HCUP Fast Stats |
Database-specific information |
HCUP Summary Statistics |
| Display |
Graphics (e.g., charts, maps) |
|
| Downloadable tables |
- HCUP Fast Stats
- HCUP Summary Trend Tables
- HCUP Diagnosis and Procedure Frequency Tables
|
| Quality control |
Validate analytic output based on HCUP database(s) |
- HCUPnet
- HCUP Summary Statistics
- HCUP Diagnosis and Procedure Frequency Tables
|
| Flexibility |
Predetermined stratifiers (e.g., patient characteristics) |
- HCUPnet
- HCUP Fast Stats
- HCUP Summary Trend Tables
|
| Multiple query options |
|
|
| |
Slide 65
 HCUP Data Visualization
What HCUP Data Visualizations are Available?
|
| |
Slide 66
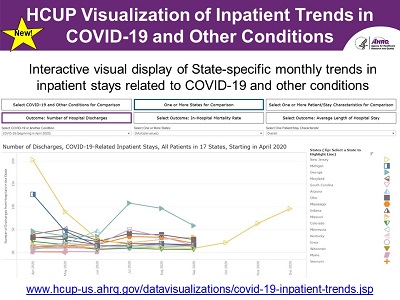 HCUP Visualization of Inpatient Trends in COVID-19 and Other Conditions (NEW)
-
Screenshot of HCUP Data Visualization interactive graph for Inpatient
Trends in COVID-19 and Other Conditions topic
-
Interactive visual display of State-specific monthly trends in inpatient
stays related to COVID-19 and other conditions
-
www.hcup-us.ahrq.gov/datavisualizations/covid-19-inpatient-trends.jsp
-
This interactive visualization displays State-specific monthly trends
in inpatient stays related to COVID-19 and other conditions and
facilitates comparisons across patient/stay characteristics and States.
Trends are reported beginning with January 2018 except for COVID-19,
where trends are reported beginning with April 2020. This information
is derived from the HCUP Summary Trend Tables, which present monthly
information on hospital utilization based on the 2018-2019 HCUP State
Inpatient Databases (SID) for 46 States and the District of Columbia,
plus 2020 quarterly inpatient data, if available.
|
| |
Slide 67
 HCUP Software Tools
What are the HCUP Software Tools?
|
| |
Slide 68
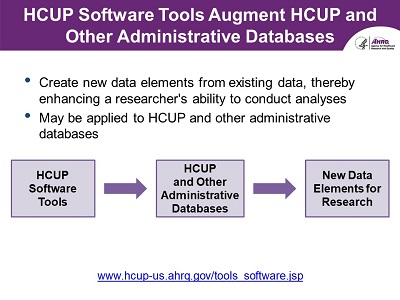 HCUP Software Tools Augment HCUP and Other Administrative Databases
- Create new data elements from existing data, thereby enhancing a researcher's ability to conduct analyses
- May be applied to HCUP and other administrative databases
- HCUP Software Tools → HCUP and Other Administrative Databases → New Data Elements for Research
www.hcup-us.ahrq.gov/tools_software.jsp
|
| |
Slide 69
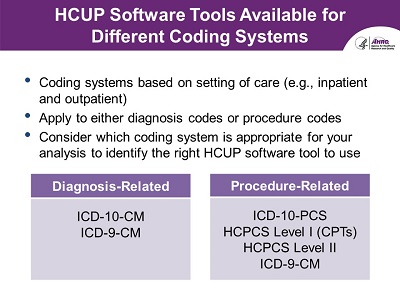 HCUP Software Tools Available for Different Coding Systems
- Coding systems based on setting of care (e.g., inpatient and outpatient)
- Apply to either diagnosis codes or procedure codes
-
Consider which coding system is appropriate for your analysis to
identify the right HCUP software tool to use
-
Diagnosis-Related
-
Procedure-Related
- ICD-10-PCS
- HCPCS Level I (CPTs)
- HCPCS Level II
- ICD-9-CM
|
| |
Slide 70
 Types of Diagnosis Codes Included in HCUP Databases
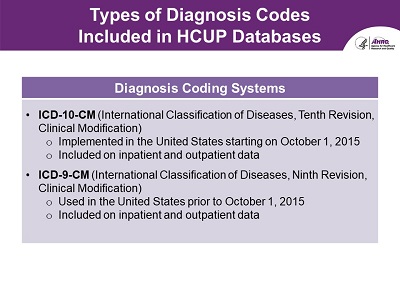
- Diagnosis Coding Systems
- ICD-10-CM (International Classification of Diseases, Tenth Revision, Clinical Modification)
- Implemented in the United States starting on October 1, 2015
- Included on inpatient and outpatient data
- ICD-9-CM (International Classification of Diseases, Ninth Revision, Clinical Modification)
- Used in the United States prior to October 1, 2015
- Included on inpatient and outpatient data
|
| |
Slide 71
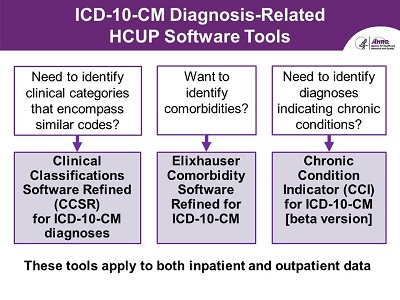 ICD-10-CM Diagnosis-Related HCUP Software Tools
- Need to identify clinical categories that encompass similar codes?
- → Clinical Classifications Software Refined (CCSR) for ICD-10-CM diagnoses
- What to identify comorbidities?
- → Elixhauser Comorbidity Software Refined for ICD-10-CM
- Need to identify diagnoses indicating chronic conditions?
- → Chronic Condition Indicator (CCI) for ICD-10-CM [beta version]
These tools apply to both inpatient and outpatient data
|
| |
Slide 72
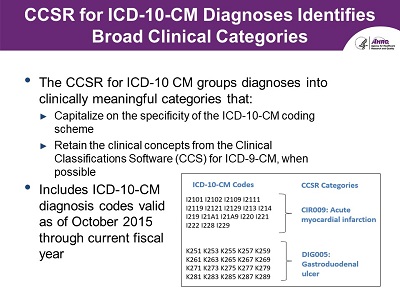 CCSR for ICD-10-CM Diagnoses Identifies Broad Clinical Categories
- The CCSR for ICD-10-CM groups diagnoses into clinically meaningful categories that:
- Capitalize on the specificity of the ICD-10-CM coding scheme
- Retain the clinical concepts from the Clinical Classifications Software (CCS) for ICD-9-CM, when possible
- Includes ICD-10-CM diagnosis codes valid as of October 2015 through current fiscal year
- CCSR Categories:
- CIR009: Acute myocardial infarction
-
ICD-10-CM Codes: I2101, 12102, I2109, I2111, I2119, I2121, I2129,
I213, I214, I219, I21A1, I21A9, I220, I221, I222, I228, I229
- DIG005: Gastroduodenal ulcer
-
ICD-10-M Codes: K251, K253, K255, K257, K259, K261, K263,
K265, K267, K269, K271, K273, K275, K277, K279, K281,
K283, K285, K287, K289
|
| |
Slide 73
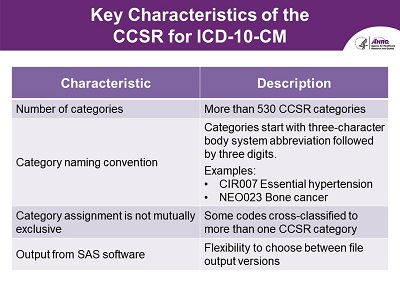 Key Characteristics of the CCSR for ICD-10-CM
| Characteristic |
Description |
| Number of categories |
More than 530 CCSR categories |
| Category naming convention |
Categories start with three-character body system abbreviation followed by three digits.
Examples:
- CIR007 Essential hypertension
- NEO023 Bone cancer
|
| Category assignment is not mutually exclusive |
Some codes cross-classified to more than one CCSR category |
| Output from SAS software |
Flexibility to choose between file output versions |
|
| |
Slide 74
 Default CCSR for ICD-10-CM Categorization Scheme Available
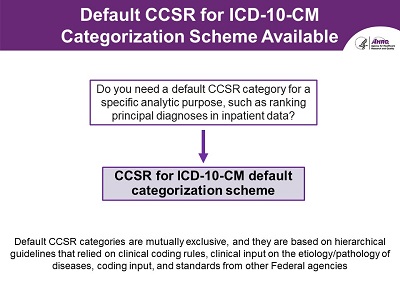
-
Do you need a default CCSR category for a specific analytic purpose,
such as ranking principal diagnoses in inpatient data?
- → CCSR for ICD-10-CM default categorization scheme
-
Default CCSR categories are mutually exclusive, and they are based on
hierarchical guidelines that relied on clinical coding rules, clinical
input on the etiology/pathology of diseases, coding input, and
standards from other Federal agencies
|
| |
Slide 75
 Elixhauser Comorbidity Software Refined for ICD-10-CM Identifies Pre-existing Conditions
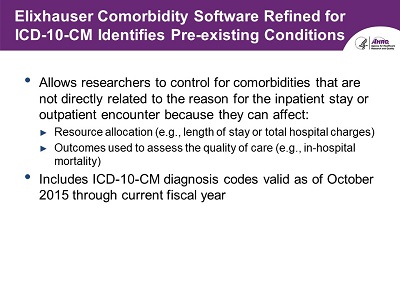
-
Allows researchers to control for comorbidities that are not directly
related to the reason for the inpatient stay or outpatient encounter
as they can affect:
- Resource allocation (e.g., length of stay or total hospital charges)
- Outcomes used to assess the quality of care (e.g., in-hospital mortality)
- Includes ICD-10-CM diagnosis codes valid as of October 2015 through current fiscal year
|
| |
Slide 76
 Key Characteristics of the Elixhauser Comorbidity Software Refined for ICD-10-CM
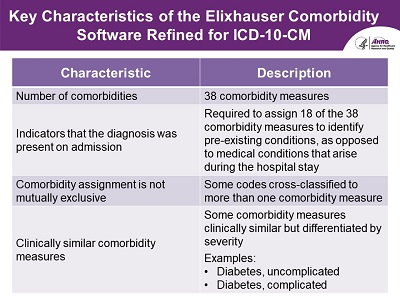
| Characteristic |
Description |
| Number of comorbidities |
38 comorbidity measures |
| Indicators that the diagnosis was present on admission |
Required to assign 18 of the 38 comorbidity measures to identify pre-existing conditions,
as opposed to medical conditions that arise during the hospital stay
|
| Comorbidity assignment is not mutually exclusive |
Some codes cross-classified to more than one comorbidity measure |
| Clinically similar comorbidity measures |
Some comorbidity measures clinically similar but differentiated by severity
Examples:
- Diabetes, uncomplicated
- Diabetes, complicated
|
|
| |
Slide 77
 CCI for ICD-10-CM (Beta Version) Readily Identifies Chronic Conditions
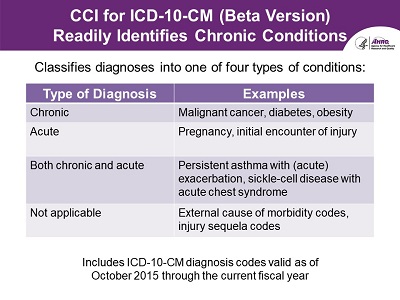
- Classifies diagnoses into one of four types of conditions:
- Includes ICD-10-CM diagnosis codes valid as of October 2015 through the current fiscal year
| Characteristic |
Description |
| Type of Diagnosis |
Examples |
| Chronic |
Malignant cancer, diabetes, obesity |
| Acute |
Pregnancy, initial encounter of injury |
| Both chronic and acute |
Persistent asthma with (acute) exacerbation, sickle-cell disease with acute chest syndrome |
| Not applicable |
External cause of morbidity codes, injury sequela codes |
|
| |
Slide 78
 Similar HCUP Software Tools for ICD-9-CM Diagnoses
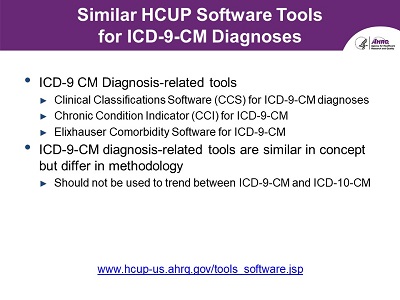
- ICD-9 CM Diagnosis-related tools
- Clinical Classifications Software (CCS) for ICD-9-CM diagnoses
- Chronic Condition Indicator (CCI) for ICD-9-CM
- Elixhauser Comorbidity Software for ICD-9-CM
- ICD-9-CM diagnosis-related tools are similar in concept but differ in methodology
- Should not be used to trend between ICD-9-CM and ICD-10-CM
www.hcup-us.ahrq.gov/tools_software.jsp
|
| |
Slide 79
 Types of Procedure Codes Included in HCUP Databases
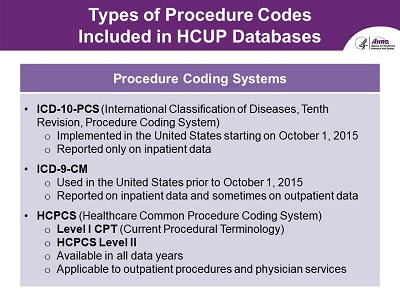
Procedure Coding Systems
- ICD-10-PCS (International Classification of Diseases, Tenth Revision, Procedure Coding System)
- Implemented in the United States starting on October 1, 2015
- Reported only on inpatient data
- ICD-9-CM
- Used in the United States prior to October 1, 2015
- Reported on inpatient data and sometimes on outpatient data
- HCPCS (Healthcare Common Procedure Coding System)
- Level I CPT (Current Procedural Terminology)
- HCPCS Level II
- Available in all data years
- Applicable to outpatient procedures and physician services
|
| |
Slide 80
 ICD-10-PCS Procedure-Related HCUP Software Tools
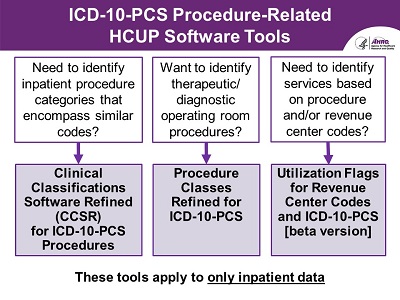
- Need to identify inpatient procedure categories that encompass similar codes?
- → Clinical Classifications Software Refined (CCSR) for ICD-10-PCS procedures
- Want to identify therapeutic/ diagnostic operating room procedures?
- → Procedure Classes Refined for ICD-10-PCS
- Need to identify services based on procedure and/or revenue center codes?
- → Utilization Flags for Revenue Center Codes and ICD-10-PCS [beta version]
These tools apply to only inpatient data
|
| |
Slide 81
 CCSR for ICD-10-PCS Procedures Identifies Broad Procedure Categories
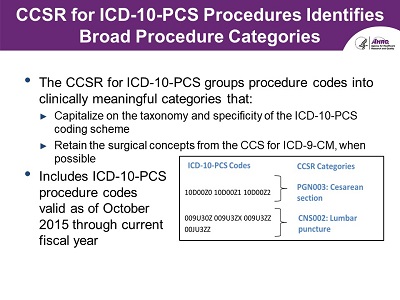
- The CCSR for ICD-10-PCS groups procedure codes into clinically meaningful categories which:
- Capitalize on the taxonomy and specificity of the ICD-10-PCS coding scheme
- Retain the surgical concepts from the CCS for ICD-9-CM, when possible
- Includes ICD-10-PCS procedure codes valid as of October 2015 through current fiscal year
- CCSR Categories:
- PGN003: Cesarean section
- ICD-10-PCS Codes: 10D00Z0, 10D00Z1, 10D00Z2
- CNS002: Lumbar puncture
- ICD-10-PCS Codes: 009U30Z, 009U3ZX, 009U3ZZ, 00JU3ZZ
|
| |
Slide 82
 Key Characteristics of the CCSR for ICD-10-PCS
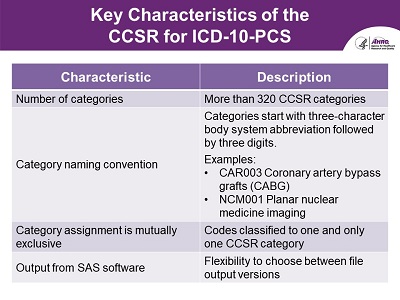
| Characteristic |
Description |
| Number of categories |
Over 320 CCSR categories |
| Category naming convention |
Categories start with three-character body system abbreviation followed by three digits.
Examples:
- CAR003 Coronary artery bypass grafts (CABG)
- NCM001 Planar nuclear medicine imaging
|
| Category assignment is mutually exclusive |
Codes classified to one and only one CCSR category |
| Output from SAS software |
Flexibility to choose between file output versions |
|
| |
Slide 83
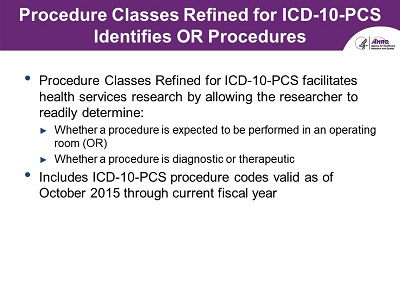 Procedure Classes Refined for ICD-10-PCS Identifies OR Procedures
- Procedure Classes Refined for ICD-10-PCS facilitates health services research by allowing the researcher to readily determine:
- Whether a procedure is expected to be performed in an operating room
- Whether a procedure is diagnostic or therapeutic
- Includes ICD-10-PCS procedure codes valid as of October 2015 through current fiscal year
|
| |
Slide 84
 Four Procedure Class Categories
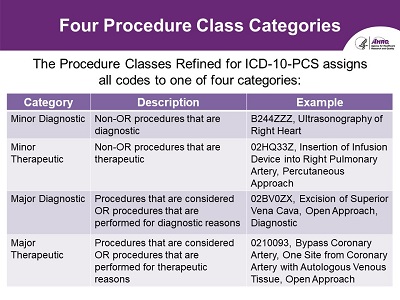
- The Procedure Classes Refined for ICD-10-PCS assigns all codes to one of four categories:
| Category |
Description |
Example |
| Minor Diagnostic
| Non-OR procedures that are diagnostic
| B244ZZZ, Ultrasonography of Right Heart
|
| Minor Therapeutic
| Non-OR procedures that are therapeutic
| 02HQ33Z, Insertion of Infusion Device into Right Pulmonary Artery, Percutaneous Approach
|
| Major Diagnostic
| Procedures that are considered OR procedures that are performed for diagnostic reasons
| 02BV0ZX, Excision of Superior Vena Cava, Open Approach, Diagnostic
|
| Major Therapeutic
| Procedures that are considered OR procedures that are performed for therapeutic reasons
| 0210093, Bypass Coronary Artery, One Site from Coronary Artery with Autologous Venous Tissue, Open Approach
|
|
| |
Slide 85
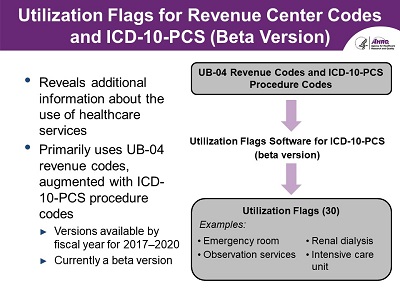 Utilization Flags for Revenue Center Codes and ICD-10-PCS (Beta Version)
- Reveals additional information about the use of healthcare services
- Primarily uses UB-04 revenue codes, augmented with
- ICD-10-PCS procedure codes
- Versions available by FY for years 2017-2020
- Currently a beta version
- UB-04 Revenue Codes and ICD-10-PCS Procedure Codes → Utilization Flags Software for ICD-10-PCS (beta version) → Utilization Flags (30)
- Examples of Utilization Flags:
- Emergency room
- Observation services
- Renal dialysis
- Intensive care unit
|
| |
Slide 86
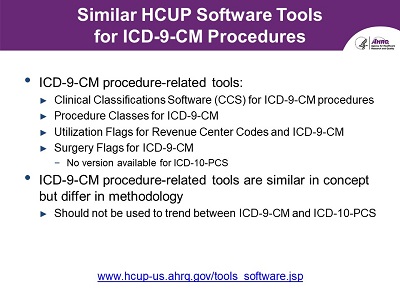 Similar HCUP Software Tools for ICD-9-CM Procedures
- ICD-9-CM Procedure-related tools
- Clinical Classifications Software (CCS) for ICD-9-CM procedures
- Procedure Classes for ICD-9-CM
- Utilization Flags for Revenue Center Codes and ICD-9-CM
- Surgery Flags for ICD-9-CM
- No version available for ICD-10-PCS
- ICD-9-CM procedure-related tools are similar in concept but differ in methodology
- Should not be used to trend between ICD-9-CM and ICD-10-PCS
www.hcup-us.ahrq.gov/tools_software.jsp
|
| |
Slide 87
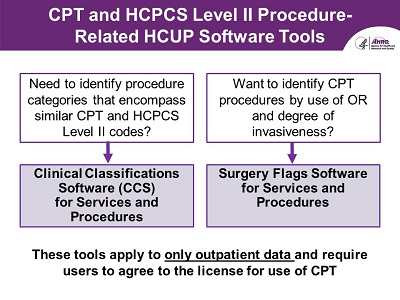 CPT and HCPCS Level II Procedure-Related HCUP Software Tools
- Need to identify procedure categories that encompass similar CPT and HCPCS Level II codes?
- → Clinical Classifications Software (CCS) for Services and Procedures
- Want to identify CPT procedures by use of operating room and degree of invasiveness?
- → Surgery Flags Software for Services and Procedures
These tools apply to only outpatient data and require users to agree to the license for use of CPT
|
| |
Slide 88
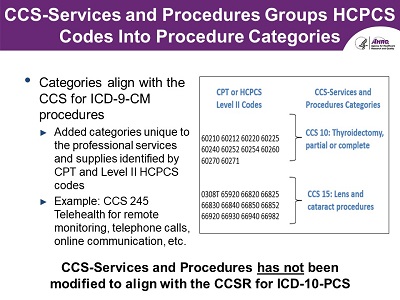 CCS-Services and Procedures Groups HCPCS Codes Into Procedure Categories
- Categories align with the CCS for ICD-9-CM procedures
- Added categories unique to the professional services and supplies identified by CPT and Level II HCPCS codes
- Example: CCS 245 Telehealth for remote monitoring, telephone calls, online communication, etc
- CCS-Services and Procedures Categories
- CCS 10: Thyroidectomy, partial or complete
- CPT or HCPCS Level II Codes: 60210, 60212, 60220, 60225, 60240, 60252, 60254, 60260, 60270, 60271
- CCS 15: Lens and cataract procedures
- CPT or HCPCS Level II Codes: 0308T, 65920, 66820, 66825, 66830, 66840, 66850, 66852, 66920, 66930, 66940, 66982
CCS-Services and Procedures has not been modified to align with the CCSR for ICD-10-PCS
|
| |
Slide 89
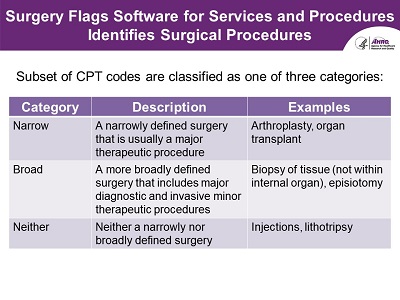 Surgery Flags Software for Services and Procedures Identifies Surgical Procedures
- Subset of CPT codes are classified as one of three categories:
| Category |
Description |
Example |
| Narrow |
A narrowly defined surgery that is usually a major therapeutic procedure |
Arthroplasty, organ transplant |
| Broad |
A more broadly defined surgery that includes major diagnostic and invasive minor therapeutic procedures |
Biopsy of tissue (not within internal organ), episiotomy |
| Neither |
Neither a narrowly nor broadly defined surgery |
Injections, lithotripsy |
|
| |
Slide 90
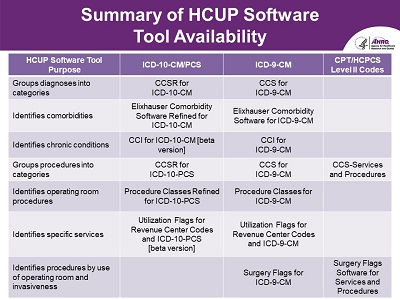 Summary of HCUP Software Tool Availability
| HCUP Software Tool Purpose |
ICD-10-CM/PCS |
ICD-9-CM |
CPT/HCPCS Level II Codes |
| Groups diagnoses into categories |
CCSR for ICD-10-CM |
CCS for ICD-9-CM |
|
| Identifies comorbidities |
Elixhauser Comorbidity Software Refined for ICD-10-CM |
Elixhauser Comorbidity Software for ICD-9-CM |
|
| Identifies chronic conditions |
CCI for ICD-10-CM [beta version] |
CCI for ICD-9-CM |
|
| Groups procedures into categories |
CCSR for ICD-10-PCS |
CCS for ICD-9-CM |
CCS-Services and Procedures |
| Identifies operating room procedures |
Procedure Classes Refined for ICD-10-PCS |
Procedure Classes for ICD-9-CM |
|
| Identifies specific services |
Utilization Flags for Revenue Center Codes and ICD-10-PCS
[beta version] |
Utilization Flags for Revenue Center Codes and ICD-9-CM |
|
| Identifies procedures by use of operating room and invasiveness |
|
Surgery Flags for ICD-9-CM |
Surgery Flags Software for Services and Procedures |
|
| |
Slide 91
 HCUP Software Tool Versioning
- Tools are updated annually to reflect the most recent coding updates
- CPT/HCPCS Level II codes are updated on a calendar year basis (effective on January 1)
- ICD-10-CM and ICD-10-PCS codes are updated on a fiscal year basis (effective October 1)
- Tools use specific file naming conventions to indicate applicable version of the underlying codes (vyyyy.r):
-
Where yyyy represents either fiscal year for ICD-10-CM/PCS or calendar year for
CPT/HCPCS and r represents the release number within year
-
For example, the first release of the CCSR for ICD-10-CM diagnoses that
includes codes valid through fiscal year 2021 is v2021.1
|
| |
Slide 92
 Availability of HCUP Software Tools on HCUP Databases
- ICD-10-CM/PCS refined tools are being added to the HCUP databases
- 2018 HCUP nationwide databases include the CCSR for ICD-10-CM diagnoses
- 2019 HCUP nationwide databases and 2020 HCUP State databases will include:
- Elixhauser Comorbidity Software Refined for ICD-10-CM
- CCSR for ICD-10-PCS procedures
- Procedure Classes Refined for ICD-10-PCS
|
| |
Slide 93
 HCUP Supplemental Files
How Can You Use the HCUP Supplemental Files?
|
| |
Slide 94
 HCUP Supplemental Files Augment Applicable HCUP Databases
- Provide access to additional data elements or analytically useful information
-
Either they are available for download from the HCUP-US website or
they may be ordered when purchasing the applicable HCUP database
Designed to be used only with the HCUP databases
www.hcup-us.ahrq.gov/tools_software.jsp
|
| |
Slide 95
 Available HCUP Supplemental Files
- Cost-to-Charge Ratio (CCR) Files
- American Hospital Association (AHA) Linkage Files
- Supplemental Variable for Revisit Analyses
- Trend Weights Files (NIS & KID)
- Hospital Market Structure (HMS) Files
- NIS Hospital Ownership File
www.hcup-us.ahrq.gov/tools_software.jsp
|
| |
Slide 96
 HCUP Cost-to-Charge Ratio (CCR) Files Convert Total Charges to Total Costs
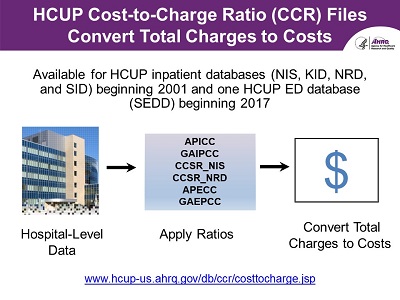
- Available for HCUP inpatient databases (NIS, KID, NRD, and SID) beginning 2001 and one HCUP ED database (SEDD) beginning 2017
- Hospital-Level Data → Apply Ratios (APICC, GAIPCC, CCSR_NIS, CCSR_NRD, APECC, GAEPCC) → Convert Total Charges to Costs
www.hcup-us.ahrq.gov/db/ccr/costtocharge.jsp
|
| |
Slide 97
 AHA Linkage Files Provide Linkage For HCUP Hospital Identifiers
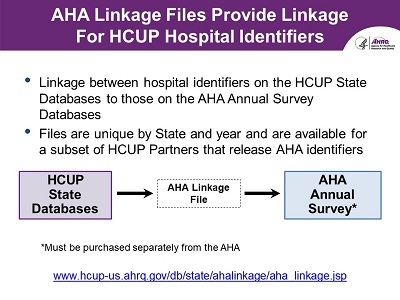
- Linkage between hospital identifiers on the HCUP State Databases to those on the AHA Annual Survey Databases
- Files are unique by State and year and are available for a subset of HCUP Partners that release AHA identifiers
- HCUP State Databases → AHA Linkage File → AHA Annual Survey*
*Must be purchased separately from the AHA
www.hcup-us.ahrq.gov/db/state/ahalinkage/aha_linkage.jsp
|
| |
Slide 98
 HCUP Supplemental Variables for Revisit Analyses
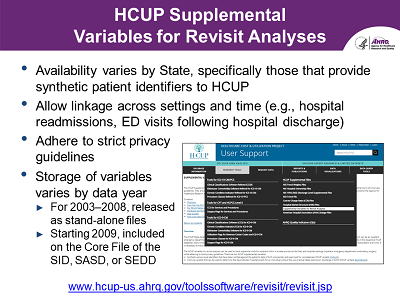
- Availability varies by State, specifically those that provide synthetic patient identifiers to HCUP
- Allow linkage across settings and time (e.g., hospital readmissions, ED visits following hospital discharge)
- Adhere to strict privacy guidelines
- Storage of variables varies by data year
- For 2003-2008, released as stand-alone files
- Starting 2009, included on the Core File of the SID, SASD, or SEDD
www.hcup-us.ahrq.gov/toolssoftware/revisit/revisit.jsp
|
| |
Slide 99
 NIS and KID Trend Weights Files Adjust Discharge Weights for Longitudinal Analyses
-
Adjust discharge weights to account for sample redesign of the NIS (2012)
and KID (2000) when trending across these years
- Files are needed for longitudinal analyses that span these redesign time periods
www.hcup-us.ahrq.gov/db/nation/nis/trendwghts.jsp
www.hcup-us.ahrq.gov/db/nation/kid/kidtrends.jsp
|
| |
Slide 100
 HCUP Hospital Market Structure Files Contain Measures of Hospital Competition
- Estimate the intensity of competition that hospitals may face under various definitions of market area, including:
- Markets defined by geopolitical boundaries
- Fixed radius defined by 15 miles
- Variable radius that varies to capture majority of hospital discharges
- Patient flow
- Available for the NIS, KID, and SID for data years 1997, 2000, 2003, 2006, and 2009
www.hcup-us.ahrq.gov/toolssoftware/hms/hms.jsp
|
| |
Slide 101
 HCUP NIS Ownership Files Facilitate Analyses by Ownership Categories
-
Provide uncollapsed ownership categories (government, non-federal,
private, non-profit, and private, investor-owned) to facilitate
longitudinal analyses
-
Available for 1998-2007 for the NIS because these data years
include a version of hospital ownership that provides collapsed
values for some strata
www.hcup-us.ahrq.gov/db/nation/nis/nisownership.jsp
|
| |
Slide 102
 Resources for the HCUP Supplemental Files
-
Additional information about the HCUP supplemental files available on the
Tools and Software page:
www.hcup-us.ahrq.gov/tools_software.jsp
- All supplemental files available for free
- The supplemental files differ on method of download
|
| |
Slide 103
 HCUP Technical Assistance
What Should You Do if You Have Questions about HCUP?
|
| |
Slide 104
 HCUP User Support Website
- Find detailed information on HCUP databases, tools, and products
-
Access HCUPnet, HCUP Fast Stats, HCUP Summary Trend Tables, Data Visualizations,
the Central Distributor, Online Tutorials, and more
- Find comprehensive list of HCUP-related publications and database reports
- Access technical assistance
Visit us at www.hcup-us.ahrq.gov
|
| |
Slide 105
 Using HCUP Technical Assistance
- Technical Assistance Team
- Responds to inquiries about HCUP data, products, and tools
- Collects user feedback and suggestions for improvement
Email: hcup@ahrq.gov
|
| |
Slide 106
 Interactive Online HCUP Tutorials & Training Courses
- HCUP Overview Course
- Producing National HCUP Estimates
- Load and Check HCUP Data
- HCUP Tools Loading
- Calculating Standard Errors
- HCUP Sample Design
- Multi-Year Analysis
- Nationwide Readmissions Database (NRD)
- HCUP Software Tools (NEW)
|
| |
Slide 107
 Visit HCUP's Virtual Exhibit Booth
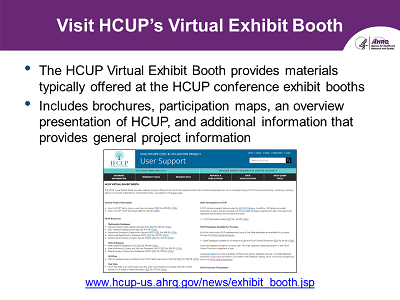
-
The HCUP Virtual Exhibit Booth provides materials typically
offered at the HCUP conference exhibit booths
-
Includes brochures, participation maps, an overview presentation
of HCUP, and additional information that provides general project information
www.hcup-us.ahrq.gov/news/exhibit_booth.jsp
|
| |
Slide 108
 Join the HCUP Email List
- HCUP Newsletter, published quarterly
- User Tech Tips
- Upcoming Events
- New Data Releases
- New Reports
https://subscriptions.ahrq.gov/accounts/USAHRQ/subscriber/new
|
| |
Slide 109
 Questions/Comments?
Email: hcup@ahrq.gov
|
