STATISTICAL BRIEF #94
|
|
August 2010
Jennifer Lucado, M.P.H., Kathryn Paez, Ph.D., M.B.A., R.N., Roxanne Andrews, Ph.D., and Claudia Steiner, M.D., M.P.H.
Introduction Healthcare-associated infections (HAIs) are among the most common adverse events in healthcare and, consequently, are a common cause of morbidity and mortality in the United States. In one study, researchers estimated approximately 1.7 million HAIs in U.S. hospitals in 2002, which resulted in nearly 99,000 deaths.1 Evidence-based guidelines were issued for reducing many types of HAIs, including catheter-related bloodstream infections.2 Interventions using these guidelines have shown sustainable reductions in the rate of infection among hospital patients.3,4 It was reported in a recent data summary that the rate of bloodstream infections may be decreasing.5 Infections due to medical care are a group of potentially avoidable HAIs, associated primarily with the placement of vascular devices or grafts, as well as those related to infusions, injections, transfusions, or vaccinations. These HAIs have been grouped by the Agency for Healthcare Research and Quality’s (AHRQ) as a single Patient Safety Indicator (PSI), PSI #7: Selected infections due to medical care.6 This Statistical Brief presents data from the Healthcare Cost and Utilization Project (HCUP) on infections due to medical care during medical and surgical hospital stays in 2007. These cases were based on the criteria for AHRQ’s PSI #7. Patient and hospital characteristics, including age, sex, expected payer, length of stay, and hospital size, are compared between hospital stays with infections due to medical care and all other hospital stays that meet the same inclusion criteria. The most common principal diagnoses among stays with infections are described and their incidence among the infected is compared to those without infections. Additionally, rate trends, adjusted for age, sex, DRGs, and comorbidities, are illustrated. An eight year trend in the adjusted rate of infections due to medical care among hospital stays is shown from 2000 to 2007. Trends in the adjusted rate of infection are also illustrated from 2004 to 2007 by age group, region of the country, and expected payer. All differences between estimates noted in the text are statistically significant at the 0.05 level or better. Findings As shown in table 1, in 2007, 42,243 patients were identified with infections due to medical care during inpatient hospital stays, accounting for 0.2 percent of all hospital stays. Patients in the 65 years and older age group had the greatest number of infections (18,995), followed by the 45 to 64 year group with 13,877, and the 18 to 44 year group with 9,350. These age groups represented 45.0, 32.9, and 22.1 percent of the cases, respectively. Compared to all other hospital discharges, discharges with infections due to medical care tended to be older. Only 22.1 percent of infection stays were people aged 18 to 44, while 35.7 percent of all other discharges fell into that age group, a 13.6 percentage point difference. Among those with infections, the distribution by sex was close to being equally male (49.1 percent) and female (50.9 percent). This differed from all other stays, where a larger proportion, 64.4 percent, was female. |
|
Patient and stay characteristics Among hospitals stays with infections due to medical care, slightly more than half (53.5%) were paid for by Medicare (table 1). The second largest expected payer, with 23.7 percent of stays, was private insurance, followed by Medicaid with 14.9 percent. The remaining 4.4 percent and 3.6 percent were uninsured and other payers, respectively. This payer distribution varies from all other discharges, where a smaller percentage, only 41.4, had Medicare as expected payer and a greater percentage, 32.1, had private insurance. For infection stays, 54.4 percent were admitted through the emergency department, while 10.7 percent came from another hospital and 3.0 percent came from another health facility, including long term care (LTC) facilities. The average length of stay with an infection due to medical care was 24.4 days and resulted in a cost of $52,096. This is more than 19 days longer and nearly $43,000 more expensive than the average stay for all other discharges. Patients with infections due to medical care also had, on average, a greater number of comorbidities (2.8 vs. 1.9) and greater in-hospital mortality (9.0 vs. 1.5 percent) compared to all other discharges. Hospital characteristics The greatest proportion of stays with infections due to medical care were in hospitals with 100 to 299 beds (35.0 percent) and 300 to 499 beds (32.8 percent). When compared to all other stays, infection stays were more likely to be at very large hospitals of 500 beds or greater, and less likely to be at smaller hospitals that had fewer than 300 beds. Slightly more than 93 percent of stays with infections occurred at metropolitan hospitals, which was about 7 percentage points greater than all other stays. A majority of infection stays, 68.6 percent, were at private, not for profit hospitals, which is a smaller percentage than all other stays, with 72.1 percent of stays for that hospital type. Stays with infections were more likely to occur at private, for profit and teaching hospitals than all other stays. Most common principal diagnoses Among stays with infections due to medical care, the top three principal diagnoses were septicemia; adult respiratory failure, insufficiency or arrest; and complications of surgical procedures or medical care (table 2). These diagnoses were present in 11.8, 5.9, and 4.1 percent of infection stays, compared to only 2.0, 1.2, and 1.3 percent of all other stays. Pneumonia and congestive heart failure were also common among stays with infection due to medical care at 3.0 and 2.8 percent, but they were found at similar rates (3.4 and 3.4 percent) among all other stays. Trends in rates During the eight year period from 2000 to 2007, the adjusted rate of infections due to medical care per 1,000 medical and surgical hospital stays began at 2.03, peaked at 2.30 in 2004 and 2005, and declined again to 2.03 in 2007 (figure 1). All age groups followed the same downward trend during this four year period (figure 2). The rate was highest in the 45 to 64 year group and lowest in the 18 to 44 year group. The 45 to 64 year old group also had the greatest reduction in rate of infections, at 0.48 per 1,000 or 15.7 percent. Rates decreased for all four regions, ranging from a 4.7 percent reduction in the South to an 18.0 percent reduction in the West (figure 3). The Midwest had the lowest rate for all four years and had a reduction of 14.1 percent. The uninsured had the lowest rate of infections due to medical care each year and had the greatest percentage reduction (24.7) (figure 4). On the other end of the spectrum, patients covered by Medicaid had the highest rate each year. While all payers saw reductions in the adjusted rate of infection from 2004 to 2007, patients with Medicaid had the lowest percentage in reduction, at 8.7 percent Data Source The estimates in this Statistical Brief are based upon data from the HCUP 2007 Nationwide Inpatient Sample (NIS). Historical data were drawn from the 2000, 2004, 2005, and 2006 NIS and analyzed using the Agency for Healthcare Research and Quality’s Quality Indicator Software. Definitions Diagnoses, ICD-9-CM, and Clinical Classifications Software (CCS) The principal diagnosis is that condition established after study to be chiefly responsible for the patient’s admission to the hospital. Secondary diagnoses are concomitant conditions that coexist at the time of admission or that develop during the stay. ICD-9-CM is the International Classification of Diseases, Ninth Revision, Clinical Modification, which assigns numeric codes to diagnoses. There are about 13,600 ICD-9-CM diagnosis codes. CCS categorizes ICD-9-CM diagnoses into a manageable number of clinically meaningful categories. 7 This "clinical grouper" makes it easier to quickly understand patterns of diagnoses and procedures. Case Definition Infections due to medical care cases were identified using the criteria set forth by AHRQ for Patient Safety Indicator (PSI) #7 (version 3.1). This indicator is intended to flag cases of infection due to medical care, primarily those associated with the placement of vascular devices or grafts, as well as those related to infusions, injections, transfusions, or vaccinations. The ICD-9-CM codes defining selected infections due to medical care are:
Patient safety indicators The AHRQ Patient Safety Indicator (PSI) #7 (version 3.1) was used for this analysis to identify the admissions of interest and for risk-adjustment of rates. The PSIs, a component of the AHRQ QIs, are a set of measures that can be used with hospital inpatient discharge and administrative data to provide a perspective on quality. PSIs screen for problems that patients experience as a result of exposure to the healthcare system and that are likely amenable to prevention by changes at the system or provider level. These are referred to as complications or adverse events. PSIs are defined on two levels: the provider-level and the area-level. Provider-level indicators provide a measure of the potentially preventable complication for patients who received their initial care and the complication of care within the same hospitalization. Provider-level indicators include only those cases where a secondary diagnosis code flags a potentially preventable complication. PSI #7 is a provider-level measure. Risk adjustment The PSI rates used in this Statistical Brief were adjusted for select risk factors. The PSI risk adjustment variables were age, sex, age-sex interaction, DRG cluster, and comorbidity. When adjusted rates by age are reported, the adjustment does not include age. Regression-based standardization (designed by the developers of the PSI software) was used for risk adjustment. Payer The rate calculations also take into account the clustering of patients within hospitals and the hospital stratification aspects of the sampling design for the NIS. The patient safety event rates were weighted for national estimates. Pairwise t-tests were used to test for statistical significance of differences in patient safety (additional detail on the file development, risk adjustment methodology, and statistical approach is available in Coffey et al., 2009).9 Types of hospitals included in HCUP HCUP is based on data from community hospitals, defined as short-term, non-Federal, general and other hospitals, excluding hospital units of other institutions (e.g., prisons). HCUP data include OB-GYN, ENT, orthopedic, cancer, pediatric, public, and academic medical hospitals. They exclude long-term care, rehabilitation, psychiatric, and alcoholism and chemical dependency hospitals, but these types of discharges are included if they are from community hospitals. Unit of analysis The unit of analysis is the hospital discharge (i.e., the hospital stay), not a person or patient. This means that a person who is admitted to the hospital multiple times in one year will be counted each time as a separate "discharge" from the hospital. Costs and charges Total hospital charges were converted to costs using HCUP Cost-to-Charge Ratios based on hospital accounting reports from the Centers for Medicare and Medicaid Services (CMS).10 Costs will tend to reflect the actual costs of production, while charges represent what the hospital billed for the case. For each hospital, a hospital-wide cost-to-charge ratio is used because detailed charges are not available across all HCUP States. Hospital charges reflect the amount the hospital charged for the entire hospital stay and does not include professional (physician) fees. For the purposes of this Statistical Brief, costs are reported to the nearest hundred. Payer Payer is the expected primary payer for the hospital stay. To make coding uniform across all HCUP data sources, payer combines detailed categories into more general groups:
Region Region is one of the four regions defined by the U.S. Census Bureau:
Admission source (now known as patient’s point of origin) indicates where the patient was located prior to admission to the hospital. Emergency admission indicates the patient was admitted to the hospital through the emergency department. Admission from another hospital indicates the patient was admitted to this hospital from another short-term, acute-care hospital. This usually signifies that the patient required the transfer in order to obtain more specialized services that the originating hospital could not provide. Admission from another healthcare facility indicates the patient was admitted from some other health facility (not another short-term, acute-care hospital), including long term care (LTC) facilities, such as nursing homes. About HCUP HCUP is a family of powerful healthcare databases, software tools, and products for advancing research. Sponsored by the Agency for Healthcare Research and Quality (AHRQ), HCUP includes the largest all-payer encounter-level collection of longitudinal healthcare data (inpatient, ambulatory surgery, and emergency department) in the United States, beginning in 1988. HCUP is a Federal-State-Industry Partnership that brings together the data collection efforts of many organizations—such as State data organizations, hospital associations, private data organizations, and the Federal government—to create a national information resource. HCUP would not be possible without the contributions of the following data collection Partners from across the United States: Arizona Department of Health Services Arkansas Department of Health California Office of Statewide Health Planning and Development Colorado Hospital Association Connecticut Hospital Association Florida Agency for Health Care Administration Georgia Hospital Association Hawaii Health Information Corporation Illinois Department of Public Health Indiana Hospital Association Iowa Hospital Association Kansas Hospital Association Kentucky Cabinet for Health and Family Services Louisiana Department of Health and Hospitals Maine Health Data Organization Maryland Health Services Cost Review Commission Massachusetts Division of Health Care Finance and Policy Michigan Health & Hospital Association Minnesota Hospital Association Missouri Hospital Industry Data Institute Nebraska Hospital Association Nevada Department of Health and Human Services New Hampshire Department of Health & Human Services New Jersey Department of Health and Senior Services New Mexico Health Policy Commission New York State Department of Health North Carolina Department of Health and Human Services Ohio Hospital Association Oklahoma State Department of Health Oregon Association of Hospitals and Health Systems Pennsylvania Health Care Cost Containment Council Rhode Island Department of Health South Carolina State Budget & Control Board South Dakota Association of Healthcare Organizations Tennessee Hospital Association Texas Department of State Health Services Utah Department of Health Vermont Association of Hospitals and Health Systems Virginia Health Information Washington State Department of Health West Virginia Health Care Authority Wisconsin Department of Health Services Wyoming Hospital Association About the NIS The HCUP Nationwide Inpatient Sample (NIS) is a nationwide database of hospital inpatient stays. The NIS is nationally representative of all community hospitals (i.e., short-term, non-Federal, non-rehabilitation hospitals). The NIS is a sample of hospitals and includes all patients from each hospital, regardless of payer. It is drawn from a sampling frame that contains hospitals comprising about 90 percent of all discharges in the United States. The vast size of the NIS allows the study of topics at both the national and regional levels for specific subgroups of patients. In addition, NIS data are standardized across years to facilitate ease of use. For More Information For more information about HCUP, visit http://www.hcup-us.ahrq.gov. For additional HCUP statistics, visit HCUPnet, our interactive query system, at www.hcup.ahrq.gov. For information on other hospitalizations in the U.S., download HCUP Facts and Figures: Statistics on Hospital-based Care in the United States in 2007, located at http://www.hcup-us.ahrq.gov/reports.jsp. For a detailed description of HCUP, more information on the design of the NIS, and methods to calculate estimates, please refer to the following publications: Steiner, C., Elixhauser, A., Schnaier, J. The Healthcare Cost and Utilization Project: An Overview. Effective Clinical Practice 5(3):143–51, 2002. Introduction to the HCUP Nationwide Inpatient Sample, 2007. Online. June 16, 2009. U.S. Agency for Healthcare Research and Quality. http://www.hcup-us.ahrq.gov/db/nation/nis/NIS_2007_INTRODUCTION.pdf. . Houchens, R., Elixhauser, A. Final Report on Calculating Nationwide Inpatient Sample (NIS) Variances, 2001. HCUP Methods Series Report #2003-2. Online. June 2005 (revised June 6, 2005). U.S. Agency for Healthcare Research and Quality. http://www.hcup-us.ahrq.gov/reports/methods/2003_02.pdf. Houchens R.L., Elixhauser A. Using the HCUP Nationwide Inpatient Sample to Estimate Trends. (Updated for 1988–2004). HCUP Methods Series Report #2006-05 Online. August 18, 2006. U.S. Agency for Healthcare Research and Quality. http://www.hcup-us.ahrq.gov/reports/methods/2006_05_NISTrendsReport_1988-2004.pdf AHRQ Quality Indicators—Guide to Patient Safety Indicators, Version 3.1. Online. March 12, 2007. U.S. Agency for Healthcare Research and Quality. http://qualityindicators.ahrq.gov/Modules/psi_resources.aspx Suggested Citation Lucado, J. (Social & Scientific Systems, Inc.), Paez, K. (Social & Scientific Systems, Inc.), Andrews, R (AHRQ) and Steiner, C. (AHRQ). Adult Hospital Stays with Infections Due to Medical Care, 2007. HCUP Statistical Brief #94. August 2010. Agency for Healthcare Research and Quality, Rockville, MD. http://www.hcup-us.ahrq.gov/reports/statbriefs/sb94.pdf. *** AHRQ welcomes questions and comments from readers of this publication who are interested in obtaining more information about access, cost, use, financing, and quality of healthcare in the United States. We also invite you to tell us how you are using this Statistical Brief and other HCUP data and tools, and to share suggestions on how HCUP products might be enhanced to further meet your needs. Please e-mail us at hcup@ahrq.gov or send a letter to the address below: Irene Fraser, Ph.D., Director Center for Delivery, Organization, and Markets Agency for Healthcare Research and Quality 540 Gaither Road Rockville, MD 20850 1 Klevens R.M., Edwards J.R., Richards C.L., Horan T.C., Gaynes R.P., Pollock D.A., Cardo D.M. "Estimating Health Care-Associated Infections and Deaths in U.S. Hospitals, 2002." Public Health Reports. 2007; 122: 160-6. 2 Mermel L.A. "Prevention of Intravascular Catheter-Related Infections." Annals of Internal Medicine. 2000; 132: 391-402. 3 Pronovost P.J., Goeschel C.A., Colantuoni E., Watson S., Lubomski L.H., Berenholtz S.M., Thompson D.A., Sinopoli D.J., Cosgrove S., Sexton J.B., Marsteller J.A., Hyzy R.C., Welsh R., Posa P., Schumacher K., Needham D. "Sustaining Reductions in Catheter Related Bloodstream Infections in Michigan Intensive Care Units: Observational Study." BMJ. 2010; 340: c309. 4 Render M.L., Brung S., Kotagal U., Nicholson M., Burns P., Ellis D., Clifton M., Fardo F., Scott M., Hirschhorn L. "Evidence-Based Practice to Reduce Central Line Infections." Journal on Quality and Patient Safety. 2006; 32(5):253-260. 5 Edwards J.R., Peterson K.D., Andrus M.L., Dudeck M.A., Pollock D.A., Horan T.C., and the National Healthcare Safety Network Facilities. "National Healthcare Safety Network (NHSN) Report Data Summary for 2006 through 2007, Issued November 2008." American Journal of Infection Control. 2008; 36(9): 609-26. 6 Patient Safety Indicators Overview. AHRQ Quality Indicators. February 2006. Agency for Healthcare Research and Quality, Rockville, MD. www.qualityindicators.ahrq.gov/modules/psi_resources.aspx#techspecs. Accessed October 27, 2021. 7 HCUP CCS. Healthcare Cost and Utilization Project (HCUP). June 2009. U.S. Agency for Healthcare Research and Quality, Rockville, MD. www.hcup-us.ahrq.gov/toolssoftware/ccs/ccs.jsp. 8 Variables that indicate whether an infection is present on admission (POA) are not available on the HCUP NIS database. Therefore, this analysis cannot distinguish whether the infection developed during the same hospital stay, or was present at admission. 9 Coffey R., Barrett M., Houchens R., Moy E., Ho K., Andrews R., Moles E.Methods Applying AHRQ Quality Indicators to Healthcare Cost and Utilization Project (HCUP) Data for the Seventh (2009) National Healthcare Quality Report. HCUP Methods Series Report # 2009-01. Online August 17, 2009. U.S. Agency for Healthcare Research and Quality. Available: http://www.hcup-us.ahrq.gov/reports/methods/methods_topic.jsp. 10 HCUP Cost-to-Charge Ratio Files (CCR). Healthcare Cost and Utilization Project (HCUP). 2001–2007. U.S. Agency for Healthcare Research and Quality, Rockville, MD. www.hcup-us.ahrq.gov/db/state/costtocharge.jsp. |
| Table 1. Characteristics of stays with infections due to medical care, 2007 | |||
| Patient characteristics | Stays with infections due to medical care | All other staysa | |
|---|---|---|---|
| Number of stays (% of all stays) | 42,243 (0.2%) | 22,034,143 (99.8%) | |
| Age, years, N (%)b | |||
| 18–44 | 9,350 (22.1%) | 7,858,818 (35.7%) * | |
| 45–64 | 5,624,824 (25.5%) | 7,858,818 (35.7%) * | |
| 65+ | 18,995 (45.0%) | 8,395,283 (38.1%) * | |
| Sex, N (%) | |||
| Male | 20,745 (49.1%) | 7,800,207 (35.4%) * | |
| Female | 21,488 (50.9%) | 14,193,075 (64.4%) * | |
| Payer, N (%) | |||
| Medicare | 22,582 (53.5%) | 9,125,477 (41.4%) * | |
| Medicaid | 6,275 (14.9%) | 3,626,895 (16.5%) * | |
| Private | 10,001 (23.7%) | 7,071,471 (32.1%) * | |
| Uninsured | 1,868 (4.4%) | 1,366,998 (6.2%) * | |
| Other | 1,517 (3.6%) | 843,301 (3.8%) * | |
| Admission source, N (%) | |||
| Emergency department | 22,997 (54.4%) | 9,710,597 (44.1%) * | |
| Another hospital | 4,523 (10.7%) | 667,802 (3.0%) * | |
| Another health facility, including LTC | 1,251 (3.0%) | 294,561 (1.3%) * | |
| Length of stay, mean days | 24.4 | 5.2 * | |
| Comorbidities, mean | 2.8 | 1.9 * | |
| In-hospital mortality, N (%) | 3,787 (9.0%) | 331,431 (1.5%) * | |
| Total cost, mean dollars | $52,096 | $9,377 * | |
| Hospital size, beds, N (%) | |||
| Less than 100 | 3,316 (7.8%) | 2,318,044 (10.5%) * | |
| 100–299 | 14,799 (35.0%) | 8,504,305 (38.6%) * | |
| 300–499 | 13,874 (32.8%) | 6,641,532 (30.1%) | |
| 500 or more | 10,254 (24.3%) | 4,570,263 (20.7%) * | |
| Location, N (%) | |||
| Metropolitan | 39,407 (93.3%) | 19,002,339 (86.2%) * | |
| Non-metropolitan | 2,835 (6.7%) | 3,031,804 (13.8%) * | |
| Ownership Status, N (%) | |||
| Public, nonfederal | 5,823 (13.8%) | 3,101,382 (14.1%) | |
| Private, not for profit | 28,999 (68.6%) | 15,879,878 (72.1%) * | |
| Private, for profit | 7,420 (17.6%) | 3,052,883 (13.9%) * | |
| Teaching status, N (%) | |||
| Teaching hospital | 16,170 (38.3%) | 7,326,726 (33.3%) * | |
| Nonteaching hospital | 26,073 (61.7%) | 14,707,417 (66.7%) * | |
| * p‹0.05 a "All other stays" includes all other medical and surgical stays two or more days in length among those aged 18 and over or obstetric admissions, and excludes immunocompromised and cancer patients and admissions specifically for such infections. b Percentages for age do not add to 100. The number of children in each column is small and data is not shown. Source: Agency for Healthcare Research and Quality, Healthcare Cost and Utilization Project, Nationwide Inpatient Sample, 2007. | |||
| Table 2. Most common principal diagnoses for hospital stays with infections due to medical care, 2007 | ||||
| Rank | Principal diagnosisa | Number of stays with infections due to medical care | Percentage of stays with this diagnosis among stays | |
|---|---|---|---|---|
| Infections stays | All other stays b | |||
| 1 | Septicemia (except in labor) | 4,982 | 11.8% | 2.0% |
| 2 | Respiratory failure; insufficiency; arrest (adult) | 2,510 | 5.9% | 1.2% |
| 3 | Complications of surgical procedures or medical care | 1,743 | 4.1% | 1.3% |
| 4 | Acute myocardial infarction | 1,364 | 3.2% | 2.1% |
| 5 | Complication of device; implant or graft | 1,346 | 3.2% | 1.3% |
| 6 | Acute cerebrovascular disease | 1,289 | 3.1% | 1.8% |
| 7 | Pneumonia (except that caused by tuberculosis or STD) | 1,261 | 3.0% | 3.4% |
| 8 | Congestive heart failure; nonhypertensive | 1,198 | 2.8% | 3.4% |
| 9 | Intestinal obstruction without hernia | 1,153 | 2.7% | 0.9% |
| 10 | Pancreatic disorders (not diabetes) | 1,112 | 2.6% | 1.0% |
| a Principal diagnoses are grouped according to Clinical Classifications Software (CCS) categories. b "All other stays" includes all other medical and surgical stays two or more days in length among those aged 18 and over or obstetric admissions, and excludes immunocompromised and cancer patients and admissions specifically for such infections. Source: Agency for Healthcare Research and Quality, Healthcare Cost and Utilization Project, Nationwide Inpatient Sample, 2007. | ||||
|
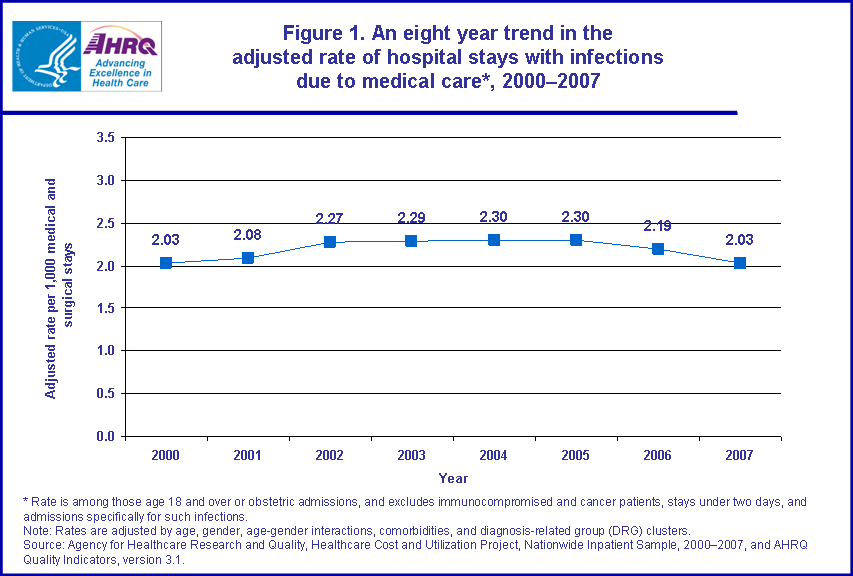
Figure 1. An eight year trend in the adjusted rate of hospital stays with infections due to medical care*, 2000–2007. Adjusted rate per 1,000 medical and surgical stays in 2000, 2.03; in the year 2001, 2.08; in 2002, 2.27; in 2003, 2.29; in 2004, 2.30; in 2005, 2.30; in 2006, 2.19; in 2007, 2.03. * Rate is among those age 18 and over or obstetric admissions, and excludes immunocompromised and cancer patients, stays under two days, and admissions specifically for such infections. Note: Rates are adjusted by age, sex, age-sex interactions, comorbidities, and diagnosis-related group (DRG) clusters. Source: Agency for Healthcare Research and Quality, Healthcare Cost and Utilization Project, Nationwide Inpatient Sample, 2000–2007, and AHRQ Quality Indicators, version 3.1.
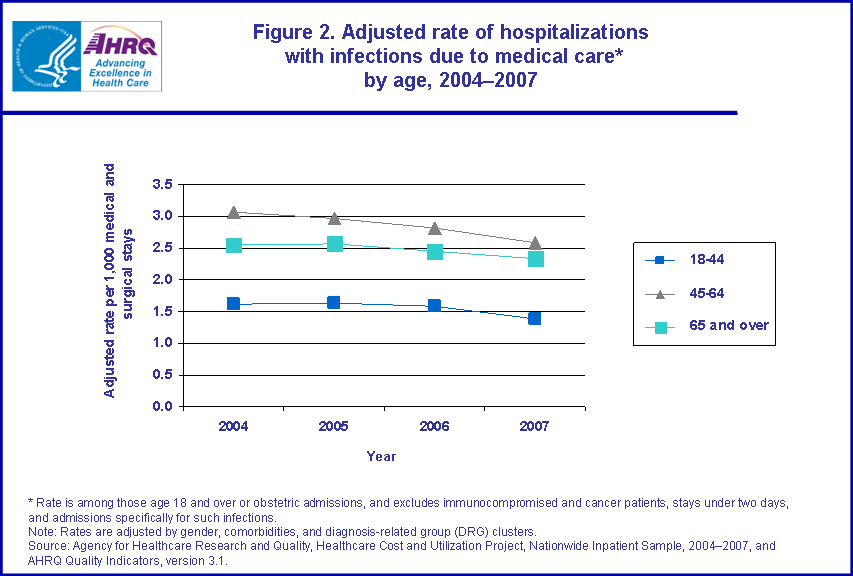
Figure 2. Adjusted rate of hospitalizations with infections due to medical care* by age, 2004–2007. Adjusted rate per 1,000 medical and surgical stays; ages 18 through 44; in the year 2004, 1.62; in 2005, 1.63; in 2006, 1.58; in 2007, 1.38. Adjusted rate per 1,000 medical and surgical stays; ages 45 through 64; in the year 2004, 3.06; in 2005, 2.96; in 2006, 2.82; in 2007, 2.58. Adjusted rate per 1,000 medical and surgical stays; age 65 and over; in the year 2004, 2.55; in 2005, 2.56; in 2006, 2.45; in 2007, 2.33. * Rate is among those age 18 and over or obstetric admissions, and excludes immunocompromised and cancer patients, stays under two days, and admissions specifically for such infections. Note: Rates are adjusted by sex, comorbidities, and diagnosis-related group (DRG) clusters. Source: Agency for Healthcare Research and Quality, Healthcare Cost and Utilization Project, Nationwide Inpatient Sample, 2004–2007, and AHRQ Quality Indicators, version 3.1.
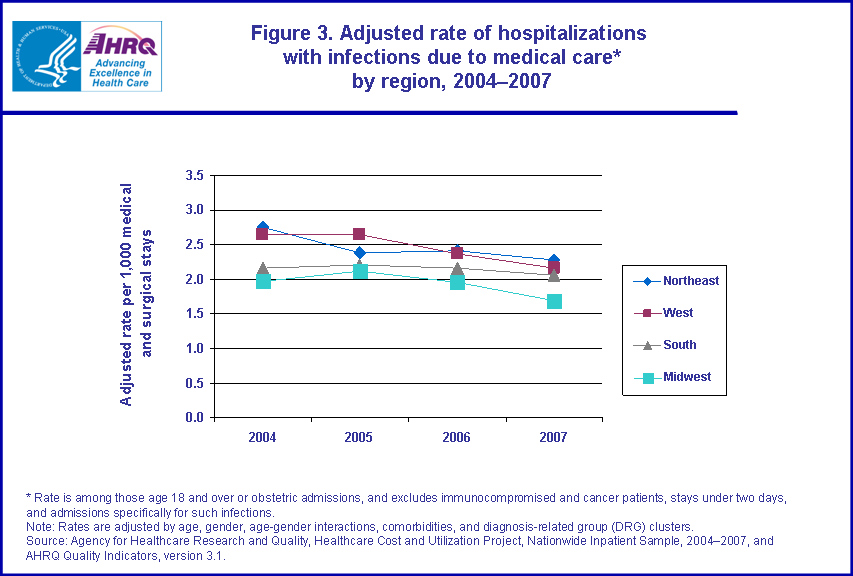
Figure 3. Adjusted rate of hospitalizations with infections due to medical care* by region, 2004–2007. Adjusted rate per 1,000 medical and surgical stays; Northeast, in the year 2004, 2.75; in 2005, 2.38; in 2006, 2.41; in 2007, 2.28. Adjusted rate per 1,000 medical and surgical stays; West, in the year 2004, 2.64; in 2005, 2.64; in 2006, 2.36; in 2007, 2.17. Adjusted rate per 1,000 medical and surgical stays; South; in the year 2004, 2.16; in 2005, 2.21; in 2006, 2.16; in 2007, 2.05. Adjusted rate per 1,000 medical and surgical stays; Midwest; in the year 2004, 1.97; in 2005, 2.12; in 2006, 1.96; in 2007, 1.69. Rate is among those age 18 and over or obstetric admissions, and excludes immunocompromised and cancer patients, stays under two days, and admissions specifically for such infections. Note: Rates are adjusted by age, sex, age-sex interactions, comorbidities, and diagnosis-related group (DRG) clusters. Source: Agency for Healthcare Research and Quality, Healthcare Cost and Utilization Project, Nationwide Inpatient Sample, 2004–2007, and AHRQ Quality Indicators, version 3.1.
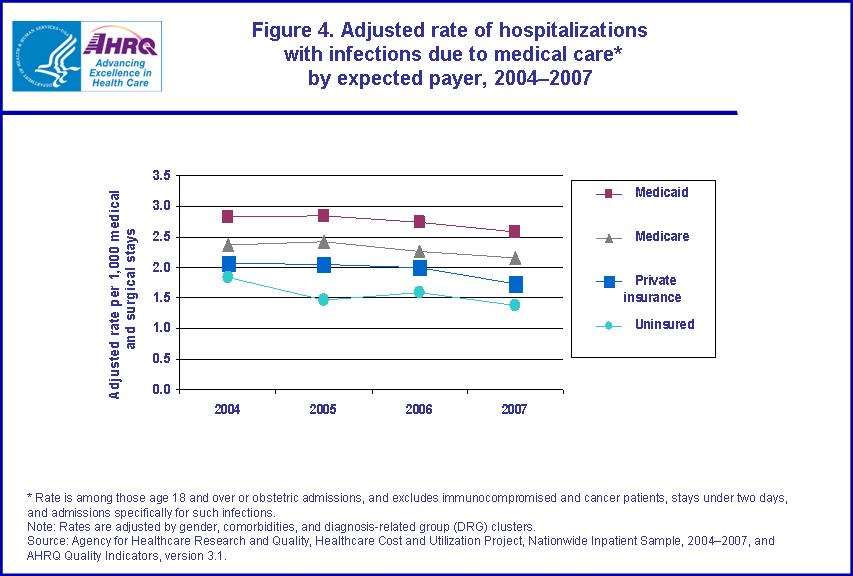
Figure 4. Adjusted rate of hospitalizations with infections due to medical care* by expected payer, 2004–2007. Adjusted rate per 1,000 medical and surgical stays; Medicaid, in the year 2004, 2.82; in 2005, 2.84; in 2006, 2.74; in 2007, 2.58. Adjusted rate per 1,000 medical and surgical stays; Medicare, in the year 2004, 2.37; in 2005, 2.42; in 2006, 2.27; in 2007, 2.16. Adjusted rate per 1,000 medical and surgical stays; Private insurance; in the year 2004, 2.06; in 2005, 2.06; in 2006, 1.99; in 2007, 1.74. Adjusted rate per 1,000 medical and surgical stays; Uninsured; in the year 2004, 1.84; in 2005, 1.46; in 2006, 1.60; in 2007, 1.39. Rate is among those age 18 and over or obstetric admissions, and excludes immunocompromised and cancer patients, stays under two days, and admissions specifically for such infections. Note: Rates are adjusted by sex, comorbidities, and diagnosis-related group (DRG) clusters. Source: Agency for Healthcare Research and Quality, Healthcare Cost and Utilization Project, Nationwide Inpatient Sample, 2004–2007, and AHRQ Quality Indicators, version 3.1.
|
| Internet Citation: Statistical Brief #94. Healthcare Cost and Utilization Project (HCUP). February 2011. Agency for Healthcare Research and Quality, Rockville, MD. hcup-us.ahrq.gov/reports/statbriefs/sb94.jsp. |
| Are you having problems viewing or printing pages on this website? |
| If you have comments, suggestions, and/or questions, please contact hcup@ahrq.gov. |
| If you are experiencing issues related to Section 508 accessibility of information on this website, please contact hcup@ahrq.gov. |
| Privacy Notice, Viewers & Players |
| Last modified 2/1/11 |