STATISTICAL BRIEF #83
|
|
December 2009
Elizabeth Stranges, M.S. and Bernard Friedman, Ph.D.
Introduction In 2007, adults aged 65 and over accounted for one third of all hospitalizations in the U.S.; the majority of these stays were paid for by Medicare.1 As the U.S. population ages, older adults will put increasing demands on healthcare providers and payers; older adults are at higher risk for a variety of diseases than younger adults and these diseases will occur with greater frequency among an older population than among a younger population. Improving the quality and effectiveness of outpatient services and disease management may reduce the demand placed on the system by the aging population by reducing potentially preventable hospitalizations. For example, drug therapy is an outpatient service which can be used to treat and manage both acute and chronic conditions. However, because out-of-pocket costs for drugs can be high, especially if a person has multiple chronic conditions or does not have health insurance coverage for drugs, individuals may make choices that put their health at risk and result in hospitalizations. In 2003 Congress enacted Medicare Part D to cover drug costs, and at the start of 2006 this coverage was open to choice by Medicare beneficiaries. Making drug therapy more accessible by reducing the out-of-pocket cost of drugs for the elderly may help maintain the health of the elderly and avoid hospitalizations. This Statistical Brief presents data from the Healthcare Cost and Utilization Project (HCUP) on rates of potentially preventable hospitalizations among adults ages 18�64 (younger adults) and adults aged 65 and over (older adults), and the change in those rates over time. The Agency for Healthcare Research and Quality (AHRQ)�s Prevention Quality Indicators (PQIs) were used to develop hospitalization rates for selected chronic and acute conditions in adults for 2003, 2005, and 2007. |
|
Findings
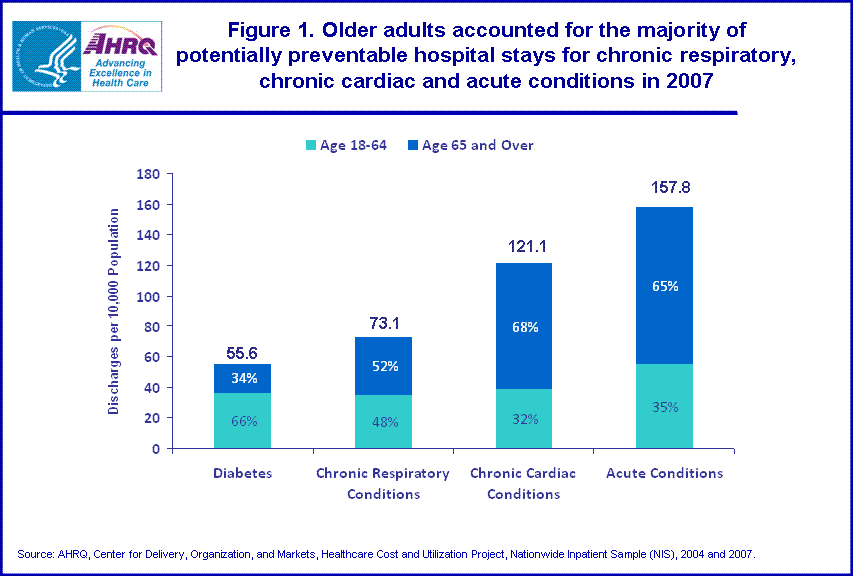
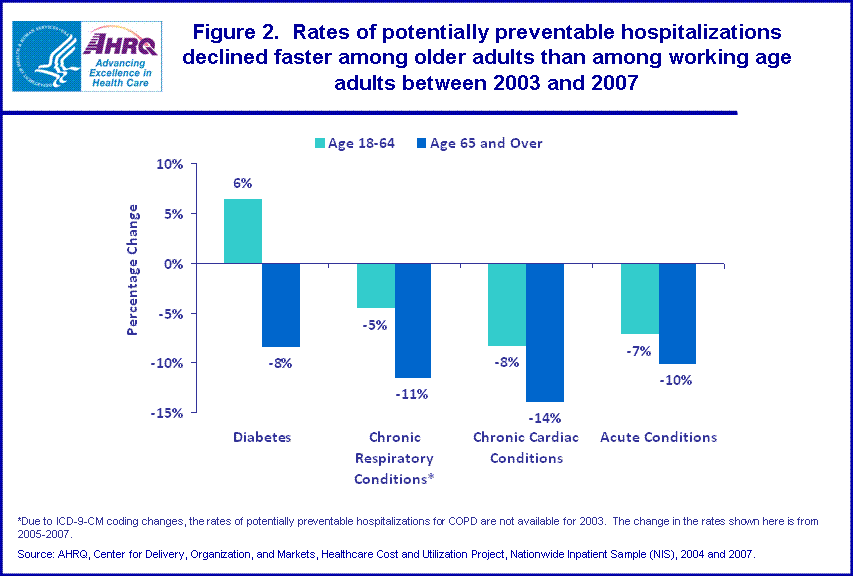
Rates of potentially preventable hospitalizations by age, 2007 In 2007, rates of potentially preventable hospitalizations for diabetes, chronic respiratory conditions, chronic cardiac conditions, and acute conditions were consistently higher for adults aged 65 and over than for younger adults (table 1). Overall, potentially preventable diabetes-related hospitalizations occurred 2.6 times more often among older adults than among younger adults (49.9 versus 19.4 discharges per 10,000 population). Table 1 shows that long-term diabetes complications were the most frequent reason for diabetes stays among both groups, and occurred 3.7 times more often among older adults than younger adults (32.8 versus 8.8 discharges per 10,000 population). In contrast, short-term diabetes complications occurred twice as often among younger adults than among older adults (6.5 discharges per 10,000 younger adults versus 3.3 discharges per 10,000 older adults). Potentially preventable stays for chronic respiratory conditions were 5.4 times more common among older adults as they were among younger adults (99.9 versus 18.5 discharges per 10,000 population). There were 78.4 stays for chronic obstructive pulmonary disease (COPD) and 21.6 stays for asthma for every 10,000 older adults. In contrast, there were 8.4 stays for COPD and 10.1 stays for asthma for every 10,000 younger adults. Hospital stays for chronic cardiac conditions which may have been prevented occurred over 10 times more often among older adults than among those ages 18�64 (214.7 versus 20.8 discharges per 10,000 population). Congestive heart failure was the most common chronic cardiac condition leading to preventable hospital stays among both younger and older adults (14.3 and 190.5 discharges per 10,000 population). The rates of potentially preventable hospital stays were much lower for hypertension (4.3 discharges per 10,000 younger adults and 16.6 discharges per 10,000 older adults) and angina without procedure (2.2 discharges per 10,000 younger adults and 7.6 discharges per 10,000 older adults). Potentially preventable hospital stays for acute conditions occurred almost 10 times as frequently among older adults as they did among younger adults (269.4 versus 29.2 discharges per 10,000 population). Bacterial pneumonia was the acute condition with the highest rate of hospitalizations among both younger and older adults (16.9 and 149.8 discharges per 10,000 population); stays for urinary tract infections and dehydration were not as common as those for bacterial pneumonia. Share of potentially preventable hospitalizations by age, 2007 While rates of hospitalization for many of these preventable conditions were substantially higher among older adults than among younger adults, the number of hospital stays for which each age group accounted was not as disparate because the younger population (189 million people) is much larger than the older adult population (38 million people). Figure 1 shows that younger adults accounted for 66 percent of 55,600 potentially preventable diabetes-related stays in 2007; older adults accounted for 34 percent. Also, although the rates of hospitalizations for acute conditions and for chronic cardiac conditions were about 10 times higher among older adults than among younger adults, older adults accounted for only about two-thirds of the total hospitalizations for these conditions. Change in rates of potentially preventable hospitalizations by age, 2003�2007 Between 2003 and 2007, rates of potentially preventable hospitalizations declined among older adults; for some types of conditions, they declined faster among older adults than they did among younger adults (figure 2). The rate of hospital stays for diabetes decreased by 8 percent among older adults between 2003 and 2007 (from 54.5 to 49.9 discharges per 10,000 population). In contrast, the rate of these stays among younger adults rose from 18.2 discharges to 19.4 discharges per 10,000 population, an increase of 6 percent. For older adults, the majority of the decrease in the rates of diabetes-related hospitalizations occurred between 2003 and 2005; the changes between 2005 and 2007 were less dramatic (table 2). Potentially preventable stays for cardiac conditions among older adults occurred 14 percent less frequently in 2007 (214.7 discharges per 10,000 population) than they did in 2003 (249.3 discharges per 10,000 population); the rate of hospitalizations for these conditions declined by 8 percent among younger adults during the same period. Among older adults, the rate of stay for angina without procedure fell almost by half (from 13.4 to 7.6 discharges per 10,000 population), and the rate of stay for congestive heart failure fell by 14 percent (from 222.4 to 190.5 discharges per 10,000 population) (table 2). Of the three types of potentially preventable hospitalizations for chronic cardiac conditions, hypertension was the only one for which the rate of hospitalizations for older adults increased between 2003 and 2007; in fact, the hospitalization rate for hypertension fell by 9 percent between 2003 and 2005 and then rose by 35 percent between 2005 and 2007. Among older adults, the rate of hospitalizations for acute conditions declined by 10 percent between 2003 and 2007, from 299.4 to 269.4 discharges per 10,000 population. The rate of stays for bacterial pneumonia contributed in large part to this change, dropping from 179.2 discharges per population to 149.8 discharges per population, while the rate of stays for urinary tract infections actually increased (from 66.4 to 76.4 discharges per 10,000 population) (table 2). Hospitalization rates for acute conditions among younger adults also decreased, but more modestly (from 31.4 to 29.2 discharges per 10,000 population, a change of 7 percent). For older and younger adults, the majority of the decrease in the rates of hospitalizations for these conditions overall occurred between 2005 and 2007. Data Source The estimates in this Statistical Brief are based upon data from the HCUP Nationwide Inpatient Sample, 2003, 2005 and 2007. Supplemental source included data on regional population estimates from Table 8: Annual Estimates of the Population for the United States, Regions, and Divisions: April 1, 2000 to July 1, 2008 (NST-EST2008-01), Population Division, U.S. Census Bureau, Release date: December 22, 2008 (https://www.census.gov/programs-surveys/popest/data/tables.html). Definitions Types of hospitals included in HCUP HCUP is based on data from community hospitals, defined as short-term, non-Federal, general and other hospitals, excluding hospital units of other institutions (e.g., prisons). HCUP data include OB-GYN, ENT, orthopedic, cancer, pediatric, public, and academic medical hospitals. They exclude long-term care, rehabilitation, psychiatric, and alcoholism and chemical dependency hospitals, but these types of discharges are included if they are from community hospitals. Unit of analysis The unit of analysis is the hospital discharge (i.e., the hospital stay), not a person or patient. This means that a person who is admitted to the hospital multiple times in one year will be counted each time as a separate "discharge" from the hospital. Prevention Quality Indicators The Prevention Quality Indicators (PQIs) are part of a set of AHRQ Quality Indicators (QIs) developed initially by investigators at Stanford University and the University of California under a contract with AHRQ. The PQIs are a set of measures that can be used with hospital inpatient discharge data to identify quality of care for �ambulatory care-sensitive conditions.� These are conditions for which good outpatient care can potentially prevent the need for hospitalization or for which early intervention can prevent complications or more severe disease. PQI rates can also be affected by other factors, such as disease prevalence. In this report, only observed rates are used, not the risk-adjusted rates (i.e., for age sexnder) which are used for area comparisons. The PQIs have been approved by the National Quality Forum and are maintained and updated by Batelle, Inc. under contract to AHRQ. Further information on the AHRQ QIs, including documentation and free software downloads, is available at http://www.qualityindicators.ahrq.gov/. This website includes information on the new version of the PQIs, Version 3.2. It also includes information on the new Pediatric Quality Indicators (PedQIs, formerly referred to as PDIs), which include the hospital admission rate measures for pediatric asthma and pediatric gastroenteritis. About HCUP HCUP is a family of powerful healthcare databases, software tools, and products for advancing research. Sponsored by the Agency for Healthcare Research and Quality (AHRQ), HCUP includes the largest all-payer encounter-level collection of longitudinal healthcare data (inpatient, ambulatory surgery, and emergency department) in the United States, beginning in 1988. HCUP is a Federal-State-Industry Partnership that brings together the data collection efforts of many organizations�such as State data organizations, hospital associations, private data organizations, and the Federal government�to create a national information resource. HCUP would not be possible without the contributions of the following data collection Partners from across the United States: Arizona Department of Health Services Arkansas Department of Health California Office of Statewide Health Planning and Development Colorado Hospital Association Connecticut Hospital Association Florida Agency for Health Care Administration Georgia Hospital Association Hawaii Health Information Corporation Illinois Department of Public Health Indiana Hospital Association Iowa Hospital Association Kansas Hospital Association Kentucky Cabinet for Health and Family Services Louisiana Department of Health and Hospitals Maine Health Data Organization Maryland Health Services Cost Review Commission Massachusetts Division of Health Care Finance and Policy Michigan Health & Hospital Association Minnesota Hospital Association Missouri Hospital Industry Data Institute Nebraska Hospital Association Nevada Department of Health and Human Services New Hampshire Department of Health & Human Services New Jersey Department of Health and Senior Services New York State Department of Health North Carolina Department of Health and Human Services Ohio Hospital Association Oklahoma State Department of Health Oregon Association of Hospitals and Health Systems Rhode Island Department of Health South Carolina State Budget & Control Board South Dakota Association of Healthcare Organizations Tennessee Hospital Association Texas Department of State Health Services Utah Department of Health Vermont Association of Hospitals and Health Systems Virginia Health Information Washington State Department of Health West Virginia Health Care Authority Wisconsin Department of Health Services Wyoming Hospital Association About the NIS The HCUP Nationwide Inpatient Sample (NIS) is a nationwide database of hospital inpatient stays. The NIS is nationally representative of all community hospitals (i.e., short-term, non-Federal, non-rehabilitation hospitals). The NIS is a sample of hospitals and includes all patients from each hospital, regardless of payer. It is drawn from a sampling frame that contains hospitals comprising about 90 percent of all discharges in the United States. The vast size of the NIS allows the study of topics at both the national and regional levels for specific subgroups of patients. In addition, NIS data are standardized across years to facilitate ease of use. For More Information For more information about HCUP, visit http://www.hcup-us.ahrq.gov. For additional HCUP statistics, visit HCUPnet, our interactive query system, at www.hcup-us.ahrq.gov. For information on other hospitalizations in the U.S., download HCUP Facts and Figures: Statistics on Hospital-Based Care in the United States in 2007, located at http://www.hcup-us.ahrq.gov/reports.jsp. For a detailed description of HCUP, more information on the design of the NIS, and methods to calculate estimates, please refer to the following publications: Steiner, C., Elixhauser, A., Schnaier, J. The Healthcare Cost and Utilization Project: An Overview. Effective Clinical Practice 5(3):143–51, 2002. Introduction to the HCUP Nationwide Inpatient Sample, 2007. Online. June 16, 2009. U.S. Agency for Healthcare Research and Quality. http://www.hcup-us.ahrq.gov/db/nation/nis/NIS_2007_INTRODUCTION.pdf. Houchens, R., Elixhauser, A. Final Report on Calculating Nationwide Inpatient Sample (NIS) Variances, 2001. HCUP Methods Series Report #2003-2. Online. June 2005 (revised June 6, 2005). U.S. Agency for Healthcare Research and Quality. http://www.hcup-us.ahrq.gov/reports/methods/2003_02.pdf. Houchens RL, Elixhauser A. Using the HCUP Nationwide Inpatient Sample to Estimate Trends. (Updated for 1988–2004). HCUP Methods Series Report #2006-05 Online. August 18, 2006. U.S. Agency for Healthcare Research and Quality. http://www.hcup-us.ahrq.gov/reports/methods/2006_05_NISTrendsReport_1988-2004.pdf. Suggested Citation Stranges, E., Friedman, B. Trends in Potentially Preventable Hospitalization Rates Declined for Older Adults, 2003�2007. HCUP Statistical Brief #83. December 2009. Agency for Healthcare Research and Quality, Rockville, MD. http://www.hcup-us.ahrq.gov/reports/statbriefs/sb83.pdf. *** AHRQ welcomes questions and comments from readers of this publication who are interested in obtaining more information about access, cost, use, financing, and quality of healthcare in the United States. We also invite you to tell us how you are using this Statistical Brief and other HCUP data and tools, and to share suggestions on how HCUP products might be enhanced to further meet your needs. Please e-mail us at hcup@ahrq.gov or send a letter to the address below:Irene Fraser, Ph.D., Director Center for Delivery, Organization, and Markets Agency for Healthcare Research and Quality 540 Gaither Road Rockville, MD 20850 1 Levit K, Wier L, Stranges E, Ryan K, Elixhauser A. HCUP Facts and Figures: Statistics on Hospital-based Care in the United States, 2007. Rockville, MD: Agency for Healthcare Research and Quality, 2009 (http://www.hcup-us.ahrq.gov/reports.jsp). |
| Table 1. Hospitalization rates for potentially preventable conditions by age, 2003, 2005, 2007. | ||||||
| Age 18�64 | Age 65 and Over | |||||
|---|---|---|---|---|---|---|
| 2003 | 2005 | 2007 | 2003 | 2005 | 2007 | |
| Number of discharges per 10,000 population | ||||||
| Diabetes | ||||||
| Short Term Diabetes Complications (PQI 1) | 5.9 | 6.0 | 6.5 | 4.1 | 3.7 | 3.3 |
| Long Term Diabetes Complications (PQI 3) | 8.1 | 8.6 | 8.8 | 33.5 | 32.7 | 32.8 |
| Uncontrolled Diabetes (PQI 14) | 1.9 | 1.7 | 1.8 | 4.9 | 3.8 | 3.9 |
| Lower-Extremity Amputation (PQI 16) | 2.3 | 2.3 | 2.3 | 12.0 | 10.4 | 9.9 |
| Chronic Cardiac Conditions | ||||||
| Hypertension (PQI 7) | 3.4 | 3.2 | 4.3 | 13.5 | 12.4 | 16.6 |
| Congestive Heart Failure (PQI 8) | 15.7 | 14.5 | 14.3 | 222.4 | 210.7 | 190.5 |
| Angina without Procedure (PQI 13) | 3.5 | 2.6 | 2.2 | 13.4 | 9.7 | 7.6 |
| Chronic Respiratory Conditions | ||||||
| Chronic Obstructive Pulmonary Disease (PQI 5) | * | 8.8 | 8.4 | * | 88.3 | 78.4 |
| Adult Asthma (PQI 15) | 11.8 | 10.6 | 10.1 | 23.1 | 24.5 | 21.6 |
| Acute Conditions | ||||||
| Dehydration (PQI 10) | 5.5 | 5.0 | 4.6 | 53.8 | 48.0 | 43.2 |
| Bacterial Pneumonia (PQI 11) | 18.3 | 18.2 | 16.9 | 179.2 | 184.0 | 149.8 |
| Urinary Tract Infection (PQI 12) | 7.6 | 7.6 | 7.7 | 66.4 | 72.6 | 76.4 |
| *Due to ICD-9-CM coding changes, comparable rates of these hospitalizations are not available for 2003. Source: AHRQ, Center for Delivery, Organization, and Markets. Healthcare Cost and Utilization Project, Nationwide Inpatient Sample, 2003, 2005, and 2007. | ||||||
| Table 2. Percentage change in hospitalization rates for potentially preventable conditions by age, 2003�2007. | ||||||
| 2003-2005 | 2005-2007 | 2003-2007 | ||||
|---|---|---|---|---|---|---|
| Age 18�64 | Age 65 and over | Age 18�64 | Age 65 and over | Age 18�64 | Age 65 and over | |
| Diabetes | ||||||
| Short Term Diabetes Complications (PQI 1) | 2% | -10% | 8% | -10% | 10% | -19% |
| Long Term Diabetes Complications (PQI 3) | 6% | -2% | 3% | 0% | 9% | -2% |
| Uncontrolled Diabetes (PQI 14) | -9% | -22% | 5% | 1% | -5% | -21% |
| Lower-Extremity Amputation (PQI 16) | -3% | -13% | 0% | -5% | -3% | -17% |
| Chronic Cardiac Conditions | ||||||
| Hypertension (PQI 7) | -6% | -9% | 33% | 35% | 25% | 23% |
| Congestive Heart Failure (PQI 8) | -8% | -5% | -1% | -10% | -9% | -14% |
| Angina without Procedure (PQI 13) | -27% | -27% | -16% | -22% | -39% | -43% |
| Chronic Respiratory Conditions | ||||||
| Chronic Obstructive Pulmonary Disease (PQI 5) | * | * | -4% | -11% | * | * |
| Adult Asthma (PQI 15) | -11% | 6% | -5% | -12% | -15% | -7% |
| Acute Conditions | ||||||
| Dehydration (PQI 10) | -9% | -11% | -8% | -10% | -16% | -20% |
| Bacterial Pneumonia (PQI 11) | -1% | 3% | -7% | -19% | -8% | -16% |
| Urinary Tract Infection (PQI 12) | 0% | 9% | 1% | 5% | 1% | 15% |
| *Due to ICD-9-CM coding changes, rates of potentially preventable hospitalizations are not available for 2003 and percent change involving this year cannot be calculated. Source: AHRQ, Center for Delivery, Organization, and Markets. Healthcare Cost and Utilization Project, Nationwide Inpatient Sample, 2003, 2005, and 2007. | ||||||
|
Figure 1. Older adults accounted for the majority of potentially preventable hospital stays for chronic respiratory, chronic cardiac and acute conditions in 2007. Bar chart, displays information for discharges per 10,000 population and distribution of discharges by age. For diabetes, a total of 55.6 discharges per 10,000 population; 66% ages 18 through 64, 34% age 65 and over. For chronic respiratory conditions, a total of 73.1 discharges per 10,000 population; 48% age 65 and over, 52% ages 18 through 64. For chronic cardiac conditions, a total of 121.1 discharges per 10,000 population; 32% ages 18 through 64, 68% age 65 an over. For acute conditions, a total of 157.8 discharges per 10,000 population; 35% ages 18 through 64, 65% age 65 an over. Source: AHRQ, Center for Delivery, Organization, and Markets, Healthcare Cost and Utilization Project, Nationwide Inpatient Sample (NIS), 2004 and 2007.
Figure 2. Rates of potentially preventable hospitalizations declined faster among older adults than among working age adults between 2003 and 2007. Bar chart; percentage change diabetes for age 18 through 64, 6% increase, age 65 and over, 8% decline; chronic respiratory conditions* for age 18 through 64, 5% decrease, age 65 and over 11% decrease; chronic cardiac conditions for age 18 through 64, 8% decrease, age 65 and over, 14% decrease; acute conditions for age 18 through 64, 7% decrease, age 65 and over, 10% decrease. *Due to ICD-9-CM coding changes, the rates of potentially preventable hospitalizations for COPD are not available for 2003. The change in the rates shown here is from 2005 through 2007. Source: AHRQ, Center for Delivery, Organization, and Markets, Healthcare Cost and Utilization Project, Nationwide Inpatient Sample (NIS), 2004 and 2007.
|
| Internet Citation: Statistical Brief #83. Healthcare Cost and Utilization Project (HCUP). March 2010. Agency for Healthcare Research and Quality, Rockville, MD. hcup-us.ahrq.gov/reports/statbriefs/sb83.jsp. |
| Are you having problems viewing or printing pages on this website? |
| If you have comments, suggestions, and/or questions, please contact hcup@ahrq.gov. |
| If you are experiencing issues related to Section 508 accessibility of information on this website, please contact hcup@ahrq.gov. |
| Privacy Notice, Viewers & Players |
| Last modified 3/4/10 |