STATISTICAL BRIEF #78
|
|
August 2009
Elizabeth Stranges, MS, Lauren Wier, MPH, Chaya T. Merrill, DrPH, and Claudia Steiner, MD, MPH
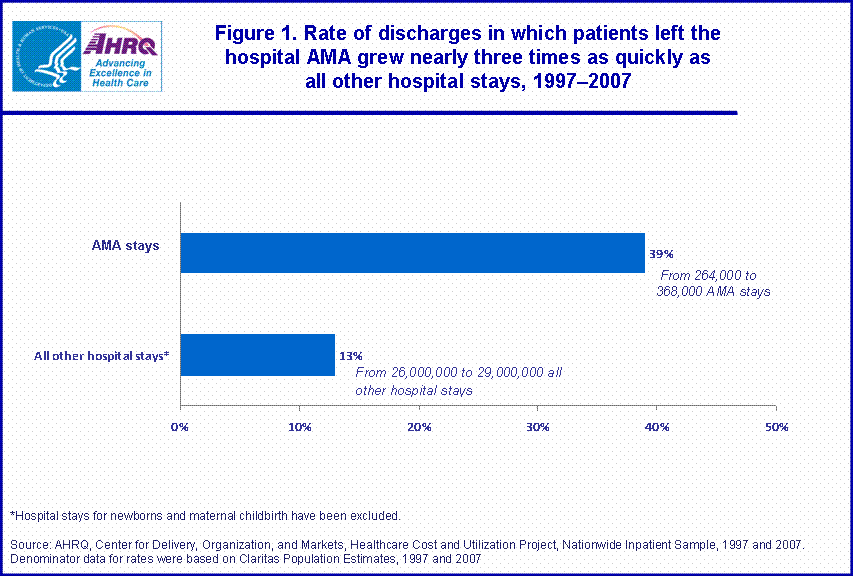
Introduction Patients who leave the hospital against medical advice (AMA) may be at increased risk for adverse health outcomes.1 Also, patients who leave AMA have significantly higher readmission rates compared to other patients.1 Patients may leave the hospital for various reasons, including financial considerations and stresses, family emergencies, self-assessment of their health status, or dissatisfaction with their treatment.1 Understanding the characteristics of hospital stays that result in patients leaving AMA is critical to designing strategies to prevent premature hospital departures that could result in adverse health outcomes. This Statistical Brief presents data from the Healthcare Cost and Utilization Project (HCUP) on hospital stays that ended with the patient leaving AMA in 2007. Utilization, resource, and patient characteristics of these hospitalizations are presented and compared to characteristics of all other non-maternal, non-newborn hospital stays.2 The most common reasons for AMA stays, as well as variations by patient location and geographic region, are provided. Differences between estimates noted in the text are statistically significant at the 0.05 level or better. Findings General Findings Hospitalizations in which the patient left AMA accounted for 368,000 hospital stays in 2007 (1.2 percent of all hospitalizations) (table 1). In 1997, they accounted for only 264,000 discharges. The 39 percent increase in AMAs between 1997 and 2007 far exceeded the growth in all other hospital stays during the same period (13 percent) (figure 1). On average, AMA stays were about 2.5 days shorter (2.7 versus 5.1 days) and about half as expensive ($5,300 versus $10,400) than all other hospital stays. AMA hospital stays, by patient characteristics, 2007 Characteristics of patients who left the hospital AMA differed from those of all other patients. The average age of the two groups differed by more than ten years (46 years for the AMA group compared to 58 years for all other hospital stays), and the pattern of stays by age group was different. Hospital stays ending AMA occurred most frequently among persons 45–64 years old (1.8 hospitalizations per 1,000 population); all other hospital stays occurred most frequently among individuals 65 years and older. In terms of sex, AMA stays were 1.6 times more common among males than females (1.5 versus 0.9 AMA stays per 1,000 population, respectively). The inverse was true of all other hospitals stays: women were 1.1 times more likely to be hospitalized than men (102.8 versus 91.5 stays per 1,000 population, respectively). |
|
Hospitalization rates were highest in the poorest communities across all hospital stays; however, the magnitude of difference was greater among stays that ended AMA. AMA stays were 2.7 times greater among patients living in the poorest communities than in the wealthiest communities (compared to 1.5 times greater in the poorest communities among all other hospital stays).
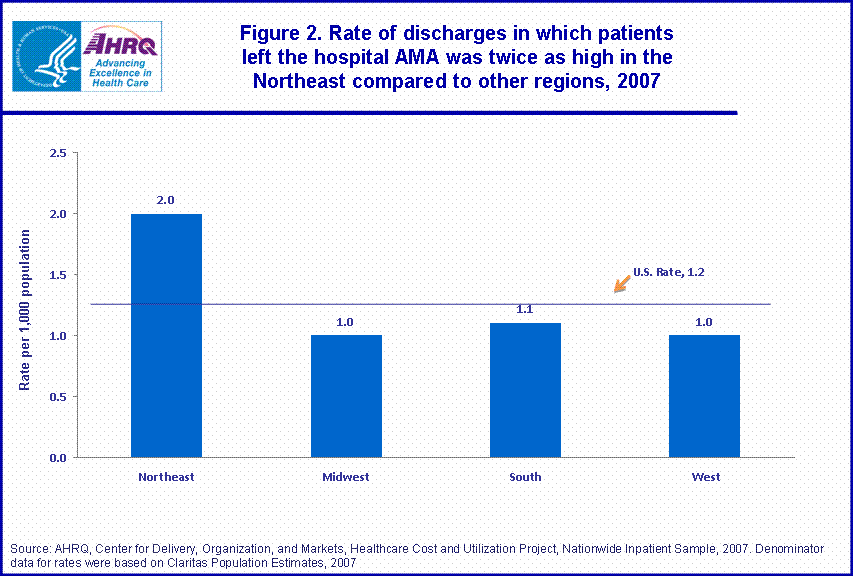
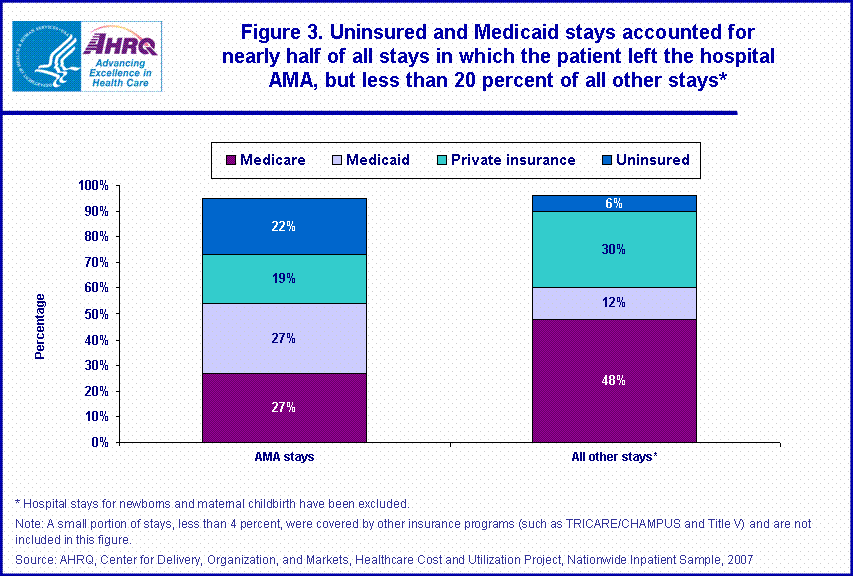
Patients living in large urban areas were nearly twice as likely to leave the hospital AMA compared to patients living in all other areas (1.8 AMA stays in urban areas versus about 1.0 stays in all other areas per 1,000 population). However, all other hospital stays—those in which the patient did not leave against medical advice—were not more likely to occur in urban areas. In fact, such stays were 20 to 30 percent more likely to occur among people living in rural areas than in other (111.8 stays in rural areas compared to about 90.0 stays in other areas per 1,000 population). AMA hospital stays, by region, 2007 The rate of AMA stays in the Northeast was double that of any other region (2.0 versus about 1.0 AMA stays per 1,000 population, respectively) (table 2 and figure 2). This pattern was not consistent with the rate of all other hospital stays, where all regions were similar (ranging from 103.4 to 108.0 stays per 1,000 population) except the West. The West had the lowest rate of non-AMA hospital stays at 73.0 stays per 1,000 population. AMA hospital stays, by payer, 2007 Uninsured stays and those billed to Medicaid accounted for a disproportionate share of hospitalizations in which patients left AMA, collectively accounting for about half of all AMA stays (figure 3). Uninsured and Medicaid stays accounted for 21.7 and 27.3 percent of AMA stays; whereas, they represented only 5.9 and 11.7 percent of all other hospital stays, respectively. Stays billed to Medicare and private insurance showed the opposite pattern: a smaller portion of these stays resulted in patients leaving the hospital AMA compared to their share of all other hospital stays. Most frequent reasons for AMA hospital stays, 2007 Table 3 highlights the five most frequent health conditions for which patients who left the hospital AMA were hospitalized. Three of the top five reasons for AMA hospital stays were mental health and substance abuse-related (alcohol-, substance-, and mood-related disorders). These three conditions collectively accounted for 16.4 percent of AMA stays (60,200 stays), while representing 3.0 percent of stays for all other hospitalizations. Patients hospitalized for alcohol- and substance-related disorders were 11.6 and 10.8 times more likely, respectively, to leave the hospital AMA; while, those hospitalized for mood disorders were twice as likely to leave AMA. The remaining two common conditions for which patients left the hospital AMA were for potentially preventable conditions3,4 or conditions for which a hospital stay may be avoided with effective and timely ambulatory care: nonspecific chest pain and diabetes with complications. These two conditions collectively accounted for 10.4 percent of AMA stays (38,100 stays) and were 3.6 and 2.7 times more common in AMA stays than other hospital stays, respectively. Data Source The estimates in this Statistical Brief are based upon data from the HCUP 2007 Nationwide Inpatient Sample (NIS). Many statistics were generated from HCUPnet, a free, online query system that provides users with immediate access to the largest set of publicly available, all-payer national, regional, and State-level hospital care databases from HCUP. A supplemental source included population data from Claritas (2007) to create population-based rates. Definitions Case Definition For this report, discharge against medical leave (AMA) was determined by the disposition of the patient at discharge as indicated on the medical record. Any discharge not defined as against medical advice (routine, in-hospital deaths, or discharge to short-term hospital, skilled nursing facility, intermediate care facility, another type of facility, home healthcare) was categorized as a non-AMA discharge. Diagnoses, Procedures, ICD-9-CM, and Clinical Classifications Software (CCS) The principal diagnosis is that condition established after study to be chiefly responsible for the patient’s admission to the hospital. All-listed procedures include all procedures performed during the hospital stay. ICD-9-CM is the International Classification of Diseases, Ninth Revision, Clinical Modification, which assigns numeric codes to diagnoses and procedures. There are about 13,600 ICD-9-CM diagnosis codes and 3,500 ICD-9-CM procedure codes. CCS categorizes ICD-9-CM diagnoses into a manageable number of clinically meaningful categories.5 This "clinical grouper" makes it easier to quickly understand patterns of diagnoses and procedures. Types of hospitals included in HCUP HCUP is based on data from community hospitals, defined as short-term, non-Federal, general and other hospitals, excluding hospital units of other institutions (e.g., prisons). HCUP data include OB-GYN, ENT, orthopedic, cancer, pediatric, public, and academic medical hospitals. They exclude long-term care, rehabilitation, psychiatric, and alcoholism and chemical dependency hospitals, but these types of discharges are included if they are from community hospitals. Unit of analysis The unit of analysis is the hospital discharge (i.e., the hospital stay), not a person or patient. This means that a person who is admitted to the hospital multiple times in one year will be counted each time as a separate "discharge" from the hospital. Costs and charges Total hospital charges were converted to costs using HCUP Cost-to-Charge Ratios based on hospital accounting reports from the Centers for Medicare and Medicaid Services (CMS). Costs will tend to reflect the actual costs of production, while charges represent what the hospital billed for the case. For each hospital, a hospital-wide cost-to-charge ratio is used because detailed charges are not available across all HCUP States. Hospital charges reflect the amount the hospital charged for the entire hospital stay and does not include professional (physician) fees. For the purposes of this Statistical Brief, costs are reported to the nearest hundred. Median income of the patient’s ZIP Code Median community-level income is the median household income of the patient's ZIP Code of residence. The cut-offs for the quartile designation are determined using ZIP Code demographic data obtained from Claritas. The income quartile value is missing for homeless and foreign patients. In 2006, the lowest income quartile ranged from $1–$37,999, while the highest income quartile was defined as $62,000 or above. Place of residence Urban-rural measurement for patient residence was based on the U.S. Office of Management and Budget (OMB) definitions of Core-Based Statistical Areas. OMB classifies counties into metropolitan and micropolitan areas. For this Statistical Brief, the metropolitan areas were further divided into large and small metropolitan areas using the Urban Influence Codes (UIC). Thus, for this report, counties were classified into one of four categories:
Region is one of the four regions defined by the U.S. Census Bureau:
Payer is the expected primary payer for the hospital stay. To make coding uniform across all HCUP data sources, payer combines detailed categories into more general groups:
About HCUP HCUP is a family of powerful healthcare databases, software tools, and products for advancing research. Sponsored by the Agency for Healthcare Research and Quality (AHRQ), HCUP includes the largest all-payer encounter-level collection of longitudinal healthcare data (inpatient, ambulatory surgery, and emergency department) in the United States, beginning in 1988. HCUP is a Federal-State-Industry Partnership that brings together the data collection efforts of many organizations—such as State data organizations, hospital associations, private data organizations, and the Federal government—to create a national information resource. HCUP would not be possible without the contributions of the following data collection Partners from across the United States: Arizona Department of Health Services Arkansas Department of Health California Office of Statewide Health Planning & Development Colorado Hospital Association Connecticut Hospital Association Florida Agency for Health Care Administration Georgia Hospital Association Hawaii Health Information Corporation Illinois Department of Public Health Indiana Health Association Iowa Hospital Association Kansas Hospital Association Kentucky Cabinet for Health and Family Services Maine Health Data Organization Maryland Health Services Cost Review Commission Massachusetts Division of Health Care Finance and Policy Michigan Health & Hospital Association Minnesota Hospital Association Missouri Hospital Industry Data Institute Nebraska Hospital Association Nevada Department of Health and Human Services New Hampshire Department of Health & Human Services New Jersey Department of Health and Senior Services New York State Department of Health North Carolina Department of Health and Human Services Ohio Hospital Association Oklahoma State Department of Health Oregon Association of Hospitals and Health Systems Rhode Island Department of Health South Carolina State Budget & Control Board South Dakota Association of Healthcare Organizations Tennessee Hospital Association Texas Department of State Health Services Utah Department of Health Vermont Association of Hospitals and Health Systems Virginia Health Information Washington State Department of Health West Virginia Health Care Authority Wisconsin Department of Health and Family Services Wyoming Hospital Association About the NIS The HCUP Nationwide Inpatient Sample (NIS) is a nationwide database of hospital inpatient stays. The NIS is nationally representative of all community hospitals (i.e., short-term, non-Federal, non-rehabilitation hospitals). The NIS is a sample of hospitals and includes all patients from each hospital, regardless of payer. It is drawn from a sampling frame that contains hospitals comprising about 90 percent of all discharges in the United States. The vast size of the NIS allows the study of topics at both the national and regional levels for specific subgroups of patients. In addition, NIS data are standardized across years to facilitate ease of use. About HCUPnet HCUPnet is an online query system that offers instant access to the largest set of all-payer healthcare databases that are publicly available. HCUPnet has an easy step-by-step query system, allowing for tables and graphs to be generated on national and regional statistics, as well as trends for community hospitals in the U.S. HCUPnet generates statistics using data from HCUP's Nationwide Inpatient Sample (NIS), the Kids' Inpatient Database (KID), the State Inpatient Databases (SID), and the State Emergency Department Databases (SEDD). For More Information For more information about HCUP, visit http://www.hcup-us.ahrq.gov. For additional HCUP statistics, visit HCUPnet, our interactive query system, at www.hcup-us.ahrq.gov. For information on other hospitalizations in the U.S., download HCUP Facts and Figures: Statistics on Hospital-based Care in the United States in 2006, located at http://www.hcup-us.ahrq.gov/reports.jsp. For a detailed description of HCUP, more information on the design of the NIS, and methods to calculate estimates, please refer to the following publications: Steiner, C., Elixhauser, A., Schnaier, J. The Healthcare Cost and Utilization Project: An Overview. Effective Clinical Practice5(3):143–51, 2002. Introduction to the HCUP Nationwide Inpatient Sample, 2007. Online. June 14, 2009. U.S. Agency for Healthcare Research and Quality. http://www.hcup-us.ahrq.gov/db/nation/nis/NIS_2007_INTRODUCTION.pdf. Houchens, R., Elixhauser, A. Final Report on Calculating Nationwide Inpatient Sample (NIS) Variances, 2001. HCUP Methods Series Report #2003-2. Online. June 2005 (revised June 6, 2005). U.S. Agency for Healthcare Research and Quality. http://www.hcup-us.ahrq.gov/reports/methods/2003_02.pdf Houchens, R.L., Elixhauser, A. Using the HCUP Nationwide Inpatient Sample to Estimate Trends. (Updated for 1988–2004). HCUP Methods Series Report #2006-05. Online. August 18, 2006. U.S. Agency for Healthcare Research and Quality. http://www.hcup-us.ahrq.gov/reports/methods/2006_05_NISTrendsReport_1988-2004.pdf. Suggested Citation Stranges, E. (Thomson Reuters), Wier, L. (Thomson Reuters), Merrill , C. (Thomson Reuters), and Steiner, C. (AHRQ). Hospitalizations in which Patients Leave the Hospital against Medical Advice (AMA), 2007. HCUP Statistical Brief #78. August 2009. Agency for Healthcare Research and Quality, Rockville, MD. http://www.hcup-us.ahrq.gov/reports/statbriefs/sb78.pdf. *** AHRQ welcomes questions and comments from readers of this publication who are interested in obtaining more information about access, cost, use, financing, and quality of healthcare in the United States. We also invite you to tell us how you are using this Statistical Brief and other HCUP data and tools, and to share suggestions on how HCUP products might be enhanced to further meet your needs. Please e-mail us at hcup@ahrq.gov or send a letter to the address below:Irene Fraser, Ph.D., Director Center for Delivery, Organization, and Markets Agency for Healthcare Research and Quality 540 Gaither Road Rockville, MD 20850 1Hwang, S.W., Li, J., et al. (2003). What happens to patients who leave against medical advice? CMAJ 168(4):417. 2Maternal and newborn stays were excluded from the comparison because these hospitalizations are very unlikely to leave AMA. Note that in the discussion below, the term all other hospital stays refers to non-AMA, non-maternal, and non-newborn stays. 3Prevention Quality Indicators Overview. AHRQ Quality Indicators. July 2004. Agency for Healthcare Research and Quality, Rockville, MD. www.qualityindicators.ahrq.gov/modules/pqi_resources.aspx#techspecs Accessed October 27, 2021. 4Billings J. Using Administrative Data to Monitor Access, Identify Disparities, and Assess Performance of the Safety Net. http://archive.ahrq.gov/data/safetynet/billings.htm 5HCUP CCS. Healthcare Cost and Utilization Project (HCUP). May 2008. U.S. Agency for Healthcare Research and Quality, Rockville, MD. www.hcup-us.ahrq.gov/toolssoftware/ccs/ccs.jsp. |
| Table 1. Characteristics of hospital stays for patients who leave the hospital against medical advice (AMA) compared to all other stays, 2007* | ||
| Hospital stays in which patients leave the hospital AMA | All other hospital stays* | |
|---|---|---|
| Total number of discharges | 368,000 | 29,365,000 |
| Mean length of stay, days | 2.7 | 5.1 |
| Mean hospital costs | $5,300 | $10,400 |
| Aggregate costs | $1.9 billion | $305.8 billion |
| *Hospital stays for newborns and maternal childbirth have been excluded.
Source: AHRQ, Center for Delivery, Organization, and Markets, Healthcare Cost and Utilization Project, Nationwide Inpatient Sample, 2007 | ||
| Table 2. Characteristics of patients who leave the hospital against medical advice (AMA) compared to all other patients, 2007 | ||
| Hospital stays in which patients leave the hospital AMA | All other hospital stays* | |
|---|---|---|
| Mean age, years | 46.1 | 58.3 |
| Age (rate per 1,000 population) | ||
| 1-17 years | 0.1 | 21.2 |
| 18-44 years | 1.5 | 46.9 |
| 45-64 years | 1.8 | 118.6 |
| 65 and older years | 1.4 | 345.7 |
| Sex (rate per 1,000 population) | ||
| Male | 1.5 | 91.5 |
| Female | 0.9 | 102.8 |
| Location of patient residence (rate per 1,000 population) | ||
| Large urban core | 1.8 | 93.7 |
| Large urban fringe (suburbs) | 1.0 | 87.9 |
| Small urban | 0.8 | 87.6 |
| Non-urban | 1.0 | 111.8 |
| Median household income (rate per 1,000 population) | ||
| Highest income communities (Quartile 4) | 0.7 | 77.0 |
| Upper-middle income Communities | 0.9 | 90.0 |
| Lower-middle income communities | 1.2 | 97.9 |
| Lowest income communities (Quartile 1) | 1.9 | 115.3 |
| Region (rate per 1,000 population) | ||
| Northeast | 2.0 | 108.0 |
| Midwest | 1.0 | 105.2 |
| South | 1.1 | 103.4 |
| West | 1.1 | 73.0 |
| Notes: *Hospital stays for newborns and maternal childbirth have been excluded. Age data are not presented for the less than 1 age group as this group is largely comprised of newborns. "Lowest income communities" included hospital stays with a median household income of the patient’s ZIP Code of residence of less than $39,000. About 2.5 percent of median community-level income data were missing on HCUP NIS records. Source: AHRQ, Center for Delivery, Organization, and Markets, Healthcare Cost and Utilization Project, Nationwide Inpatient Sample, 2007. Denominator data for rates were based on Claritas Population Estimates, 2007 | ||
| Table 3. Top 5 principal diagnoses among patients who left the hospital against medical advice (AMA), 2007 | ||||
| Rank (AMA patients) | Principal Diagnosis, CCS Category | Number (percent) of AMA stays | Number (percent) of non-AMA stays | Relative rate of stays with AMA versus non-AMA discharge |
|---|---|---|---|---|
| 1 | Nonspecific chest pain | 25,600 (7.0) | 762,900 (2.0) | 3.6 |
| 2 | Alcohol-related disorders | 25,300 (6.9) | 231,500 (0.6) | 11.6 |
| 3 | Substance-related disorders | 21,000 (5.7) | 207,900 (0.5) | 10.8 |
| 4 | Mood disorders | 13,900 (3.8) | 760,400 (1.9) | 1.9 |
| 5 | Diabetes with complications | 12,500 (3.4) | 498,000 (1.3) | 2.7 |
| Source: AHRQ, Center for Delivery, Organization, and Markets, Healthcare Cost and Utilization Project, Nationwide Inpatient Sample, 2007 | ||||
|
|
| Internet Citation: Statistical Brief #78. Healthcare Cost and Utilization Project (HCUP). August 2009. Agency for Healthcare Research and Quality, Rockville, MD. hcup-us.ahrq.gov/reports/statbriefs/sb78.jsp. |
| Are you having problems viewing or printing pages on this website? |
| If you have comments, suggestions, and/or questions, please contact hcup@ahrq.gov. |
| If you are experiencing issues related to Section 508 accessibility of information on this website, please contact hcup@ahrq.gov. |
| Privacy Notice, Viewers & Players |
| Last modified 8/18/09 |