STATISTICAL BRIEF #62
|
|
October 2008
Dani K. Saba, M.H.S., Katharine R. Levit, Anne Elixhauser, Ph.D.
Introduction Mental illness touches most Americans during their lifetimes, either directly or indirectly. Approximately 5.8 percent of American adults suffer from serious mental illness each year, translating to more than one in twenty individuals over the age of 18 with a serious mental disorder.1 An additional 9.8 percent has moderate mental illness and 10.5 percent has mild mental illness. Furthermore, 5-9 percent of children suffer from a serious mental disorder.2 Mental illness often co-occurs with somatic conditions, complicating treatment and raising overall medical costs. Moreover, when mental illness goes untreated, it is more likely to result in a hospitalization. The recent passage of mental health parity legislation3 for private health insurance coverage should increase access to mental health treatment, helping to mitigate the far-reaching affects of mental illness on social relationships, employment, and quality of life. This Statistical Brief presents data from the Healthcare Cost and Utilization Project (HCUP) on mental health stays at U.S. community hospitals in 2006. Variations in the characteristics of hospitalizations principally for mental health (MH) conditions as well as stays with MH conditions noted as a secondary condition are examined by age, sex, expected payer, and region. Findings General findings In 2006, there were approximately 1.4 million hospitalizations specifically for MH conditions (table 1). In total, 1 out of every 5 hospital stays included some mention of a MH condition as either a principal or secondary diagnosis (table 2). Mental health was listed as the main reason for hospitalization (i.e., the principal diagnosis) for 3.4 percent of all stays and as a secondary diagnosis in another 17.9 percent of all stays. Characteristics of stays principally for MH conditions differed from overall hospital stays (table 1). For example, the average length of stay for MH hospitalizations was greater than for all stays (8.2 days versus 4.6 days, respectively). Hospital charges for MH hospitalizations were about $3,300 less per day than overall hospital charges ($1,900 per day for MH stays compared to about $5,200 per day for all stays). Nearly 50 percent of stays with a principal diagnosis of MH conditions were admitted from the emergency department (ED) compared to about 44 percent of stays for all diagnoses. In addition, a higher share of MH stays compared to all hospital stays were for patients admitted from another hospital (6.2 percent versus 3.5 percent, respectively) and from a long-term facility (3.6 percent versus 1.3 percent, respectively). |
|
Demographic characteristics of patients hospitalized principally for MH conditions varied from the characteristics of stays for all diagnoses. For all hospital stays, hospitalization rates increased with age. However, stays principally for MH conditions did not vary appreciably in the adult age groups (about 5 to 6 discharges per 1,000 population) (table 2). The hospitalization rate was higher for adults compared to children under 18 years, who had the lowest rate of MH hospitalizations with 1.4 stays per 1,000 children. Unlike principal MH diagnoses, stays with secondary MH diagnoses increased with age—there were 2.6 stays per 1,000 population for children and adolescents, gradually increasing to 91.6 stays per 1,000 population for those 65 years and older.
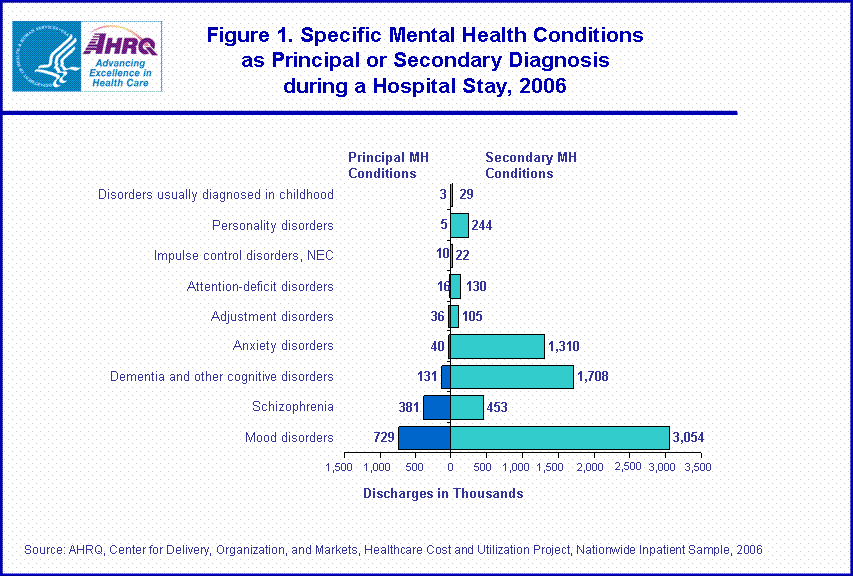
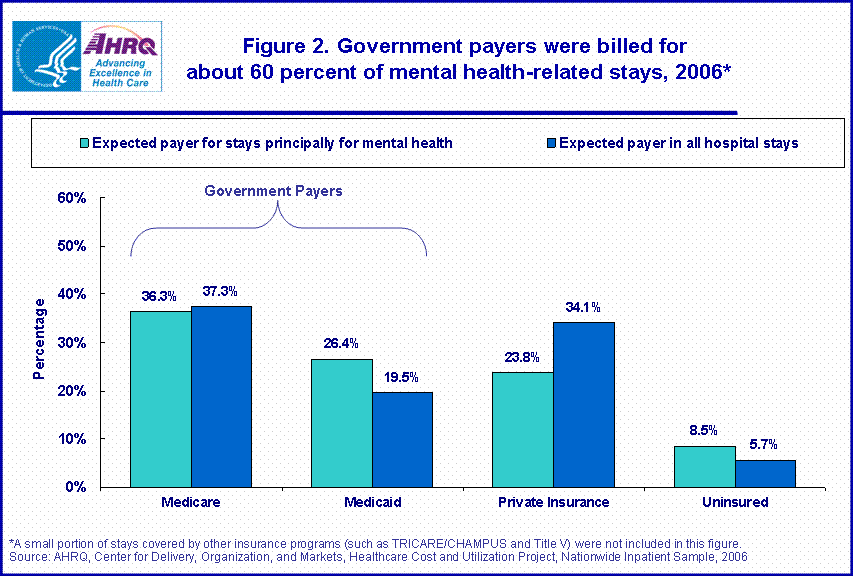
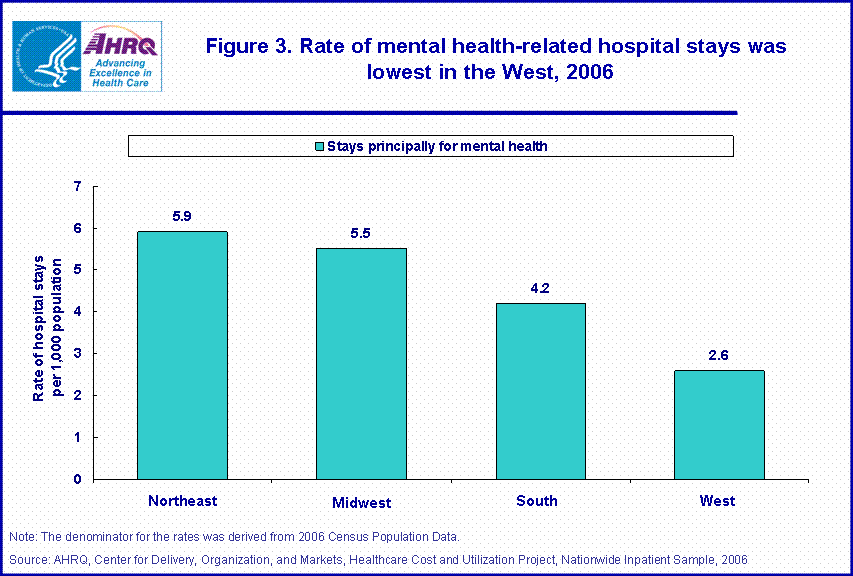
As with all hospital stays, females are more likely than males to be hospitalized with a MH diagnosis. There were 710,500 discharges for females and 635,300 for males in 2006—a rate of 4.7 discharges for every 1,000 females and 4.3 discharges for every 1,000 males. Females were also more likely to have a secondary MH diagnosis, which occurred in 20 percent of all female stays, compared to males who had a MH secondary diagnosis in 16 percent of their stays. As shown in figure 1, the two leading causes of MH hospitalizations were mood disorders (729,500 stays) and schizophrenia (380,600 discharges). Together, these conditions were responsible for 82 percent of all stays for which MH was the principal diagnosis. While mood disorders were also commonly listed as secondary diagnoses (3.1 million discharges or 43 percent of stays with MH listed as a secondary condition), schizophrenia was listed less frequently as a secondary condition (0.5 million stays, or 6 percent of stays with MH as a secondary condition). Common secondary MH conditions included dementia and other cognitive disorders, with 1.7 million stays, or 24 percent of all stays with MH as a secondary condition. Additionally, anxiety disorders were noted in 1.3 million stays, or 19 percent of stays with MH as a secondary condition. Hospital stays for mental health, by payer In 2006, government payers were billed for more than 60 percent of all MH discharges (figure 2). Relative to its shares of all hospital stays, Medicaid was billed for disproportionately more MH stays (26.4 percent of stays for MH conditions compared to 19.5 percent of all stays). Similar to its share of all hospital stays, Medicare was billed for just over a third of MH stays. On the other hand, private health insurance was billed for a disproportionately smaller share of all MH discharges compared to all discharges (23.8 percent versus 34.1 percent). Finally, a larger percent of MH stays were attributed to the uninsured population compared to uninsured stays for all diagnoses (8.5 percent versus 5.7 percent). Hospital stays for mental health, by region After adjusting for regional population differences, rates of MH hospitalization varied substantially by region. Figure 3 shows that the rate of MH hospitalization in the Northeast (5.9 stays per 1,000 population) was twice as high as in the West (2.6 stays per 1,000 population). Specific mental health conditions that required hospitalization, by age group and sex Table 3 shows that hospital stays for particular MH conditions tended to cluster by age of the patient. Mood disorders were the most common principal diagnoses for all non-elderly persons (1–64 year olds), accounting for 56 percent or more of all MH hospitalizations in each age group. For individuals 65 years and older, dementia and associated cognitive disorders were the most common cause of MH hospitalizations (50 percent). For 18–64 year olds, schizophrenia accounted for about one-third of all MH discharges (335,400 discharges). Table 4 shows that discharges for particular MH diagnoses tend to cluster by sex. Males were more likely to be hospitalized for schizophrenia, attention-deficit and related disorders, impulse control disorders, and disorders usually diagnosed in childhood. On the other hand, females were more likely to be hospitalized for mood disorders, dementia and related disorders, anxiety disorders, and personality disorders. Hospitalization rates for adjustment disorders did not vary appreciably by sex. Data Source The estimates in this Statistical Brief are based upon data from the HCUP 2006 Nationwide Inpatient Sample (NIS). The statistics were generated from HCUPnet, a free, online query system that provides users with immediate access to the largest set of publicly available, all-payer national, regional, and State-level hospital care databases from HCUP. Supplemental sources included denominator data for the population rates presented in table 2 and figure 4 were derived from 2006 Census Bureau Population Data. Definitions Diagnoses, ICD-9-CM, and Clinical Classifications Software (CCS) The principal diagnosis is that condition established after study to be chiefly responsible for the patient’s admission to the hospital. Secondary diagnoses are concomitant conditions that coexist at the time of admission or that develop during the stay. All-listed diagnoses include the principal diagnosis plus these additional secondary conditions. ICD-9-CM is the International Classification of Diseases, Ninth Revision, Clinical Modification, which assigns numeric codes to diagnoses. There are about 13,600 ICD-9-CM diagnosis codes. CCS categorizes ICD-9-CM diagnoses and procedures into clinically meaningful categories.4 This "clinical grouper" makes it easier to quickly understand patterns of diagnoses and procedures. Case Definition The CCS diagnosis codes used to identify mental health cases were: 650 Adjustment disorders 651 Anxiety disorders 652 Attention-deficit, conduct, and disruptive behavior disorders 653 Delirium, dementia, and amnestic and other cognitive disorders 655 Disorders usually diagnosed in infancy, childhood, or adolescence 656 Impulse control disorders, not elsewhere classified 657 Mood disorders 658 Personality disorders 659 Schizophrenia and other psychotic disorders Types of hospitals included in HCUP HCUP is based on data from community hospitals, defined as short-term, non-Federal, general and other hospitals, excluding hospital units of other institutions (e.g., prisons). HCUP data include OB-GYN, ENT, orthopedic, cancer, pediatric, public, and academic medical hospitals. They exclude long-term care, rehabilitation, psychiatric, and alcoholism and chemical dependency hospitals, but these types of discharges are included if they are from community hospitals. Unit of analysis The unit of analysis is the hospital discharge (i.e., the hospital stay), not a person or patient. This means that a person who is admitted to the hospital multiple times in one year will be counted each time as a separate "discharge" from the hospital. Charges For the purpose of this Statistical Brief, total average hospital charges were reported. Hospital charges reflect the amount the hospital charged for the entire hospital stay and do not include professional (physician) fees. Payer Payer is the expected primary payer for the hospital stay. To make coding uniform across all HCUP data sources, payer combines detailed categories into more general groups: – Medicare includes fee-for-service and managed care Medicare patients. – Medicaid includes fee-for-service and managed care Medicaid patients. Patients covered by the State Children's Health Insurance Program (SCHIP) may be included here. Because most state data do not identify SCHIP patients specifically, it is not possible to present this information separately. – Private insurance includes Blue Cross, commercial carriers, and private HMOs and PPOs. – Other includes Worker's Compensation, TRICARE/CHAMPUS, CHAMPVA, Title V, and other government programs. – Uninsured includes an insurance status of "self-pay" and "no charge." When more than one payer is listed for a hospital discharge, the first-listed payer is used. Admission source Admission source indicates where the patient was located prior to admission to the hospital. Emergency admission indicates the patient was admitted to the hospital through the emergency department. Admission from another hospital indicates the patient was admitted to this hospital from another short-term, acute-care hospital. This usually signifies that the patient required the transfer in order to obtain more specialized services that the originating hospital could not provide. Admission from long-term care facility indicates the patient was admitted from a long-term facility such as a nursing home. Region Region is one of the four regions defined by the U.S. Bureau of the Census: Northeast, Midwest, South, and West: – Northeast is defined as Connecticut, Maine, Massachusetts, New Hampshire, New Jersey, New York, Pennsylvania, Rhode Island and Vermont – Midwest is defined as Illinois, Indiana, Iowa, Kansas, Minnesota, Missouri, Michigan, Nebraska, North Dakota, Ohio, South Dakota, and Wisconsin – South is defined as Alabama, Arkansas, Delaware, District of Columbia, Florida, Georgia, Kentucky, Maryland, Mississippi, Louisiana, North Carolina, Oklahoma, South Carolina, Tennessee, Texas, Virginia, and West Virginia – West is defined as Alaska, Arizona, California, Colorado, Hawaii, Idaho, Montana, Nevada, New Mexico, Oregon, Utah, Washington, and Wyoming. Not all states participate in HCUP, so not all states will be present in HCUP data. However, the statistics have been weighted to represent the entire U.S. About HCUP HCUP is a family of powerful healthcare databases, software tools, and products for advancing research. Sponsored by the Agency for Healthcare Research and Quality (AHRQ), HCUP includes the largest all-payer encounter-level collection of longitudinal healthcare data (inpatient, ambulatory surgery, and emergency department) in the United States, beginning in 1988. HCUP is a Federal-State-Industry Partnership that brings together the data collection efforts of many organizations—such as State data organizations, hospital associations, private data organizations, and the Federal government—to create a national information resource. HCUP would not be possible without the contributions of the following data collection Partners from across the United States: Arizona Department of Health Services Arkansas Department of Health & Human Services California Office of Statewide Health Planning & Development Colorado Hospital Association Connecticut Integrated Health Information (Chime, Inc.) Florida Agency for Health Care Administration Georgia Hospital Association Hawaii Health Information Corporation Illinois Department of Public Health Indiana Hospital & Health Association Iowa Hospital Association Kansas Hospital Association Kentucky Cabinet for Health and Family Services Maine Health Data Organization Maryland Health Services Cost Review Commission Massachusetts Division of Health Care Finance and Policy Michigan Health & Hospital Association Minnesota Hospital Association Missouri Hospital Industry Data Institute Nebraska Hospital Association Nevada Department of Health and Human Services New Hampshire Department of Health & Human Services New Jersey Department of Health and Senior Services New York State Department of Health North Carolina Department of Health and Human Services Ohio Hospital Association Oklahoma State Department of Health Oregon Association of Hospitals and Health Systems Rhode Island Department of Health South Carolina State Budget & Control Board South Dakota Association of Healthcare Organizations Tennessee Hospital Association Texas Department of State Health Services Utah Department of Health Vermont Association of Hospitals and Health Systems Virginia Health Information Washington State Department of Health West Virginia Health Care Authority Wisconsin Department of Health & Family Services About the NIS The HCUP Nationwide Inpatient Sample (NIS) is a nationwide database of hospital inpatient stays. The NIS is nationally representative of all community hospitals (i.e., short-term, non-Federal, non-rehabilitation hospitals). The NIS is a sample of hospitals and includes all patients from each hospital, regardless of payer. It is drawn from a sampling frame that contains hospitals comprising about 90 percent of all discharges in the United States. The vast size of the NIS allows the study of topics at both the national and regional levels for specific subgroups of patients. In addition, NIS data are standardized across years to facilitate ease of use. About HCUPnet HCUPnet is an online query system that offers instant access to the largest set of all-payer healthcare databases that are publicly available. HCUPnet has an easy step-by-step query system, allowing for tables and graphs to be generated on national and regional statistics, as well as trends for community hospitals in the U.S. HCUPnet generates statistics using data from HCUP's Nationwide Inpatient Sample (NIS), the Kids' Inpatient Database (KID), the State Inpatient Databases (SID) and the State Emergency Department Databases (SEDD). Data for this statistical brief came from the specialized HCUPnet MHSA Database (an MHSA subset of the NIS discharge records), as well as from the all-inclusive HCUP NIS Database. For More Information For more information about HCUP, visit www.hcup–us.ahrq.gov. For additional HCUP statistics, visit HCUPnet, our interactive query system, at www.hcup.ahrq.gov. For information on other hospitalizations in the U.S., download HCUP Facts and Figures 2006: Statistics on Hospital-based Care in the United States,, located at http://www.hcup–us.ahrq.gov/reports.jsp. For a detailed description of HCUP, more information on the design of the NIS, and methods to calculate estimates, please refer to the following publications: Steiner, C., Elixhauser, A., Schnaier, J. The Healthcare Cost and Utilization Project: An Overview. Effective Clinical Practice 5(3):143–51, 2002. Design of the HCUP Nationwide Inpatient Sample, 2005. Online. June 13, 2007. U.S. Agency for Healthcare Research and Quality. http://www.hcup-us.ahrq.gov/db/nation/nis/reports/NIS_2005_Design_Report.pdf Houchens, R., Elixhauser, A. Final Report on Calculating Nationwide Inpatient Sample (NIS) Variances, 2001. HCUP Methods Series Report #2003-2. Online. June 2005 (revised June 6, 2005). U.S. Agency for Healthcare Research and Quality. http://www.hcup-us.ahrq.gov/reports/methods/2003_02.pdf Houchens RL, Elixhauser A. Using the HCUP Nationwide Inpatient Sample to Estimate Trends. (Updated for 1988-2004). HCUP Methods Series Report #2006-05 Online. August 18, 2006. U.S. Agency for Healthcare Research and Quality. https://www.hcup-us.ahrq.gov/reports/methods/2006_05_NISTrendsReport_1988-2004A.pdf Suggested Citation Saba, D.K. (Thomson Reuters), Levit, K.R. (Thomson Reuters), and Elixhauser, A. (AHRQ). Hospital Stays Related to Mental Health, 2006. HCUP Statistical Brief #62. October 2008. Agency for Healthcare Research and Quality, Rockville, MD, http://www.hcup-us.ahrq.gov/reports/statbriefs/sb62.pdf *** AHRQ welcomes questions and comments from readers of this publication who are interested in obtaining more information about access, cost, use, financing, and quality of healthcare in the United States. We also invite you to tell us how you are using this Statistical Brief and other HCUP data and tools, and to share suggestions on how HCUP products might be enhanced to further meet your needs. Please e–mail us at hcup@ahrq.gov or send a letter to the address below:Irene Fraser, Ph.D., Director Center for Delivery, Organization, and Markets Agency for Healthcare Research and Quality 540 Gaither Road Rockville, MD 20850 1 Kessler RC, Chiu WT, Demler O, Walters EE. Prevalence, severity, and comorbidity of twelve-month DSM-IV disorders in the National Comorbidity Survey Replication (NCS-R). Archives of General Psychiatry, 2005 Jun; 62(6):617-27. 2 Report of the New Freedom Commission on Mental Health. October 2002. Accessed at http://govinfo.library.unt.edu/mentalhealthcommission/press/nov1_rpt.htm on July 22, 2008. 3 Jenkins CL. Law Equalizes Coverage For Mental, Physical Care. The Washington Post, October 10, 2008, B1. 4 HCUP CCS. Healthcare Cost and Utilization Project (HCUP). August 2006. U.S. Agency for Healthcare Research and Quality, Rockville, MD. |
| Table 1. Characteristics of hospital stays for mental health compared to all stays, for all age groups, 2006 | ||
| Hospitals Stays | ||
|---|---|---|
| Mental health, principal diagnosis | All diagnoses | |
| Number of hospital stays | 1,350,700 | 39,450,200 |
| Mean length of stay, days | 8.2 | 4.6 |
| Mean charge per stay, dollars | $15,400 | $24,000 |
| Mean charge per day, dollars | $1,900 | $5,200 |
| Percent admitted from the emergency department | 49.3% | 43.8% |
| Percent admitted from another hospital | 6.2% | 3.5% |
| Percent admitted from long-term facility | 3.6% | 1.3% |
| Source: AHRQ, Center for Delivery, Organization, and Markets, Healthcare Cost and Utilization Project, Nationwide Inpatient Sample, 2006 | ||
| Table 2. Hospital stays for mental health compared to stays with mental health as a secondary condition and all stays, by age group and sex, 2006 | |||
| Mental health, principal diagnosis | Mental health, secondary condition | All diagnoses | |
|---|---|---|---|
| Number of Discharges | |||
| All discharges* | 1,350,700 | 7,055,300 | 39,450,200 |
| Percent of all stays | 3.4% | 17.9% | |
| Age | |||
| 1-17 years | 98,800 | 184,000 | 1,711,000 |
| 18-44 years | 617,500 | 1,513,100 | 10,211,700 |
| 45-64 years | 392,600 | 1,945,600 | 9,099,800 |
| 65+ years | 239,800 | 3,411,300 | 13,482,000 |
| Sex | |||
| Female | 710,500 | 4,514,100 | 23,051,600 |
| Male | 635,300 | 2,539,400 | 16,296,000 |
| Rate of hospitalization per 1,000 population | |||
| All discharges* | 4.5 | 23.6 | 131.9 |
| Age | |||
| 1-17 years | 1.4 | 2.6 | 24.6 |
| 18-44 years | 5.4 | 13.3 | 90.1 |
| 45-64 years | 5.2 | 26.0 | 121.6 |
| 65+ years | 6.4 | 91.6 | 362.1 |
| Sex | |||
| Female | 4.7 | 29.8 | 152.0 |
| Male | 4.3 | 17.2 | 110.5 |
| * Includes some discharges for under 1 year olds and discharges with missing age or sex. Therefore, discharges by age and sex listed in this table will not sum to this total. Source: AHRQ, Center for Delivery, Organization, and Markets, Healthcare Cost and Utilization Project, Nationwide Inpatient Sample, 2006. | |||
| Table 3. Most common mental health conditions that resulted in hospitalization, by age group, 2006 | ||||||
| Rank | Principal Diagnosis | Age Groups | ||||
|---|---|---|---|---|---|---|
| Total* | 1–17 | 18–44 | 45–64 | 65+ | ||
| Number of discharges by age group | ||||||
| Mental health conditions | 1,350,700 | 98,800 | 617,500 | 392,600 | 239,800 | |
| 1 | Mood disorders | 729,500 | 62,100 | 374,600 | 220,600 | 71,200 |
| 2 | Schizophrenia and other psychotic disorders | 380,600 | 5,000 | 192,200 | 143,200 | 39,500 |
| 3 | Delirium, dementia, and amnestic and other cognitive disorders | 131,100 | 600 | 2,100 | 8,600 | 119,700 |
| 4 | Anxiety disorders | 39,500 | 4,800 | 16,400 | 11,600 | 6,700 |
| 5 | Adjustment disorders | 36,300 | 5,100 | 22,700 | 6,500 | 1,900 |
| 6 | Attention-deficit, conduct, and disruptive behavior disorders | 15,700 | 14,200 | 900 | 200 | 300 |
| 7 | Impulse control, NEC | 9,800 | 4,100 | 4,800 | 700 | 200 |
| 8 | Personality disorders | 4,800 | 300 | 3,200 | 1,000 | 300 |
| 9 | Disorders usually diagnosed in infancy, childhood, or adolescence | 3,300 | 2,600 | 600 | 100 | 0 |
| Distribution of discharges within age group | ||||||
| Mental health conditions | 100.0% | 100.0% | 100.0% | 100.0% | 100.0% | |
| 1 | Mood disorders | 54.0% | 62.9% | 60.7% | 56.2% | 29.7% |
| 2 | Schizophrenia and other psychotic disorders | 28.2% | 5.1% | 31.1% | 36.5% | 16.5% |
| 3 | Delirium, dementia, and amnestic and other cognitive disorders | 9.7% | 0.6% | 0.3% | 2.2% | 49.9% |
| 4 | Anxiety disorders | 2.9% | 4.9% | 2.7% | 3.0% | 2.8% |
| 5 | Adjustment disorders | 2.7% | 5.2% | 3.7% | 1.7% | 0.8% |
| 6 | Attention-deficit, conduct, and disruptive behavior disorders | 1.2% | 14.4% | 0.1% | 0.1% | 0.1% |
| 7 | Impulse control, NEC | 0.7% | 4.1% | 0.8% | 0.2% | 0.1% |
| 8 | Personality disorders | 0.4% | 0.3% | 0.5% | 0.3% | 0.1% |
| 9 | Disorders usually diagnosed in infancy, childhood, or adolescence | 0.2% | 2.6% | 0.1% | 0.0% | 0.0% |
| * Includes some discharges for under 1 year olds and discharges with missing age. Therefore, discharges by age will not sum to this total. Source: AHRQ, Center for Delivery, Organization, and Markets, Healthcare Cost and Utilization Project, Nationwide Inpatient Sample, 2006 | ||||||
| Table 4. Most common mental health conditions that resulted in hospitalization, by sex, 2006 | |||||||
| Principal Diagnosis | Number of Discharges | Distribution of Discharges by Sex | |||||
|---|---|---|---|---|---|---|---|
| Sex | Sex | ||||||
| Total* | Male | Female | Total* | Male | Female | ||
| Rank | Mental health conditions | 1,350,700 | 635,300 | 710,500 | 100.0% | 47.0% | 52.6% |
| 1 | Mood disorders | 729,500 | 309,600 | 417,500 | 100.0% | 42.4% | 57.2% |
| 2 | Schizophrenia and other psychotic disorders | 380,600 | 215,600 | 162,900 | 100.0% | 56.6% | 42.8% |
| 3 | Delirium, dementia, and amnestic and other cognitive disorders | 131,100 | 55,900 | 75,200 | 100.0% | 42.6% | 57.3% |
| 4 | Anxiety disorders | 39,500 | 15,100 | 24,400 | 100.0% | 38.1% | 61.7% |
| 5 | Adjustment disorders | 36,300 | 17,600 | 18,500 | 100.0% | 48.4% | 51.1% |
| 6 | Attention-deficit, conduct, and disruptive behavior disorders | 15,700 | 10,500 | 5,100 | 100.0% | 66.8% | 32.7% |
| 7 | Impulse control, NEC | 9,800 | 6,800 | 3,000 | 100.0% | 69.5% | 30.3% |
| 8 | Personality disorders | 4,800 | 1,700 | 3,000 | 100.0% | 36.4% | 63.3% |
| 9 | Disorders usually diagnosed in infancy, childhood, or adolescence | 3,300 | 2,500 | 800 | 100.0% | 76.1% | 23.5% |
| *Includes some discharges with missing sex. Source: AHRQ, Center for Delivery, Organization, and Markets, Healthcare Cost and Utilization Project, Nationwide Inpatient Sample, 2006 | |||||||
|
|