STATISTICAL BRIEF #56
|
|
July 2008
Anne Elixhauser, Ph.D.
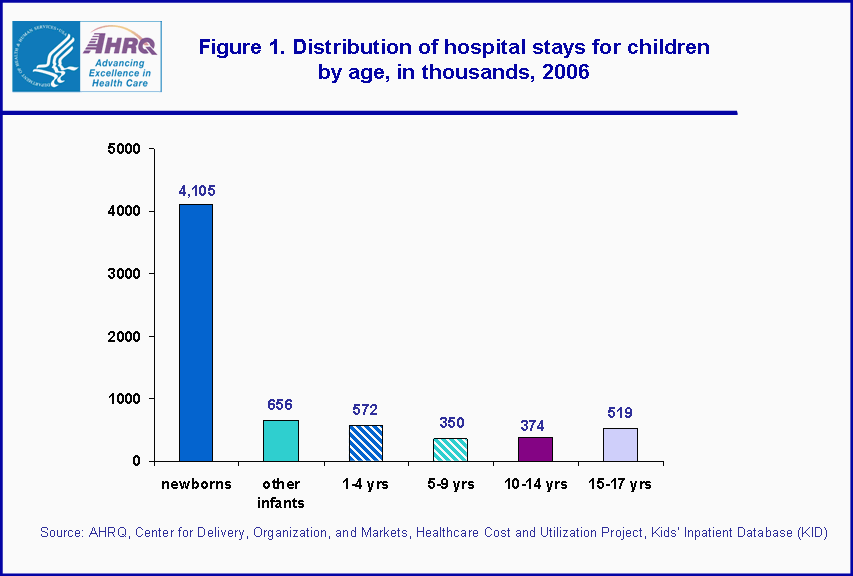
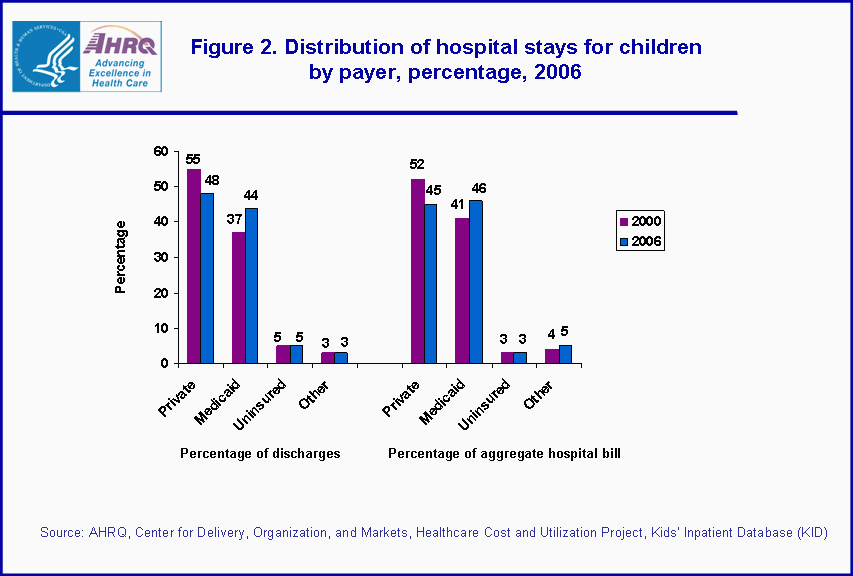
Introduction One out of every six discharges from U.S. hospitals is for children 17 years and younger; the majority of these are newborn infants. This Statistical Brief presents data from the Healthcare Cost and Utilization Project’s Kids’ Inpatient Database (KID)—the only database specifically developed to study hospitalizations of children. All differences between estimates noted in the text are statistically significant at the 0.05 level or better. Findings Table 1 provides information on the hospitalization of children compared to all U.S. hospital stays. In 2006, there were nearly 6.6 million hospital stays for children 17 years or younger in the U.S., comprising 17 percent of all hospitalizations. The total hospital bill for children’s stays was $83.7 billion, about 9 percent of the total hospital bill for all patients. Charges for children’s hospitalizations were about half as much as the overall hospital charge. The mean length of stay for children’s hospitalizations was significantly shorter than the overall length of stay—3.7 days versus 4.6 days. Only 17 percent of children in the hospital were admitted through the emergency department (ED), compared with 44 percent overall. The vast majority of children experienced routine discharges compared to about three out of four discharges in general. Children experienced significantly fewer transfers to other acute care hospitals or other institutions, fewer discharges to home healthcare and fewer discharges against medical advice. The in—hospital death rate for children was one-fifth the death rate overall. Distribution by age Figure 1 shows the age distribution for children admitted to the hospital. Nearly 4.8 million discharges (about 73%) were for infants younger than one year of age, of whom 4.1 million (62%) were newborn infants. There were about 656,000 infants hospitalized in the first year of life (following birth). Children ages 1–4 made up nearly 9 percent of all pediatric discharges, 5–9 year olds comprised 5 percent, 10–14 year olds comprised 6 percent, and 15–17 year olds accounted for 8 percent of pediatric discharges. Distribution by payer Figure 2 shows the distribution of children’s stays in hospitals by primary expected pay source, comparing 2000 and 2006. Although 55 percent of all hospital stays for children 17 years and younger were covered by private insurance in 2000, by 2006 that percentage had declined to less than half (48 percent). Medicaid was the expected payer for 37 percent of all stays in 2000, but this had increased to 44 percent in 2006. For both 2000 and 2006, 5 percent of children’s stays were uninsured and 3 percent were covered by other payers such as Medicare and other government programs. |
|
Figure 2 also shows the percentage of the total hospital charges billed to various payers. Hospital stays covered by private insurance were billed $38.0 billion (45 percent of the total bill) while the bill to Medicaid was $38.8 billion (46 percent of the total bill). This is a significant change since 2000 when private insurance was billed for 52 percent of children’s hospitalizations and Medicaid was billed for 41 percent of stays.
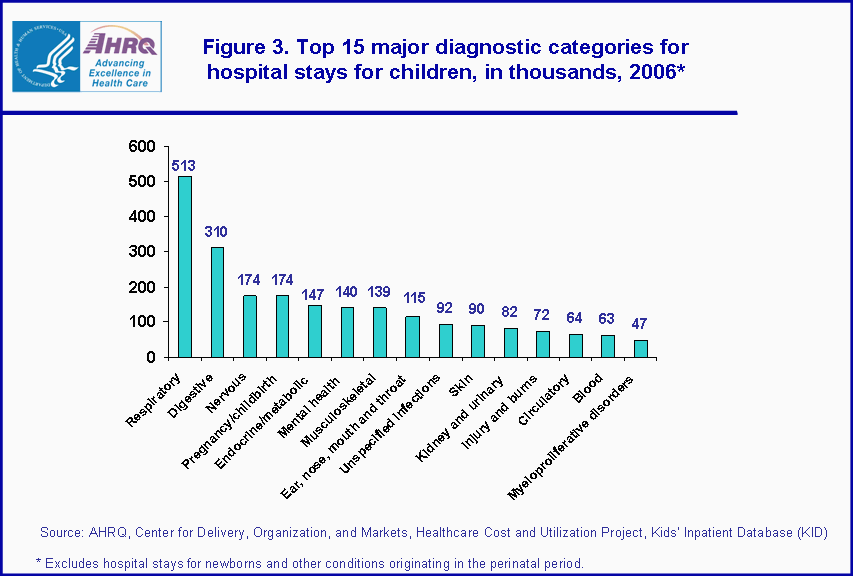
Most common major diagnostic categories for children’s admissions Figure 3 depicts reasons for hospital stays based on the most frequent major diagnostic category (MDC) associated with the stay. The diagnostic category of newborns and other conditions originating in the perinatal period was excluded, resulting in 2.3 million non-newborn pediatric stays. Respiratory conditions were the most frequent reason for admission to the hospital among non-newborns, accounting for more than 1 in 5 non-newborn stays (22 percent). Digestive conditions made up nearly 1 in 7 non-newborn stays (14 percent). Adolescent pregnancy comprised nearly 8 percent of stays, but declined from 196,000 hospitalizations in 2000 to 174,000 in 2006. Disorders of the nervous system also accounted for 8 percent of non—newborn stays. Endocrine/metabolic, mental health, and musculoskeletal disorders each accounted for about 6 percent of non-newborn stays. Disorders of the ear, nose, mouth, and throat accounted for 5 percent of stays. Unspecified infections, skin disorders, and kidney disorders each made up 4 percent of non-newborn hospitalizations. Skin disorders was the only MDC to increase in rank from the 15th most common condition in 2000 (57,000 stays, not shown) to the 11th most common in 2006 (90,000 stays). Injuries (including poisonings, multiple trauma, and burns) accounted for about 3 percent of all pediatric hospitalizations. Circulatory and blood disorders each accounted or nearly 3 percent of non-newborn stays. All remaining MDCs each accounted for 2 percent or fewer of non-newborn stays. Most common specific conditions for children’s admissions Table 2 shows the most common reasons for admission to the hospital based on more specific diagnosis information and again excludes conditions related to newborns. The top three conditions were related to the respiratory system—pneumonia, acute bronchitis, and asthma. Five of the top 10 conditions are infections—pneumonia, bronchitis, and skin, intestinal, and urinary tract infections. The fourth ranked condition—fluid and electrolyte disorders—is often a complication of intestinal infections. The fifth most common condition is a surgical diagnosis—appendicitis. The sixth most common reason for admission to the hospital among children is a mental health condition—affective disorders, which include depression and bipolar disorder. Epilepsy and convulsions are also among the top 10 conditions, ranking seventh. The only major change in the ranking of diagnoses over the last seven years relates to skin and subcutaneous infections, which was ranked 17th in 2000 (not shown), but ranked 8th in 2006. Most common hospital procedures received by children Table 3 shows the most common non-diagnostic, therapeutic, or operative procedures received by children in U.S. hospitals (diagnostic tests are excluded from this listing). The most common procedure received by children in the hospital was circumcision, which was performed on about 1.1 million infant males. The second most common procedure was prophylactic vaccination, which consisted primarily of hepatitis B vaccine, given to nearly 635,000 infants. Ranking third, but with far fewer cases, was respiratory intubation and mechanical ventilation which was received by about 139,000 cases, primarily for infant respiratory distress syndrome. Appendectomy was the only non—obstetric major operating room procedure that fell into the top 10 and ranked 4th. Cancer chemotherapy and enteral and parenteral nutrition (tube feeding) were the 5th and 6th most common procedures. Two procedures received by adolescents giving birth—Cesarean section and repair of obstetric laceration—ranked 7th and 8th. Incision and drainage of skin and subcutaneous infection—conducted primarily for infections—ranked 9th, while blood transfusions were the 10th most common pediatric procedure. Data Source The estimates in this Statistical Brief are based on data from HCUP’s Kids’ Inpatient Database (KID) for 2006. The statistics were generated from HCUPnet, a free, online query system that provides users with immediate access to largest set of publicly available, all-payer national, regional, and State-level hospital care databases from HCUP. Definitions Diagnoses, ICD-9-CM, and Clinical Classifications Software (CCS) The principal diagnosis is that condition established after study to be chiefly responsible for the patient’s admission to the hospital. CCS categorizes ICD-9-CM diagnoses into about 260 clinically meaningful categories.1 This "clinical grouper" makes it easier to quickly understand patterns of diagnoses and procedures. ICD-9-CM is the International Classification of Diseases, Ninth Revision, Clinical Modification, which assigns numeric codes to diagnoses. There are about 13,600 ICD-9-CM diagnosis codes. Major Diagnostic Category (MDC) MDCs are broad categories of diagnoses which generally group conditions by body system or etiology. In 2006 there were 26 MDCs. Procedures and Clinical Classifications Software (CCS) All-listed procedures include any procedures included on the discharge record. CCS categorizes procedure codes into about 230 clinically meaningful categories.1 This "clinical grouper" makes it easier to quickly understand patterns of procedure use. There are nearly 4,000 ICD-9-CM procedure codes. Types of hospitals included in HCUP HCUP is based on data from community hospitals, defined as short-term, non—Federal, general and other hospitals, excluding hospital units of other institutions (e.g., prisons). HCUP data include OB-GYN, ENT, orthopedic, cancer, pediatric, public, and academic medical hospitals. They exclude long—term care, rehabilitation, psychiatric, and alcoholism and chemical dependency hospitals, but these types of discharges are included if they are from community hospitals. Unit of analysis The unit of analysis is the hospital discharge (i.e., the hospital stay), not a person or patient. This means that a person who is admitted to the hospital multiple times in one year will be counted each time as a separate "discharge" from the hospital. Charges Charges represent what the hospital billed for the case. Hospital charges reflect the amount the hospital charged for the entire hospital stay and do not include professional (physician) fees. For the purposes of this Statistical Brief, charges are rounded to the nearest hundred dollars. Payer Payer is the expected primary payer for the hospital stay. To make coding uniform across all HCUP data sources, payer combines detailed categories into more general groups: – Medicare includes fee-for-service and managed care Medicare patients. – Medicaid includes fee-for-service and managed care Medicaid patients. Patients covered by the State Children's Health Insurance Program (SCHIP) may be included here. Because most state data do not identify SCHIP patients specifically, it is not possible to present this information separately. – Private insurance includes Blue Cross, commercial carriers, and private HMOs and PPOs. – Other includes Worker's Compensation, TRICARE/CHAMPUS, CHAMPVA, Title V, and other government programs. – Uninsured includes an insurance status of "self-pay" and "no charge." When more than one payer is listed for a hospital discharge, the first—listed payer is used. Admission source Admission source indicates where the patient was located prior to admission to the hospital. Emergency admission indicates the patient was admitted to the hospital through the emergency department. Admission from another hospital indicates the patient was admitted to this hospital from another short-term, acute—care hospital. This usually signifies that the patient required the transfer in order to obtain more specialized services that the originating hospital could not provide. Admission from long-term care facility indicates the patient was admitted from a long—term facility such as a nursing home. Discharge status Discharge status indicates the disposition of the patient at discharge from the hospital, and includes the following six categories: routine (to home), transfer to another short—term hospital, other transfers (including skilled nursing facility, intermediate care, and another type of facility such as a nursing home), home healthcare, against medical advice (AMA), or died in the hospital. About HCUP HCUP is a family of powerful healthcare databases, software tools, and products for advancing research. Sponsored by the Agency for Healthcare Research and Quality (AHRQ), HCUP includes the largest all—payer encounter—level collection of longitudinal healthcare data (inpatient, ambulatory surgery, and emergency department) in the United States, beginning in 1988. HCUP is a Federal—State—Industry Partnership that brings together the data collection efforts of many organizations—such as State data organizations, hospital associations, private data organizations, and the Federal government—to create a national information resource. HCUP would not be possible without the contributions of the following data collection Partners from across the United States: Arizona Department of Health Services Arkansas Department of Health California Office of Statewide Health Planning & Development Colorado Hospital Association Connecticut Integrated Health Information (Chime, Inc.) Florida Agency for Health Care Administration Georgia Hospital Association Hawaii Health Information Corporation Illinois Department of Public Health Indiana Hospital Association Iowa Hospital Association Kansas Hospital Association Kentucky Cabinet for Health and Family Services Maine Health Data Organization Maryland Health Services Cost Review Commission Massachusetts Division of Health Care Finance and Policy Michigan Health & Hospital Association Minnesota Hospital Association Missouri Hospital Industry Data Institute Nebraska Hospital Association Nevada Division of Health Care Financing and Policy, Department of Health and Human Services New Hampshire Department of Health & Human Services New Jersey Department of Health and Senior Services New York State Department of Health North Carolina Department of Health and Human Services Ohio Hospital Association Oklahoma Health Care Information Center for Health Statistics Oregon Health Policy and Research Rhode Island Department of Health South Carolina State Budget & Control Board South Dakota Association of Healthcare Organizations Tennessee Hospital Association Texas Department of State Health Services Utah Department of Health Vermont Association of Hospitals and Health Systems Virginia Health Information Washington State Department of Health West Virginia Health Care Authority Wisconsin Department of Health & Family Services About the KID The HCUP Kids’ Inpatient Database (KID) is a nationwide database of hospital inpatient stays. The KID is the only dataset on hospital use, outcomes, and charges designed to study children’s use of hospital services in the United States. The KID is a sample of discharges from all community, non-rehabilitation hospitals in States participating in HCUP. The target universe includes pediatric discharges from community, non-rehabilitation hospitals in the United States. Pediatric discharges are defined as all discharges where the patient was age 20 or less at admission. For this analysis only discharges for children 17 years and younger were included. The KID’s large sample size enables analyses of rare conditions, such as congenital anomalies and uncommon treatments, such as organ transplantation. It can be used to study a wide range of topics including the economic burden of pediatric conditions, access to services, quality of care and patient safety, and the impact of health policy changes. The KID is produced every three years; prior databases are available for 1997, 2000, and 2003. About HCUPnet HCUPnet is an online query system that offers instant access to the largest set of all-payer healthcare databases that are publicly available. HCUPnet has an easy step-by-step query system, allowing for tables and graphs to be generated on national and regional statistics, as well as trends for community hospitals in the U.S. HCUPnet generates statistics using data from HCUP's Nationwide Inpatient Sample (NIS), the Kids’ Inpatient Database (KID), the State Inpatient Databases (SID) and the State Emergency Department Databases (SEDD). For More Information For more information about HCUP, visit www.hcup-us.ahrq.gov. For additional HCUP statistics, visit HCUPnet, our interactive query system, at www.hcup.ahrq.gov. For information on other hospitalizations in the U.S., download HCUP Facts and Figures: Statistics on Hospital-based Care in the United States in 2005, located at http://www.hcup-us.ahrq.gov/reports.jsp. For a detailed description of HCUP, more information on the design of the KID, and methods to calculate estimates, please refer to the following publications: Steiner, C., Elixhauser, A., Schnaier, J. The Healthcare Cost and Utilization Project: An Overview. Effective Clinical Practice 5(3):143–51, 2002. Introduction to the HCUP Kids’ Inpatient Database, 2006. Online. June 2008. U.S. Agency for Healthcare Research and Quality. http://www.hcup-us.ahrq.gov/db/nation/kid/kiddbdocumentation.jsp. Houchens, R., Elixhauser, A. Final Report on Calculating Nationwide Inpatient Sample (NIS) Variances, 2001. HCUP Methods Series Report #2003-2. Online. June 2005 (revised June 6, 2005). U.S. Agency for Healthcare Research and Quality. http://www.hcup-us.ahrq.gov/reports/methods/2003_02.pdf. Suggested Citation Elixhauser, A. (AHRQ). Hospital Stays for Children, 2006. HCUP Statistical Brief #56. July 2008. Agency for Healthcare Research and Quality, Rockville, MD. http://www.hcup-us.ahrq.gov/reports/statbriefs/sb56.pdf. *** AHRQ welcomes questions and comments from readers of this publication who are interested in obtaining more information about access, cost, use, financing, and quality of healthcare in the United States. We also invite you to tell us how you are using this Statistical Brief and other HCUP data and tools, and to share suggestions on how HCUP products might be enhanced to further meet your needs. Please e-mail us at hcup@ahrq.gov or send a letter to the address below:Irene Fraser, Ph.D., Director Center for Delivery, Organization, and Markets Agency for Healthcare Research and Quality 540 Gaither Road Rockville, MD 20850 1HCUP CCS. Healthcare Cost and Utilization Project (HCUP). May 2008. U.S. Agency for Healthcare Research and Quality, Rockville, MD. www.hcup-us.ahrq.gov/toolssoftware/ccs/ccs.jsp. |
| Table 1. Characteristics of hospital stays for children, compared to all hospital stays, 2006 | ||
| Children, 17 years and younger | All discharges | |
|---|---|---|
| Total number of discharges | 6,578,000 | 39,450,000 |
| Aggregate charges (in billions), the "hospital bill" | $83.7 | $943.4 |
| Charges, mean | $12,700 | $24,000 |
| Length of stay, mean (in days) | 3.7 | 4.6 |
| Admitted through the emergency department | 17.3% | 43.8% |
| Discharge status | ||
| Routine | 93.9% | 73.5% |
| To another hospital | 1.6% | 2.2% |
| To another institution (nursing home, rehabilitation) | 0.8% | 12.2% |
| Home healthcare | 3.2% | 9.1% |
| Against medical advice | ‹0.1% | 1.0% |
| Died in the hospital | 0.4% | 2.0% |
| Source: AHRQ, Center for Delivery, Organization, and Markets, Healthcare Cost and Utilization Project, Kids’ Inpatient Database (KID), 2006 | ||
| Table 2. Most common specific reasons for admission to the hospital, 2006* | |
| Principal diagnosis | Number of discharges |
|---|---|
| 1. Pneumonia | 162,000 |
| 2. Acute bronchitis | 140,000 |
| 3. Asthma | 137,700 |
| 4. Fluid and electrolyte disorders | 90,100 |
| 5. Appendicitis | 82,500 |
| 6. Affective disorders | 73,600 |
| 7. Epilepsy, convulsions | 69,500 |
| 8. Skin and subcutaneous tissue infections | 67,200 |
| 9. Intestinal infections | 53.200 |
| 10. Urinary tract infections | 49,400 |
| * Excludes newborn conditions Source: AHRQ, Center for Delivery, Organization, and Markets, Healthcare Cost and Utilization Project, Kids’ Inpatient Database (KID), 2006 | |
| Table 3. Most common principal procedures received by children in U.S. hospitals, 2006* | |
| Principal Procedures | Number of discharges |
|---|---|
| 1. Circumcision | 1,145,900 |
| 2. Prophylactic vaccinations | 634,700 |
| 3. Respiratory intubation and mechanical ventilation | 138,700 |
| 4. Appendectomy | 81,400 |
| 5. Cancer chemotherapy | 35,200 |
| 6. Enteral and parenteral nutrition | 31,300 |
| 7. Cesarean section | 30,900 |
| 8. Repair of current obstetric laceration | 28,200 |
| 9. Incision and drainage of skin and subcutaneous tissue | 26,000 |
| 10. Blood transfusion | 22,100 |
| * Excludes diagnostic testing Source: AHRQ, Center for Delivery, Organization, and Markets, Healthcare Cost and Utilization Project, Kids’ Inpatient Database (KID), 2006 | |
|
|