STATISTICAL BRIEF #53
|
|
June 2008
C. Allison Russo, M.P.H., Roxanne M. Andrews, Ph.D., and Marguerite Barrett, M.S.
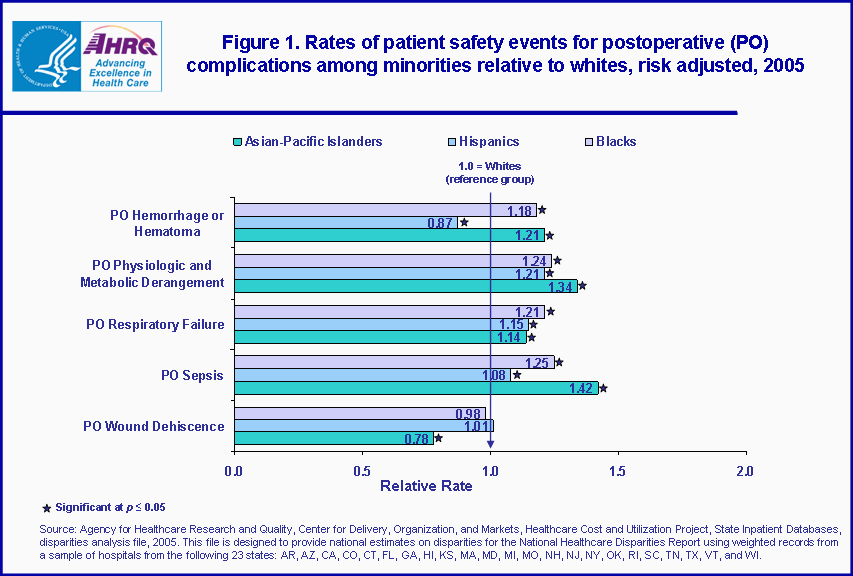
Introduction The quality of healthcare has been and continues to be a focal point of both past and current U.S. healthcare policy, particularly as it relates to the hospital setting, where nearly 30 percent of personal healthcare spending is directed.1 However, recent reports indicate that significant disparities in healthcare quality between whites and minorities exist and have not been reduced over the last several years.2 One critical insight into the quality of inpatient care is the number of complications or adverse events that patients experience as a result of exposure to hospital care. An important first step in developing interventions to reduce disparities and achieve high quality care for all patients is identifying which types of patient safety problems exist for different sub-groups of patients. This Statistical Brief presents data from the Healthcare Cost and Utilization Project (HCUP) on racial and ethnic disparities in rates of hospital patient safety events that are potentially preventable. It is based on a special analysis file created to develop national estimates for the National Healthcare Disparities Report. Selected Agency for Healthcare Research and Quality (AHRQ) Patient Safety Indicators (PSIs) are used to develop rates for postoperative complications, medical and other surgical complications, as well as obstetrical complications, among four racial and ethnic groups—whites (non-Hispanic), blacks (non-Hispanic), Hispanics, and Asian-Pacific Islanders (non-Hispanic).3 The results are presented as the patient safety event rate of the racial/ethnic minority group relative to the rate for whites. All differences between estimates noted in the text are statistically significant at the 0.05 level or better. In addition, we generally focus on those differences that are at least 10 percent different. Findings Overall, Asian-Pacific Islanders had the most number of patient safety indicator rates that were higher than the rates for whites (table 1). In fact, this minority population had worse rates than whites for nine of the 14 patient safety indicators: four involved measures of postoperative complications; two related to medical and other surgical complications; and three concerned obstetrical complications. Compared to whites, blacks had worse, i.e. higher, rates of hospital complications and adverse events for five of the 14 patient safety indicators. Specifically, four of these five patient safety indicators involved postoperative complications. Among Hispanics, only two of the 14 measures of patient safety were worse than the rates among whites, with both measures also related to postoperative complications. For seven of the 14 measures of patient safety, Hispanics performed better, i.e. had lower patient safety event rates, than whites—more than any other minority group. Racial and ethnic disparities in patient safety events for postoperative complications Figure 1 shows the relative rates for minority groups compared to whites of complications and problems that result from having an operation (i.e., postoperative complications). Except for postoperative wound dehiscence (when the surgical wound opens after an operation on the stomach or pelvis), minority groups generally had higher rates |
|
than whites for postoperative complications. In fact, all three minority groups had 21 to 34 percent higher complication rates than whites for postoperative physiologic and metabolic derangement (abnormal changes in body function after an operation) and 14 to 21 percent higher rates for postoperative respiratory failure (when a patient is unable to breath after surgery and temporarily needs a ventilator). Blacks and Asian-Pacific Islanders had 18 to 21 percent higher rates of postoperative hemorrhage or hematoma (when a patient bleeds too much or develops a large blood clot) and 25 to 42 percent higher rates of postoperative sepsis (a serious bloodstream infection) than whites. In contrast, Hispanics had a 13 percent lower rate than whites for postoperative hemorrhage or hematoma.
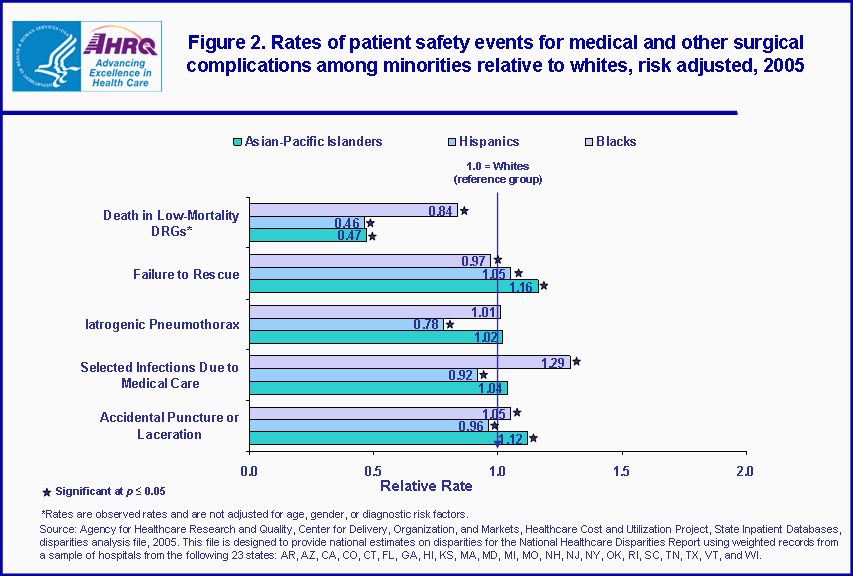
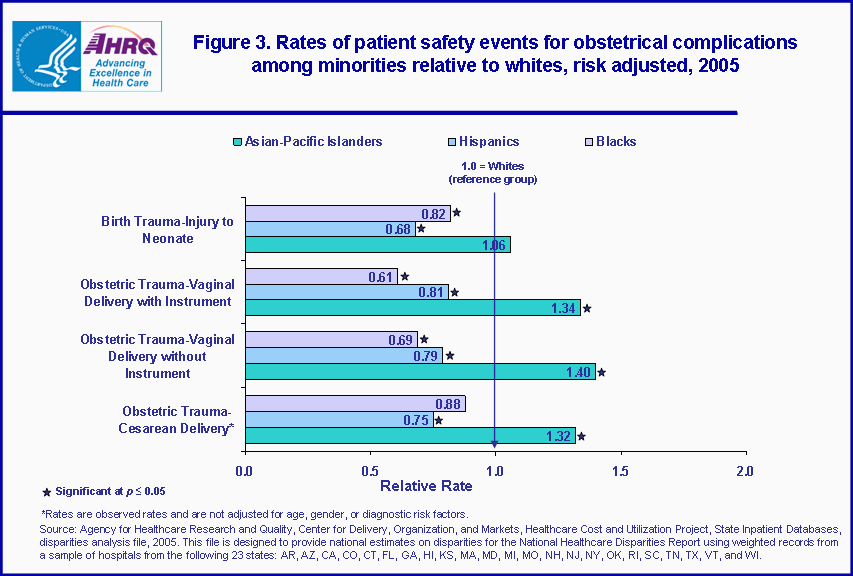
Racial and ethnic disparities in patient safety events for medical and other surgical complications Figure 2 indicates the relative rates for minority groups compared to whites of medical and other surgical complications and problems that occurred during a hospital stay. Except for death in low-mortality DRGs (medical and surgical conditions that rarely result in death), where all minority groups had better outcomes than whites, the rates for these complications among minority groups were generally comparable to the complication rates among whites. However, there were three indicators in which one minority group had substantially higher rates than whites. The largest disparity occurred for blacks, who had a rate of selected infections due to medical care that was 29 percent higher than the rate among whites. Asian-Pacific Islanders were 16 percent more likely than whites to have a failure to rescue (when a patient dies after developing a complication that should have been identified quickly and treated during hospitalization). Moreover, the rate of accidental puncture or laceration was 12 percent higher for Asian-Pacific Islanders compared to whites. It is also noteworthy that Hispanics had a 22 percent lower rate than whites for iatrogenic pneumothorax (when air leaks out of the lungs because it was accidentally punctured). Racial and ethnic disparities in patient safety events for obstetrical complications Figure 3 denotes the relative rates for minority groups compared to whites of complications that arise during childbirth. In general, both blacks and Hispanics had better, i.e., lower, obstetrical complication rates when compared to whites, while Asian-Pacific Islanders had worse outcomes for most obstetrical complications. Compared to whites, blacks and Hispanics had consistently lower rates of injury to the neonate during birth (e.g., broken collarbone, an infection, or a head injury) and obstetrical traumas (i.e. perineum tears) occurring during vaginal delivery with and without instruments (e.g., forceps or other medical instruments). Such tears, which can happen even when medical instruments are not used, are often preventable. Moreover, the rate of obstetrical trauma occurring during Cesarean delivery was also lower in Hispanics than the rate experienced by whites. Conversely, the rates of obstetrical traumas among Asian-Pacific Islanders were 30 to 40 percent higher than those for whites. However, Asians-Pacific Islanders and whites had similar rates of injury to the neonate. Data Source The estimates in this Statistical Brief are based upon data from the Healthcare Cost and Utilization Project (HCUP) 2005 State Inpatient Databases (SID) disparities analysis file. This file is designed to provide national estimates on disparities for the National Healthcare Disparities Report using weighted records from a sample of hospitals with good reporting of race and ethnicity from the following 23 states combined: AR, AZ, CA, CO, CT, FL, GA, HI, KS, MA, MD, MI, MO, NH, NJ, NY, OK, RI, SC, TN, TX, VT, and WI. The sample is designed to approximate a 40 percent stratified sample of U.S. community hospitals with information on all their discharges. Sampling stratifiers include hospital region, bed size, ownership, teaching status, and urban/rural location. The sample includes about 15 million discharges from almost 1,900 hospitals. The population bases for rates were obtained from Claritas, a vendor that compiles data from the U.S. Census Bureau. Claritas uses intercensal methods to estimate population subgroups. Definitions Patient Safety Indicators The AHRQ Patient Safety Indicators (PSI) (version 3.1) were used for this analysis to identify the admissions of interest and for risk-adjustment. The PSIs, a component of the AHRQ QIs, are a set of measures that can be used with hospital inpatient discharge and administrative data to provide a perspective on quality. PSIs screen for problems that patients experience as a result of exposure to the healthcare system and that are likely amenable to prevention by changes at the system or provider level. These are referred to as complications or adverse events. PSIs are defined on two levels: the provider-level and the area-level. Provider-level indicators provide a measure of the potentially preventable complication for patients who received their initial care and the complication of care within the same hospitalization. Provider-level indicators include only those cases where a secondary diagnosis code flags a potentially preventable complication. Individual provider-level PSIs were included in the Statistical Brief if the SID disparities analysis file could provide reliable estimates for all four racial/ethnic groups (i.e. there was a large enough sample size) and had strong evidence that it measures a hospital patient safety event. This Statistical Brief includes provider-level measures for hospital admission rates for the following 14 potentially preventable hospital complications and iatrogenic events: PSI 2: Death in low-mortality DRGs – How often patients died in the hospital when they had been admitted for a health problem that rarely results in death. (This is called death in low mortality DRGs, i.e. diagnosis-related groups.) PSI 4: Failure to rescue – How often patients died after developing a complication that should have been identified quickly and treated (called failure to rescue). PSI 6: Iatrogenic pneumothorax – How often air leaks out of the patient’s lung because someone accidentally punctured during a medical procedure or operation (a complication called iatrogenic pneumothorax). PSI 7: Selected infections due to medical care – How often patients got certain types of infections as a result of the care they received in the hospital. PSI 9: Postoperative hemorrhage or hematoma – How often patients bled too much (called hemorrhaging) or developed a large blood clot after an operation (which is called a hematoma). PSI 10: Postoperative physiologic and metabolic derangement – How often hospital patients experienced problems with blood sugar control (if they have diabetes) or kidney failure (if they did not have previous kidney trouble) after having an operation (these problems are called postoperative physiologic and metabolic derangements). PSI 11: Postoperative respiratory failure – How often patients became unable to breathe on their own following an operation, and needed a ventilator (a machine that helps someone breathe), at least temporarily. (This is called postoperative respiratory failure.) PSI 13: Postoperative sepsis – How often hospital patients got a serious bloodstream infection following an operation (which is called postoperative sepsis). PSI 14: Postoperative wound dehiscence – How often a surgical wound in the stomach or pelvic area split open after an operation. (This is called postoperative wound dehiscence in abdominopelvic surgical patients.) PSI 15: Accidental puncture or laceration – How often patients were accidentally cut, making an unnecessary or dangerous hole or tear in an organ of the body (called an accidental puncture and laceration), while receiving medical care in the hospital. PSI 17: Birth trauma-injury to neonate – How often a newborn infant experiences a problem during the birth process (labor or delivery) such as a broken collarbone, an infection, or a head injury. PSI 18: Obstetric trauma-vaginal delivery with instrument – How often a woman experiences a tear (trauma) to her perineum—the area between her vagina and rectum�while giving birth, when a healthcare provider is helping to deliver her baby using a forceps or other medical instrument. PSI 19: Obstetric trauma-vaginal delivery without instrument – How often a woman experiences a tear (trauma) to her perineum—the area between her vagina and rectum—while giving birth. PSI 20: Obstetric trauma-Cesarean delivery – How often a woman experiences a tear (trauma) in her perineum—the area between her vagina and rectum—or to any of the birth-related organs inside her body, during a Cesarean (surgical) delivery of a baby. Further information on the AHRQ QIs, including documentation and free software downloads, is available at http://www.qualityindicators.ahrq.gov/. Risk adjustment Except for the death in low mortality DRGs and birth trauma-Cesarean delivery indicators, which describe the observed rate, the PSI rates used in this Statistical Brief were adjusted for select risk factors. The PSI risk adjustment variables were age, sex, age-sex interaction, DRG cluster, and comorbidity. Regression-based standardization (designed by the developers of the PSI software) was used for risk adjustment. The rate calculations also take into account the clustering of patients within hospitals and the hospital stratification aspects of the sampling design for the SID disparities analysis file. The patient safety event rates were weighted for national estimates. Pairwise t-tests were used to test for statistical significance of differences in patient safety (additional detail on the file development, risk adjustment methodology, and statistical approach is available in Coffey et al., 2007). Reporting of race and ethnicity Race and ethnicity measures can be problematic in hospital discharge databases. Some states do not collect information on race/ethnicity from hospitals, and within states that collect the information, some hospitals do not code race and ethnicity reliably. The 2005 SID disparities analysis file was limited to 23 states, and to hospitals within those states with good reporting of race and ethnicity. Data on Hispanics are collected differently among the states and also can differ from the Census methodology of collecting information separately on race (white, African American, Asian, American Native) and ethnicity (Hispanic, non-Hispanic). State data organizations often collect Hispanic ethnicity as one of several categories that include race. Therefore, for multistate analyses, HCUP creates the combined categorization of race and ethnicity for data from states that report ethnicity separately. When a state data organization collects Hispanic ethnicity separately from race, HCUP uses Hispanic ethnicity to override any other race category to create an Hispanic category for the uniformly coded race/ethnicity data element, while also retaining the original race and ethnicity data. This Statistical Brief reports the HCUP uniform coding of race/ethnicity for the following categories: white, non-Hispanic; black, non-Hispanic; Asian-Pacific Islanders, non-Hispanic, and Hispanic. Relative rates Adjusted relative rates are calculated by dividing the minority group adjusted patient safety event rate by the non-Hispanic white adjusted rate. Minority groups that have higher rates than non-Hispanic whites have a relative rate greater than 1.0, while those with patient safety event rates lower than non-Hispanic whites have a relative rate less than 1.0. A relative rate equal to 1.0 describes rates among minority groups and non-Hispanic whites that are similar. A relative rate significantly less than 1.0 or greater than 1.0 may signal disparities in the quality and safety of hospital care. Types of hospitals included in HCUP HCUP is based on data from community hospitals, defined as short-term, non-Federal, general and other hospitals, excluding hospital units of other institutions (e.g., prisons). HCUP data include OB-GYN, ENT, orthopedic, cancer, pediatric, public, and academic medical hospitals. They exclude long-term care, rehabilitation, psychiatric, and alcoholism and chemical dependency hospitals, but these types of discharges are included if they are from community hospitals. Unit of analysis The unit of analysis is the hospital discharge (i.e., the hospital stay), not a person or patient. This means that a person who is admitted to the hospital multiple times in one year will be counted each time as a separate "discharge" from the hospital. About HCUP HCUP is a family of powerful healthcare databases, software tools, and products for advancing research. Sponsored by the Agency for Healthcare Research and Quality (AHRQ), HCUP includes the largest all-payer encounter-level collection of longitudinal healthcare data (inpatient, ambulatory surgery, and emergency department) in the United States, beginning in 1988. HCUP is a Federal-State-Industry Partnership that brings together the data collection efforts of many organizations—such as State data organizations, hospital associations, private data organizations, and the Federal government—to create a national information resource. HCUP would not be possible without the contributions of the following data collection Partners from across the United States: Arizona Department of Health Services Arkansas Department of Health California Office of Statewide Health Planning & Development Colorado Hospital Association Connecticut Integrated Health Information (Chime, Inc.) Florida Agency for Health Care Administration Georgia Hospital Association Hawaii Health Information Corporation Illinois Department of Public Health Indiana Health Association Iowa Hospital Association Kansas Hospital Association Kentucky Cabinet for Health and Family Services Maine Health Data Organization Maryland Health Services Cost Review Commission Massachusetts Division of Health Care Finance and Policy Michigan Health & Hospital Association Minnesota Hospital Association Missouri Hospital Industry Data Institute Nebraska Hospital Association Nevada Division of Health Care Financing and Policy, Department of Human Resources New Hampshire Department of Health & Human Services New Jersey Department of Health and Senior Services New York State Department of Health North Carolina Department of Health and Human Services Ohio Hospital Association Oklahoma Health Care Information Center for Health Statistics Oregon Health Policy and Research Rhode Island Department of Health South Carolina State Budget & Control Board South Dakota Association of Healthcare Organizations Tennessee Hospital Association Texas Department of State Health Services Utah Department of Health Vermont Association of Hospitals and Health Systems Virginia Health Information Washington State Department of Health West Virginia Health Care Authority Wisconsin Department of Health & Family Services About the SID The HCUP State Inpatient Databases (SID) are hospital inpatient databases from data organizations participating in HCUP. The SID contain the universe of the inpatient discharge abstracts in the participating HCUP states, translated into a uniform format to facilitate multistate comparisons and analyses. Together, the SID encompass almost 90 percent of all U.S. community hospital discharges in 2005. The SID can be used to investigate questions unique to one state; to compare data from two or more states; to conduct market area variation analyses; and to identify state-specific trends in inpatient care utilization, access, charges, and outcomes. For More Information For more information about HCUP, visit www.hcup-us.ahrq.gov. For additional HCUP statistics, visit HCUPnet, our interactive query system, at www.hcup.ahrq.gov. For information on other hospitalizations in the U.S., download HCUP Facts and Figures: Statistics on Hospital-based Care in the United States in 2005, located at http://www.hcup-us.ahrq.gov/reports.jsp. For a detailed description of HCUP, the AHRQ Quality Indicators, and how estimates were developed for this Statistical Brief, please refer to the following publications: AHRQ Quality Indicators—Guide to Patient Safety Indicators, Version 3.1. Online. March 12, 2007. U.S. Agency for Healthcare Research and Quality http://qualityindicators.ahrq.gov/Modules/psi_resources.aspx. Coffey, R., Barrett, M., Houchens, R., Moy, E., Andrews, R. Methods Applying AHRQ Quality Indicators to Healthcare Cost and Utilization Project (HCUP) Data for the Fifth National Healthcare Disparities Report. 2007. HCUP Methods Series Report #2007-07. Online. January 4, 2008. U.S. Agency for Healthcare Research and Quality. http://www.hcup-us.ahrq.gov/reports/methods/2007_07.pdf. Steiner, C., Elixhauser, A., Schnaier, J. The Healthcare Cost and Utilization Project: An Overview. Effective Clinical Practice 5(3):143-51, 2002. Suggested Citation Russo, C. A. (Thomson Reuters), Andrews, R.M. (AHRQ), and Barrett, M.L. (M.L. Barrett). Racial and Ethnic Disparities in Hospital Patient Safety Events, 2005. HCUP Statistical Brief #53. June 2008. Agency for Healthcare Research and Quality, Rockville, MD. http://www.hcup-us.ahrq.gov/reports/statbriefs/sb53.pdf. *** AHRQ welcomes questions and comments from readers of this publication who are interested in obtaining more information about access, cost, use, financing, and quality of healthcare in the United States. We also invite you to tell us how you are using this Statistical Brief and other HCUP data and tools, and to share suggestions on how HCUP products might be enhanced to further meet your needs. Please e-mail us at hcup@ahrq.gov or send a letter to the address below:Irene Fraser, Ph.D., Director Center for Delivery, Organization, and Markets Agency for Healthcare Research and Quality 540 Gaither Road Rockville, MD 20850 1Centers for Medicare and Medicaid Services. National Healthcare Expenditure Projections: Table 2 National Health Expenditure Amounts and Annual Percent Change by Type of Expenditure: Selected Calendar Years 1998–2014. http://www.cms.hhs.gov/NationalHealthExpendData/. 2National Healthcare Disparities Report, 2007. U.S. Agency for Healthcare Research and Quality. http://archive.ahrq.gov/qual/nhdr07/nhdr07.pdf. 3Unless otherwise noted, rates are adjusted by age, sex, age-sex interactions, or diagnostic risk factors. |
| Table 1. Number of patient safety measures with differences between racial-ethnic minority groups and whites* | ||||||
| Type of Patient Safety Event | Blacks | Hispanics | Asian-Pacific Islanders | |||
|---|---|---|---|---|---|---|
| Higher than Whites | Lower than Whites | Higher than Whites | Lower than Whites | Higher than Whites | Lower than Whites | |
| Postoperative Complications (Five measures) | 4 | 0 | 2 | 1 | 4 | 1 |
| Medical and Other Surgical Complications (Five measures) | 1 | 1 | 0 | 2 | 2 | 1 |
| Obstetrical Complications (Four measures) | 0 | 3 | 0 | 4 | 3 | 0 |
| All (14 measures) | 5 | 4 | 2 | 7 | 9 | 2 |
| *Differences of at least 10 percent and significant at p‹0.05. Source: Agency for Healthcare Research and Quality, Center for Delivery, Organization, and Markets, Healthcare Cost and Utilization Project, State Inpatient Databases disparities analysis file, 2005. This file is designed to provide national estimates on disparities for the National Healthcare Disparities Report using weighted records from a sample of hospitals from the following 23 states: AR, AZ, CA, CO, CT, FL, GA, HI, KS, MA, MD, MI, MO, NH, NJ, NY, OK, RI, SC, TN, TX, VT, and WI. | ||||||
|
|