Hospital stays for children and adolescents that began in the ED were less expensive and shorter than either routine, non-emergency pediatric stays or adult stays that began in the ED (table 1). Compared with other pediatric stays, hospitalizations for children and adolescents that started in the ED were, on average, $3,300 less expensive ($5,400 per stay compared with $8,700 per stay) and about two days shorter (3.4 days versus 5.3 days). Both types of stays resulted in in-hospital death infrequently (under 1 percent of cases).
Relative to adult stays that began in the ED, comparable pediatric hospitalizations were, on average, $3,200 less costly ($5,400 per stay versus $8,600 per stay), about two days shorter (3.4 days versus 5.2 days), and resulted in death about a tenth as often (0.4 percent versus 3.5 percent) (table 2). The less costly and shorter nature of pediatric stays originating in the ED may be attributable to the types of acute or preventable conditions with which children present at the ED—conditions that might be avoided with adequate primary and/or ambulatory care.
2
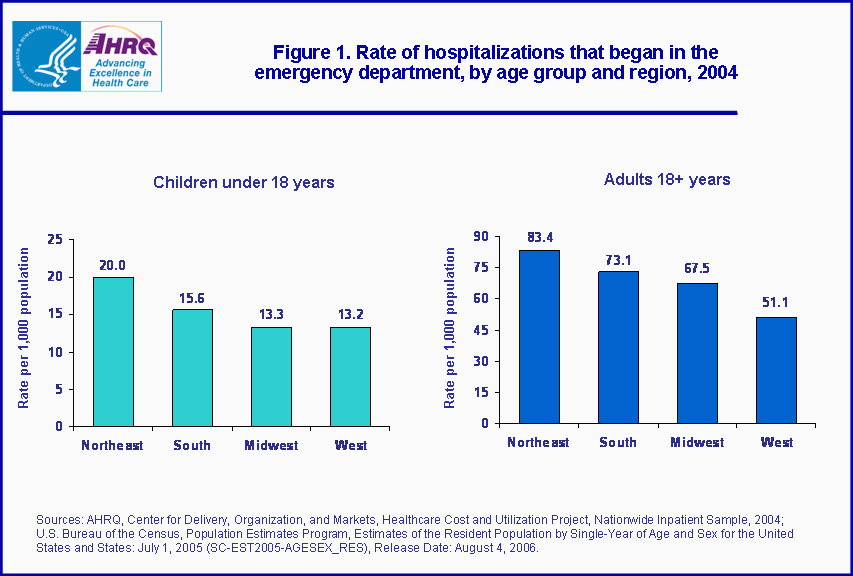
Differences in hospital admissions through the emergency department, by region
Relative to the populations in each region, children and adolescents in the Northeast were more likely to enter the hospital through the ED (figure 1). The rate of pediatric admissions from the ED was over 50 percent greater in the Northeast (20.0 stays per 1,000 persons under 18) compared with the West and Midwest (about 13 stays per 1,000 persons under 18), and 28.3 percent greater than that of the South (15.6 stays per 1,000 persons under 18). Similarly, the rates for adults were highest in the Northeast and lowest in the West, though adult admission rates through the ED were considerably higher than for children in every region.
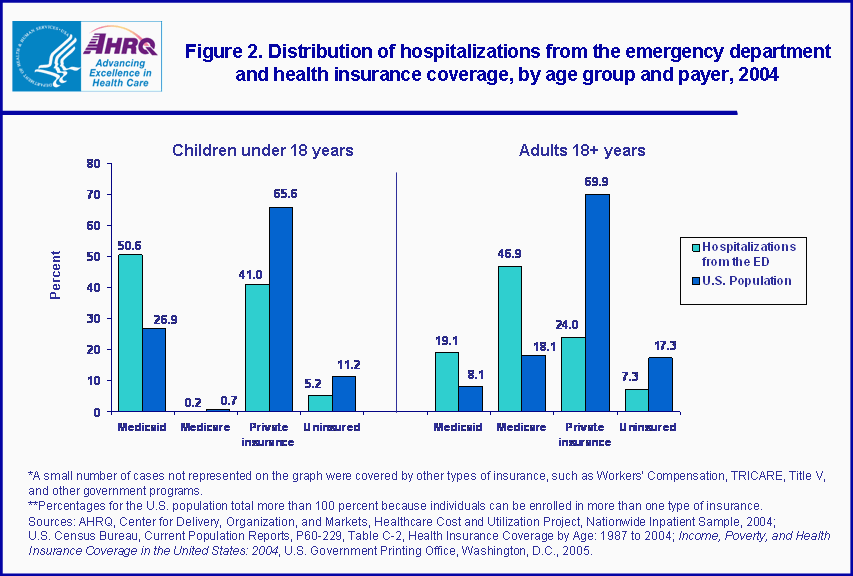
Differences in hospital admissions through the emergency department, by payer
Medicaid (the government insurance program for low-income individuals) and private insurance were billed for over 90 percent of pediatric hospital stays that began in the ED (figure 2). The government bore a heavy burden of hospital admissions through the ED with about half (50.6 percent) of such admissions billed to Medicaid, even though only 26.9 percent of children and adolescents were covered by Medicaid in 2004. Uninsured hospital stays and those covered by private insurance showed the opposite pattern: while 65.6 percent of patients under 18 years of age had some private insurance coverage, private insurance was billed for only 41.0 percent of hospital admissions through the ED. Similarly, 11.2 percent of U.S. children and adolescents were uninsured in 2004, but only 5.2 percent of admissions through the ED were uninsured. These same insurance patterns existed for adult hospital stays that began in the ED.
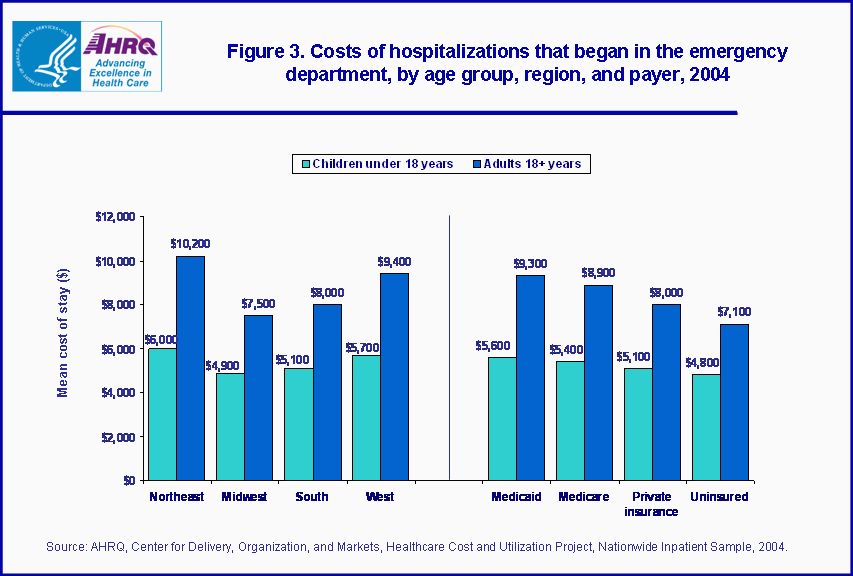
Costs of hospitalizations from the emergency department, by region and payer
The mean costs for hospitalizations from the ED were greatest in the Northeast and West and for stays billed to Medicaid (figure 3). The average cost for these stays in the Northeast and West were $6,000 and $5,700, respectively, while the mean cost in the Midwest and South was about $5,000. The average cost of Medicaid stays was about $500 more per hospitalization than that billed to private insurance ($5,600 for Medicaid versus $5,100 for private insurance). The mean cost for uninsured stays ($4,800) was less than the cost of stays billed to Medicaid but comparable to stays billed to private insurance. Similarly, for the adult population, the average cost of hospitalizations that originated in the ED were greatest in the Northeast and West and for those stays covered by government payers.
Data Source
The estimates in this Statistical Brief are based on data from the HCUP 2004 Nationwide Inpatient Sample (NIS). Supplemental sources included data on regional population estimates from the Estimates of the Resident Population by Single-Year of Age and Sex for the United States and States: July 1, 2005 (SC-EST2005-AGESEX_RES), Population Estimates Program, U.S. Bureau of the Census, Release date: August 4, 2006 (
http://www.census.gov/popest/) and health insurance coverage data from the U.S. Census Bureau, Current Population Reports, P60-229, Table C-2, Health Insurance Coverage by Age: 1987 to 2004; Income, Poverty, and Health Insurance Coverage in the United States: 2004, U.S. Government Printing Office, Washington, D.C. 2005 (
http://www.census.gov/prod/2005pubs/p60-229.pdf).
Definitions
Types of hospitals included in HCUP
HCUP is based on data from community hospitals, defined as short-term, non-Federal, general and other hospitals, excluding hospital units of other institutions (e.g., prisons). HCUP data include OB-GYN, ENT, orthopedic, cancer, pediatric, public, and academic medical hospitals. They exclude long-term care, rehabilitation, psychiatric, and alcoholism and chemical dependency hospitals, but these types of discharges are included if they are from community hospitals.
Unit of analysis
The unit of analysis is the hospital discharge (i.e., the hospital stay), not a person or patient. This means that a person who is admitted to the hospital multiple times in one year will be counted each time as a separate "discharge" from the hospital.
Pediatric, neonatal, and maternal cases
Definitions of pediatric, birth, and maternal cases are as follows:
– Pediatric cases: hospital stays for individuals under 18 years of age
– Birth cases: hospital stays during which a child is born (identified via diagnosis codes of V3000 to V3901 with the last 2 digits being "00" or "01" in any diagnosis field)
– Maternal cases: hospital stays for females who are pregnant or gave birth (identified via NEOMAT code of "1" or "3")
Region
Region is one of the four regions defined by the U.S. Census Bureau:
– Northeast: Maine, New Hampshire, Vermont, Massachusetts, Rhode Island, Connecticut, New York, New Jersey, and Pennsylvania
– Midwest: Ohio, Indiana, Illinois, Michigan, Wisconsin, Minnesota, Iowa, Missouri, North Dakota, South Dakota, Nebraska, and Kansas
– South: Delaware, Maryland, District of Columbia, Virginia, West Virginia, North Carolina, South Carolina, Georgia, Florida, Kentucky, Tennessee, Alabama, Mississippi, Arkansas, Louisiana, Oklahoma, and Texas
– West: Montana, Idaho, Wyoming, Colorado, New Mexico, Arizona, Utah, Nevada, Washington, Oregon, California, Alaska, and Hawaii
Payer
Up to two payers can be coded for a hospital stay in HCUP data. When this occurs, the following hierarchy is used:
– If either payer is listed as Medicaid, the payer is "Medicaid."
– For non-Medicaid stays, if either payer is listed as Medicare, the payer is "Medicare."
– For stays that are neither Medicaid nor Medicare, if either payer is listed as private insurance, the payer is "private insurance."
– For stays that are not Medicaid, Medicare or private insurance, if either payer is some other third-party payer, the payer is "other," which consists of Worker’s Compensation, TRICARE/CHAMPUS, CHAMPVA, Title V, and other government programs.
– For stays that have no third-party payer and the payer is listed as "self-pay" or "no charge," the payer is "uninsured."
Costs and charges
Total hospital charges were converted to costs using HCUP cost-to-charge ratios based on hospital accounting reports from the Centers for Medicare and Medicaid Services (CMS).
3 Costs will tend to reflect the actual costs of production, while charges represent what the hospital billed for the case. For each
hospital, a hospital-wide cost-to-charge ratio is used because detailed charges are not available across all HCUP States. Hospital charges reflect the amount the hospital charged for the entire hospital stay and does not include professional (physician) fees. For the purposes of this Statistical Brief, costs are reported to the nearest hundreds.
Emergency admission
Admission source indicates where the patient was located prior to admission to the hospital. Emergency admission indicates the patient was admitted to the hospital through the emergency department.
About the NIS
The HCUP Nationwide Inpatient Sample (NIS) is a nationwide database of hospital inpatient stays. The NIS is nationally representative of all community hospitals (i.e., short-term, non-Federal, non-rehabilitation hospitals). The NIS is a sample of hospitals and includes all patients from each hospital, regardless of payer. It is drawn from a sampling frame that contains hospitals comprising 90 percent of all discharges in the United States. The vast size of the NIS allows the study of topics at both the national and regional levels for specific subgroups of patients. In addition, NIS data are standardized across years to facilitate ease of use.
About HCUP
HCUP is a family of powerful health care databases, software tools, and products for advancing research. Sponsored by the Agency for Healthcare Research and Quality (AHRQ), HCUP includes the largest all-
payer encounter-level collection of longitudinal health care data (inpatient, ambulatory surgery, and
emergency department) in the United States, beginning in 1988. HCUP is a Federal-State-Industry Partnership that brings together the data collection efforts of many organizations—such as State data organizations, hospital associations, private data organizations, and the Federal government—to create a national information resource.
For more information about HCUP, visit
http://www.hcup-us.ahrq.gov.
HCUP would not be possible without the contributions of the following data collection Partners from across the United States:
Arizona Department of Health Services
Arkansas Department of Health & Human Services
California Office of Statewide Health Planning & Development
Colorado Health & Hospital Association
Connecticut Integrated Health Information (Chime, Inc.)
Florida Agency for Health Care Administration
Georgia GHA: An Association of Hospitals & Health Systems
Hawaii Health Information Corporation
Illinois Health Care Cost Containment Council and Department of Public Health
Indiana Hospital&Health Association
Iowa Hospital Association
Kansas Hospital Association
Kentucky Cabinet for Health and Family Services
Maryland Health Services Cost Review Commission
Massachusetts Division of Health Care Finance and Policy
Michigan Health & Hospital Association
Minnesota Hospital Association
Missouri Hospital Industry Data Institute
Nebraska Hospital Association
Nevada Division of Health Care Financing and Policy, Department of Human Resources
New Hampshire Department of Health & Human Services
New Jersey Department of Health and Senior Services
New York State Department of Health
North Carolina Department of Health and Human Services
Ohio Hospital Association
Oregon Office for Oregon Health Policy and Research and Oregon Association of Hospitals and Health Systems
Rhode Island Department of Health
South Carolina State Budget & Control Board
South Dakota Association of Healthcare Organizations
Tennessee Hospital Association
Texas Department of State Health Services
Utah Department of Health
Vermont Association of Hospitals and Health Systems
Virginia Health Information
Washington State Department of Health
West Virginia Health Care Authority
Wisconsin Department of Health and Family Services
For additional HCUP statistics, visit HCUPnet, our interactive query system at
https://datatools.ahrq.gov/hcupnet.
For More Information
For a detailed description of HCUP and more information on the design of the NIS and methods to calculate estimates, please refer to the following publications:
Steiner, C., Elixhauser, A., Schnaier, J. The Healthcare Cost and Utilization Project: An Overview.
Effective Clinical Practice 5(3):143–51, 2002.
Design of the HCUP Nationwide Inpatient Sample, 2004. Online. August 8, 2006. U.S. Agency for Healthcare Research and Quality.
http://www.hcup-us.ahrq.gov/db/nation/nis/reports/NIS_2004_Design_Report.pdf
Houchens, R., Elixhauser, A.
Final Report on Calculating Nationwide Inpatient Sample (NIS) Variances, 2001. HCUP Methods Series Report #2003-2. Online. June 2005 (revised June 6, 2005). U.S. Agency for Healthcare Research and Quality.
http://www.hcup-us.ahrq.gov/reports/methods/2003_02.pdf
Suggested Citation
Merrill, C. T. (Thomson Healthcare) and Owens, P. L. (AHRQ).
Hospital Admissions That Began in the Emergency Department for Children and Adolescents, 2004. HCUP Statistical Brief #32. June 2007. Agency for Healthcare Research and Quality, Rockville, MD.
http://www.hcup-us.ahrq.gov/reports/statbriefs/sb32.pdf
***
AHRQ welcomes questions and comments from readers of this publication who are interested in obtaining more information about access, cost, use, financing, and quality of health care in the United States. We also invite you to tell us how you are using this Statistical Brief and other HCUP data and tools, and to share suggestions on how HCUP products might be enhanced to further meet your needs. Please e-mail us at
hcup@ahrq.gov or send a letter to the address below:
Irene Fraser, Ph.D., Director
Center for Delivery, Organization, and Markets
Agency for Healthcare Research and Quality
540 Gaither Road
Rockville, MD 20850
1Births include hospital stays for a newborn child. Adolescent pregnancy stays include hospitalizations during which the patient was pregnant or gave birth.
2Merrill, C. T. (Thomson Healthcare) and Owens, P. L. (AHRQ).
Reasons for Being Admitted to the Hospital through the Emergency Department for Children and Adolescents, 2004. HCUP Statistical Brief #33. June 2007. Agency for Healthcare Research and Quality, Rockville, MD.
http://www.hcup-us.ahrq.gov/reports/statbriefs/sb33.pdf.
3HCUP Cost-to-Charge Ratio Files (CCR). Healthcare Cost and Utilization Project (HCUP). 2001�2003. U.S. Agency for Healthcare Research and Quality, Rockville, MD.
http://www.hcup-us.ahrq.gov/db/state/costtocharge.jsp.