|
STATISTICAL BRIEF #303
December 2022
Pamela L. Owens, Ph.D., Lan Liang, Ph.D., Marguerite L. Barrett, M.S., and Kathryn R. Fingar, Ph.D., M.P.H. Introduction Most inpatient stays are complicated by one or more comorbidities that affect patient care because they require clinical evaluation or therapeutic treatment, extend the length of stay, or increase nursing care and/or monitoring. Comorbidities are secondary diagnoses and distinct from the reason for the hospitalization (i.e., the principal diagnosis).1,2 Understanding patterns in comorbidities associated with inpatient stays is important for several reasons. Comorbidities are key predictors of length of stay, cost, readmission, and mortality.1,2 Identification of comorbidities helps hospitals allocate the necessary resources and staffing to address patient needs and improve their quality of care. This Healthcare Cost and Utilization Project (HCUP) Statistical Brief presents statistics on 38 comorbidities, defined by the Elixhauser Comorbidity Software Refined for the International Classification of Diseases, Tenth Revision, Clinical Modification (ICD-10-CM), v2023.1.3 Using weighted estimates of adult inpatient stays based on the 2019 National Inpatient Sample (NIS), the percentage of stays with any and specific types of comorbidities is shown. The percentage of stays with comorbidities is examined by patient characteristics and the reason for the hospital stay, and outcomes of inpatient stays with and without comorbidities are presented. Because of the large sample size of the NIS data, small differences can be statistically significant but not clinically important. Thus, only differences greater than or equal to 10 percent are discussed in the text. |
|
Findings
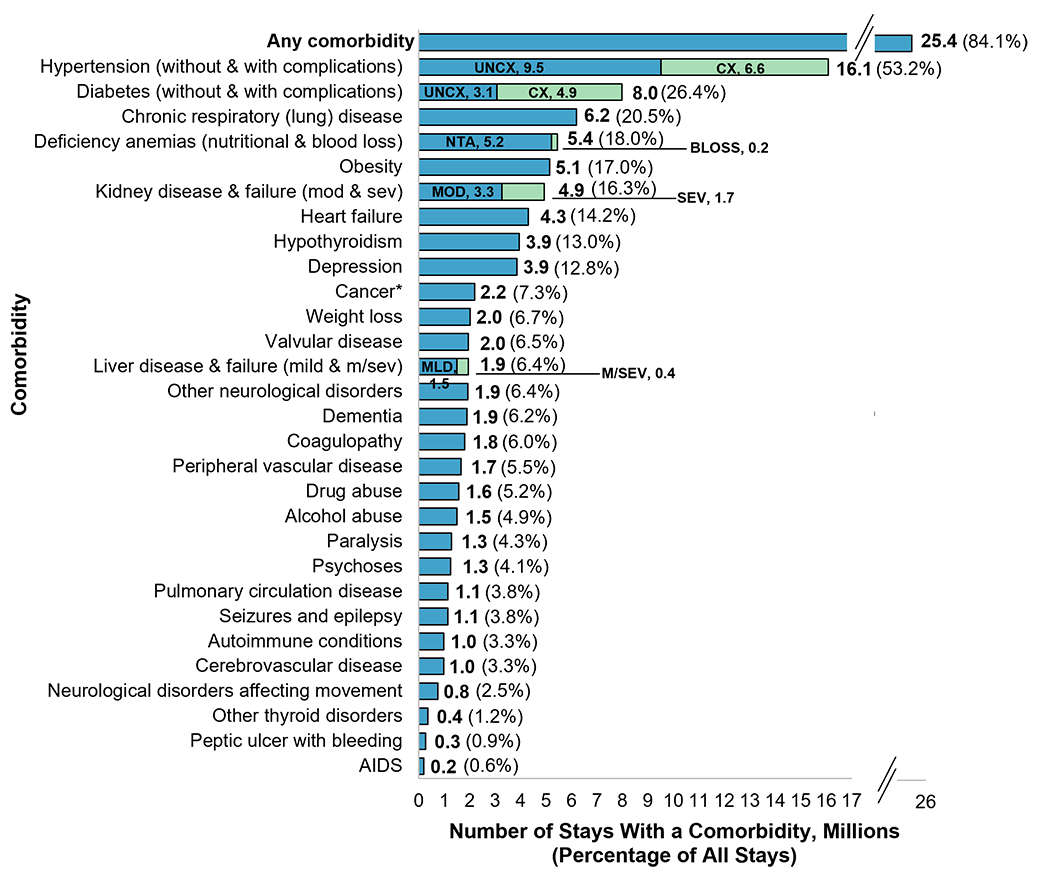
Types of comorbidities among hospital inpatient stays, 2019 Figure 1 displays the percentage of adult inpatient stays with a comorbidity in 2019. Comorbidities are secondary diagnoses and distinct from the reason for the inpatient stay (i.e., the principal diagnosis). Percentages shown in the figure total over 100 percent, as inpatient stays may include more than one comorbidity. Figure 1. Number and percentage of adult inpatient stays with a comorbidity, 2019
Bar chart showing the number and percentage of adult inpatient stays with a comorbidity in 2019. Data are provided in Supplemental Table 1.
|
|
Hospital stays with and without comorbidities, by patient characteristics, 2019
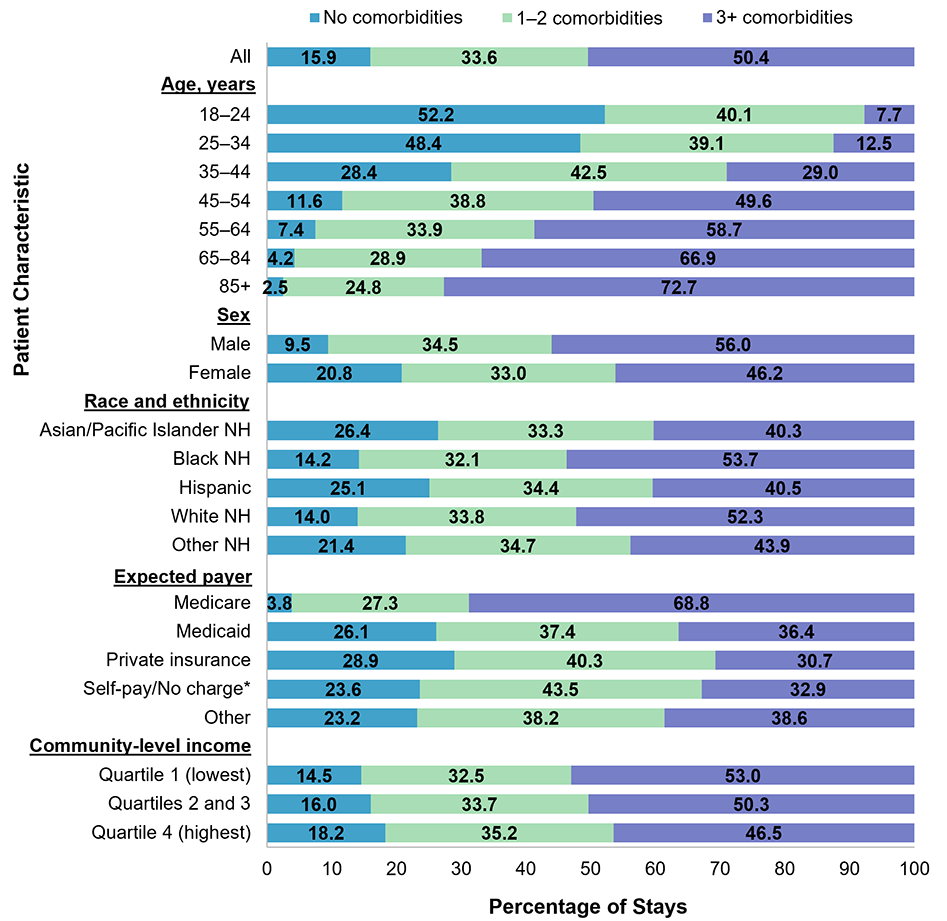
Figure 2 displays the percentage of adult inpatient stays with no, one to two, or three or more comorbidities, overall and by patient characteristics in 2019. Figure 2. Presence and number of comorbidities among adult inpatient stays, by patient characteristics, 2019
Bar chart showing the percentage of adult inpatient stays with no, one to two, or three or more comorbidities, overall and by patient characteristics in 2019. Data are provided in Supplemental Table 2.
|
|
Reasons for hospital stays with and without comorbidities, 2019
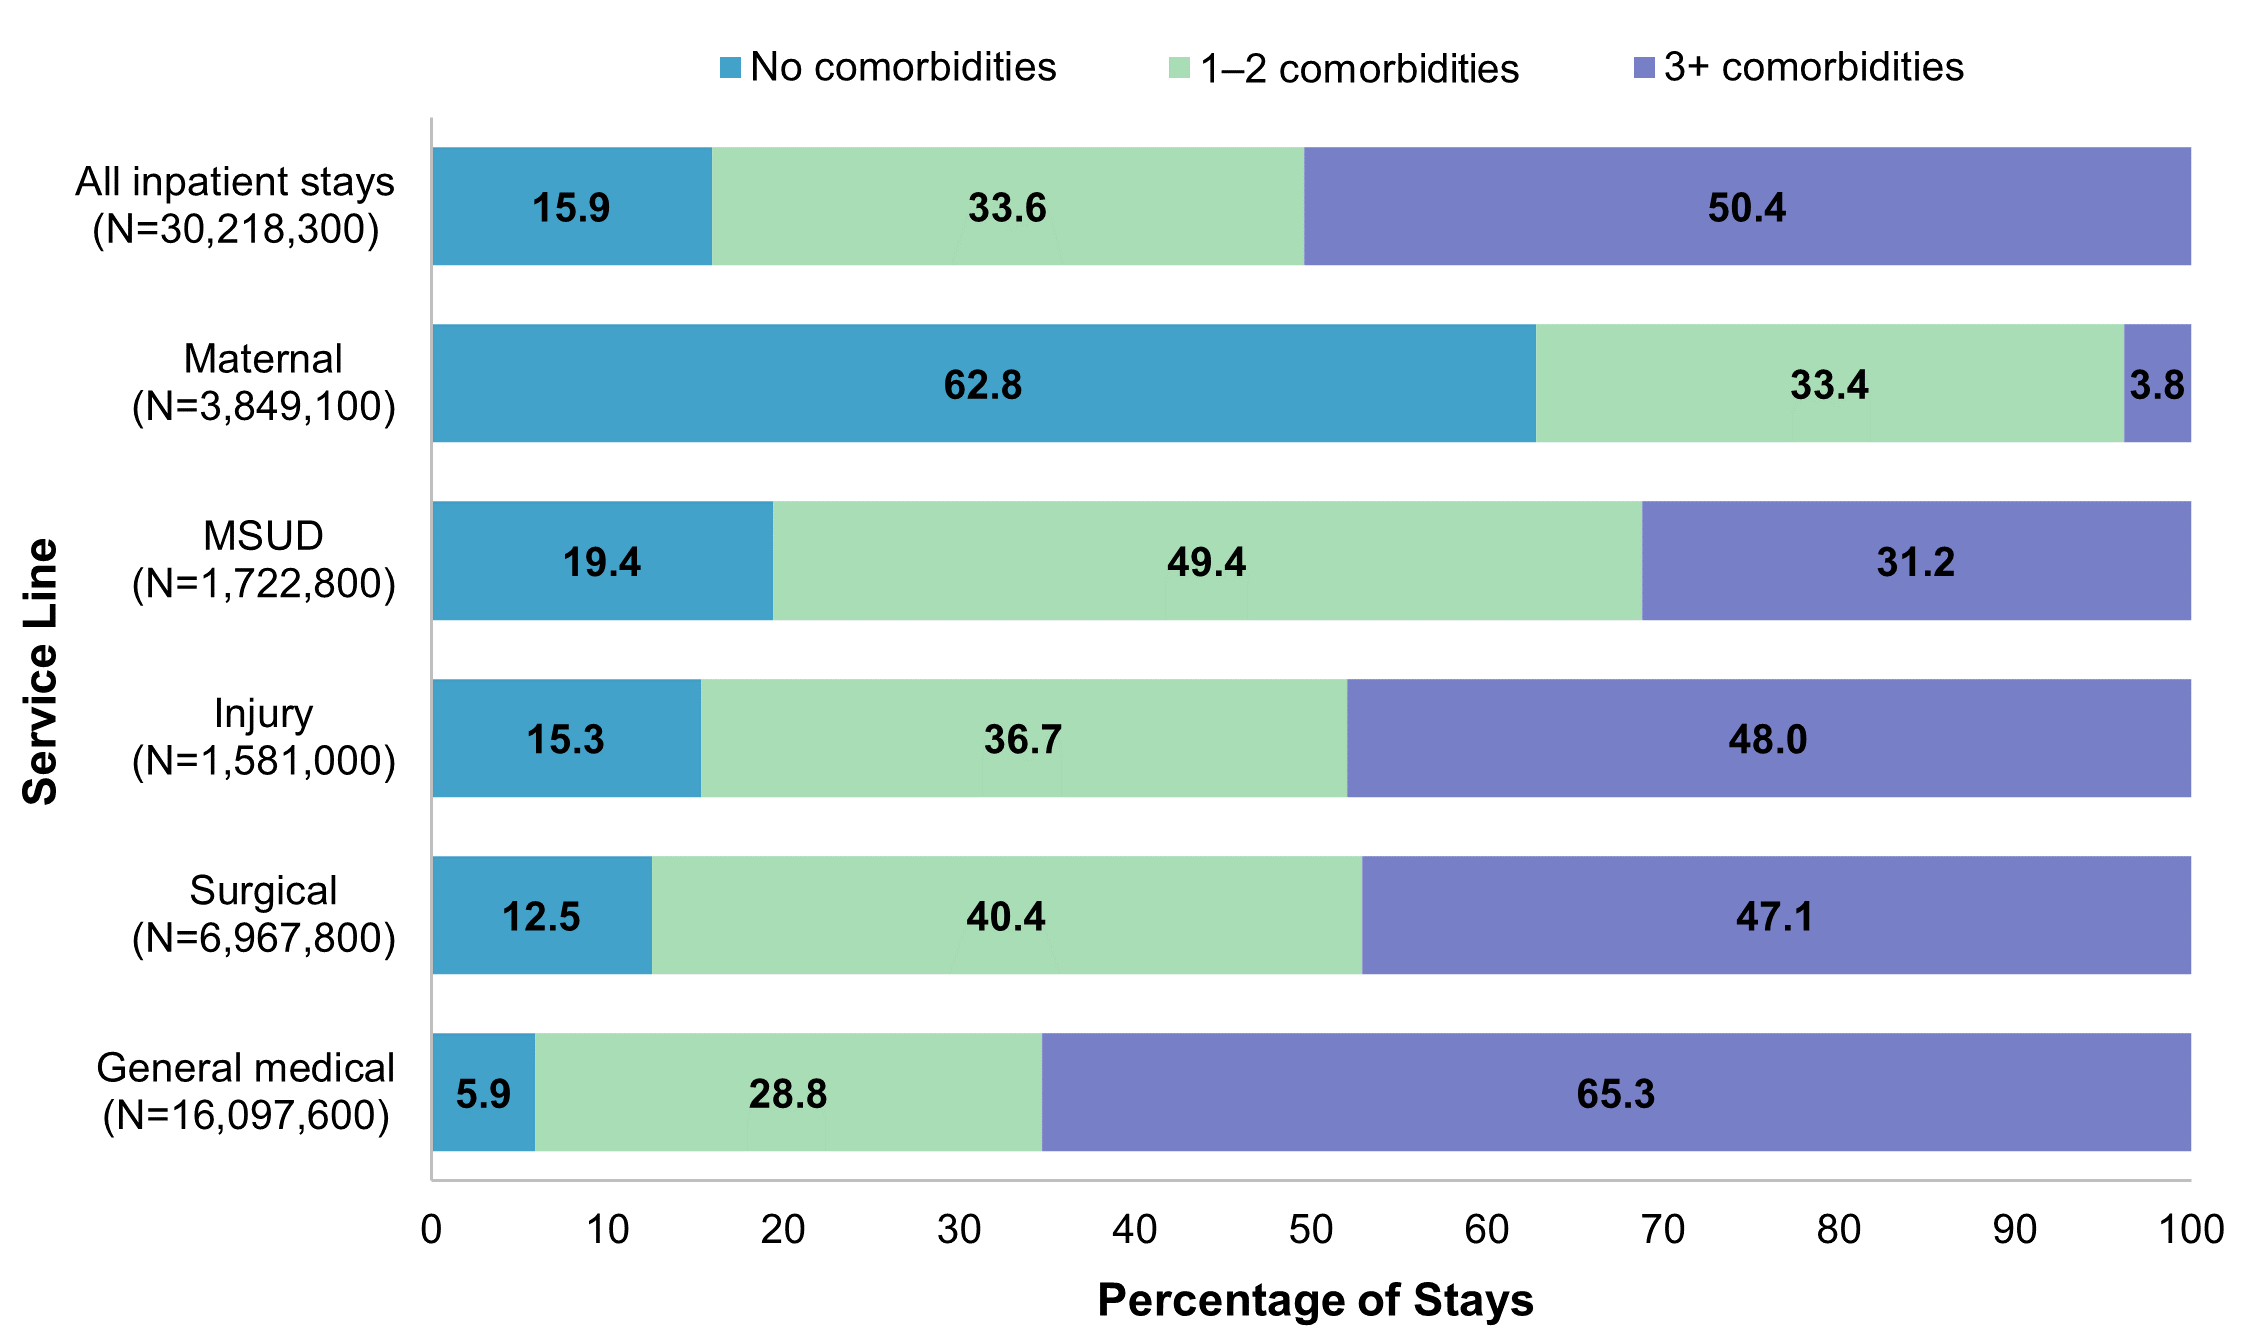
Figure 3 displays the percentage of adult inpatient stays with no, one to two, or three or more comorbidities by hospital service line (i.e., general reason for the stay) in 2019. Comorbidities are secondary diagnoses and distinct from the reason for the inpatient stay (i.e., the principal diagnosis). Figure 3. Presence and number of comorbidities among adult inpatient stays, by hospital service line, 2019
Bar chart showing the percentage of adult stays with no, one to two, or three or more comorbidities by hospital service line (i.e., general reason for the stay), in 2019. Data are provided in Supplemental Table 3.
|
|
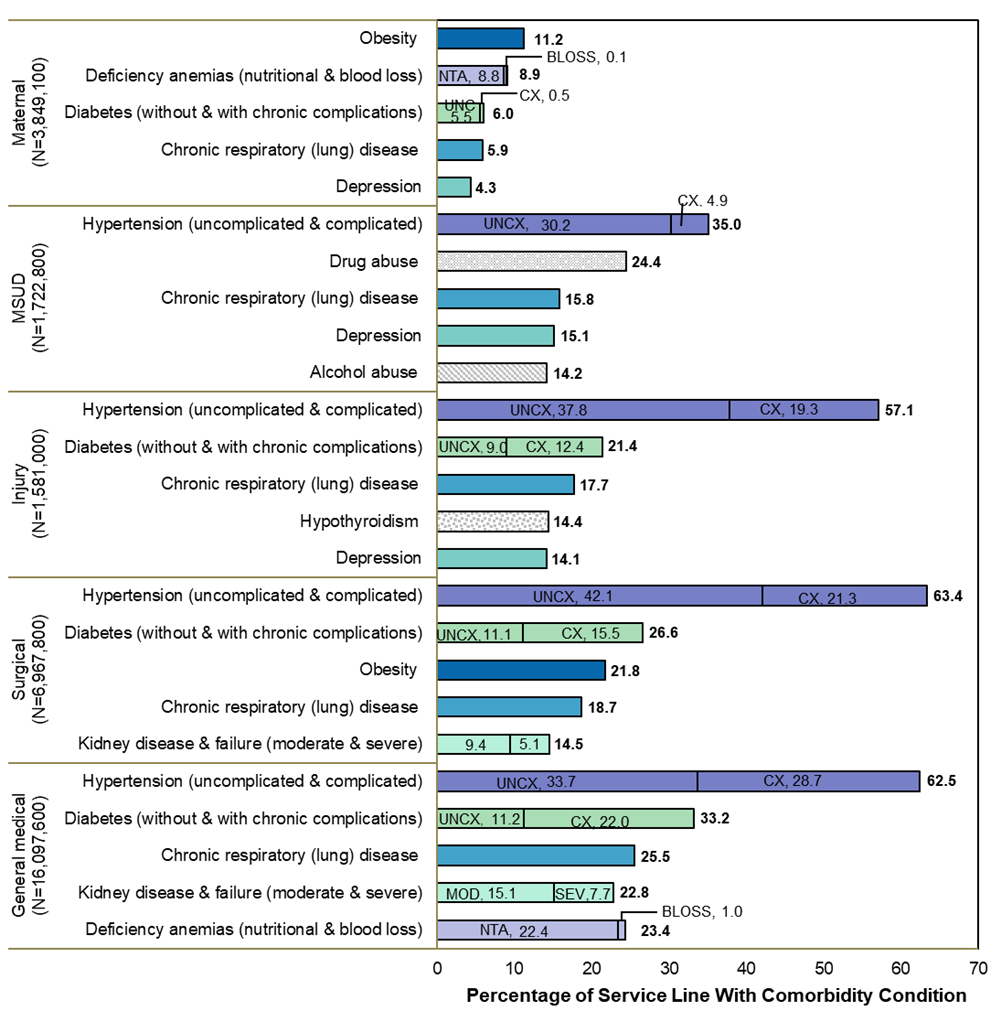
Figure 4 displays the five leading types of comorbid conditions within each hospital service line in 2019.
The Appendix lists the number and percentage of inpatient stays by all comorbidities and service lines. Comorbidities are secondary diagnoses and distinct from the reason for the inpatient stay (i.e., the principal diagnosis). Figure 4. Top five comorbid conditions by type of comorbidity and service line, 2019
Bar chart showing the five leading types of comorbid conditions within each hospital service line in 2019. Data are provided in Supplemental Table 4.
|
|
Outcomes of adult inpatient stays with and without comorbidities, by reason for the stay, 2019
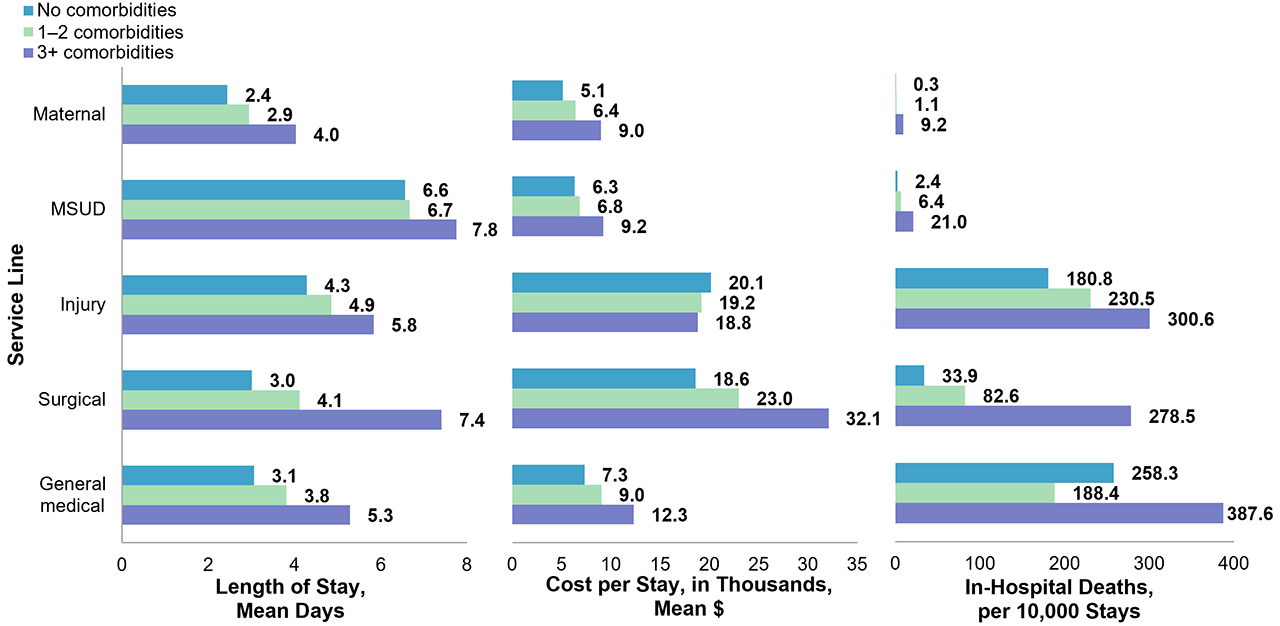
Figure 5 presents the mean length of stay, mean hospital cost per stay, and in-hospital mortality rate for stays with and without comorbidities, by hospital service line (i.e., general reason for the stay). Estimates for stays with no, one to two, and three or more comorbidities are shown separately. Figure 5. Outcomes of adult inpatient stays with and without comorbidities, by service line, 2019
Bar chart showing the mean hospital cost per stay, mean length of stay, and in-hospital mortality rate for stays with and without comorbidities, by hospital service line, presented by stays with no, one to two, or three or more comorbidities. Data are provided in Supplemental Table 5.
|
|
Appendix. Number and percentage of inpatient stays by type of comorbid condition and service line, 2019
|
|||||||||||||||||||||||||||||||||||||||||||||||||||||||||||||||||||||||||||||||||||||||||||||||||||||||||||||||||||||||||||||||||||||||||||||||||||||||||||||||||||||||||||||||||||||||||||||||||||||||||||||||||||||||||||||||||||||||||||||||||||||||||||||||||||||||||||||||||||||||||||||||||||||||||||||||||||||||||||||||||||||||||||||||||||||||||||||||||||||||||||||||||||||||||||||||||||||||||||||||||||||||||||||||||||||||||||||||||||||||||||||||||
|
References
|
|||||||||||||||||||||||||||||||||||||||||||||||||||||||||||||||||||||||||||||||||||||||||||||||||||||||||||||||||||||||||||||||||||||||||||||||||||||||||||||||||||||||||||||||||||||||||||||||||||||||||||||||||||||||||||||||||||||||||||||||||||||||||||||||||||||||||||||||||||||||||||||||||||||||||||||||||||||||||||||||||||||||||||||||||||||||||||||||||||||||||||||||||||||||||||||||||||||||||||||||||||||||||||||||||||||||||||||||||||||||||||||||||
|
About Statistical Briefs
Healthcare Cost and Utilization Project (HCUP) Statistical Briefs provide basic descriptive statistics on a variety of topics using HCUP administrative healthcare data. Topics include hospital inpatient, ambulatory surgery, and emergency department use and costs, quality of care, access to care, medical conditions, procedures, and patient populations, among other topics. The reports are intended to generate hypotheses that can be further explored in other research; the reports are not designed to answer in-depth research questions using multivariate methods. |
|||||||||||||||||||||||||||||||||||||||||||||||||||||||||||||||||||||||||||||||||||||||||||||||||||||||||||||||||||||||||||||||||||||||||||||||||||||||||||||||||||||||||||||||||||||||||||||||||||||||||||||||||||||||||||||||||||||||||||||||||||||||||||||||||||||||||||||||||||||||||||||||||||||||||||||||||||||||||||||||||||||||||||||||||||||||||||||||||||||||||||||||||||||||||||||||||||||||||||||||||||||||||||||||||||||||||||||||||||||||||||||||||
|
Data Source
The estimates in this Statistical Brief are based upon data from the HCUP 2019 National Inpatient Sample (NIS). |
|||||||||||||||||||||||||||||||||||||||||||||||||||||||||||||||||||||||||||||||||||||||||||||||||||||||||||||||||||||||||||||||||||||||||||||||||||||||||||||||||||||||||||||||||||||||||||||||||||||||||||||||||||||||||||||||||||||||||||||||||||||||||||||||||||||||||||||||||||||||||||||||||||||||||||||||||||||||||||||||||||||||||||||||||||||||||||||||||||||||||||||||||||||||||||||||||||||||||||||||||||||||||||||||||||||||||||||||||||||||||||||||||
|
Definitions
ICD-10-CM Diagnoses
ICD-10-CM is the International Classification of Diseases, Tenth Revision, Clinical Modification. There are over 70,000 ICD-10-CM diagnosis codes.
Case definition
By identifying comorbidities solely by the secondary diagnoses, some comorbidities may be missed because the principal diagnosis is an ICD-10-CM "combination" code that includes information on more than one condition. For example, the ICD-10-CM code I11.0, Hypertensive heart disease with heart failure, is often reported as a principal diagnosis and indicates heart failure with a comorbid condition of hypertension. In this case, using only secondary diagnoses to identify comorbid conditions will not identify hypertension as a comorbidity. In some cases, ICD-10-CM coding rules require that two diagnosis codes be reported in tandem for certain conditions. For example, the type of heart failure (ICD-10-CM code I50.–) is required to be reported as a secondary diagnosis when hypertensive heart disease (ICD-10-CM code I11.-) is the principal diagnosis. To eliminate instances of paired codes identifying comorbidities, the SAS® program for the Elixhauser Comorbidity Software Refined for ICD-10-CM was modified such that a comorbidity is only identified if it is not simultaneously identified as a principal diagnosis. Additional details on possible modifications to the Elixhauser Comorbidity Software Refined for ICD-10-CM are available in the User Guide available on the HCUP User Support (HCUP-US) website. For the Statistical Brief, related comorbid conditions were grouped together such that the 38 individual comorbidities from the Elixhauser Comorbidity Software Refined are displayed as 29 conditions. Hypertension includes hypertension with and without complications. Diabetes includes diabetes with and without chronic complications. Deficiency anemias include nutritional anemias as well as those from chronic blood loss. Liver disorders include mild forms of liver disease (e.g., alcoholic fatty liver, toxic liver disease, hepatic fibrosis, infarction of the liver, unspecified liver disease) and moderate to severe liver disease and failure (e.g., viral hepatitis with hepatic coma, hepatic failure, and esophageal and gastric varices). Kidney disease and failure includes moderate (e.g., stage 3 or unspecified chronic kidney disease or unspecified kidney failure) and severe (e.g., stage 5 chronic kidney disease or end-stage renal disease) forms of the disease. Cancer includes the five different cancer comorbidities (i.e., leukemia, lymphoma, metastatic cancer, malignant solid tumor without metastasis, in situ solid tumor without metastasis). Of the 30.2 million adult inpatient stays in 2019 (based on the 2019 NIS), half (50.4 percent) had three or more of the 38 possible comorbidities.
Types of hospitals included in the HCUP National Inpatient Sample
Unit of analysis
Costs and charges
Service line
The service lines are defined by major diagnostic categories (MDCs), Medicare Severity Diagnosis-Related Group (MS-DRGs), and Clinical Classifications Software Refined (CCSR) for ICD-10-CM diagnoses. MDCs assign ICD-10-CM principal diagnosis codes to 1 of 25 general diagnosis categories. MS-DRGs comprise a patient classification system that categorizes patients into groups that are clinically coherent and homogeneous with respect to resource use. MS-DRGs group patients according to diagnosis, type of treatment (procedure), age, and other relevant criteria. Each hospital stay has one assigned MS-DRG. The CCSR for ICD-10-CM aggregates more than 70,000 ICD-10-CM diagnosis codes into over 530 clinical categories across 21 body systems. The five hospital service lines are defined as follows:
Community-level income
Expected payer
Hospital stays that were expected to be billed to the State Children's Health Insurance Program (SCHIP) are included under Medicaid. For this Statistical Brief, when more than one payer is listed for a hospital discharge, the first-listed payer is used.
Reporting of race and ethnicity
|
|||||||||||||||||||||||||||||||||||||||||||||||||||||||||||||||||||||||||||||||||||||||||||||||||||||||||||||||||||||||||||||||||||||||||||||||||||||||||||||||||||||||||||||||||||||||||||||||||||||||||||||||||||||||||||||||||||||||||||||||||||||||||||||||||||||||||||||||||||||||||||||||||||||||||||||||||||||||||||||||||||||||||||||||||||||||||||||||||||||||||||||||||||||||||||||||||||||||||||||||||||||||||||||||||||||||||||||||||||||||||||||||||
The Healthcare Cost and Utilization Project (HCUP, pronounced "H-Cup") is a family of healthcare databases and related software tools and products developed through a Federal-State-Industry partnership and sponsored by the Agency for Healthcare Research and Quality (AHRQ). HCUP databases bring together the data collection efforts of State data organizations, hospital associations, and private data organizations (HCUP Partners) and the Federal government to create a national information resource of encounter-level healthcare data. HCUP includes the largest collection of longitudinal hospital care data in the United States, with all-payer, encounter-level information beginning in 1988. These databases enable research on a broad range of health policy issues, including cost and quality of health services, medical practice patterns, access to healthcare programs, and outcomes of treatments at the national, State, and local market levels.
HCUP would not be possible without the contributions of the following data collection Partners from across the United States:
|
Alaska Department of Health Alaska Hospital and Healthcare Association Arizona Department of Health Services Arkansas Department of Health California Department of Health Care Access and Information Colorado Hospital Association Connecticut Hospital Association Delaware Division of Public Health District of Columbia Hospital Association Florida Agency for Health Care Administration Georgia Hospital Association Hawaii Laulima Data Alliance Hawaii University of Hawai'i at Hilo Illinois Department of Public Health Indiana Hospital Association Iowa Hospital Association Kansas Hospital Association Kentucky Cabinet for Health and Family Services Louisiana Department of Health Maine Health Data Organization Maryland Health Services Cost Review Commission Massachusetts Center for Health Information and Analysis Michigan Health & Hospital Association Minnesota Hospital Association Mississippi State Department of Health Missouri Hospital Industry Data Institute |
Montana Hospital Association Nebraska Hospital Association Nevada Department of Health and Human Services New Hampshire Department of Health & Human Services New Jersey Department of Health New Mexico Department of Health New York State Department of Health North Carolina Department of Health and Human Services North Dakota (data provided by the Minnesota Hospital Association) Ohio Hospital Association Oklahoma State Department of Health Oregon Association of Hospitals and Health Systems Oregon Health Authority Pennsylvania Health Care Cost Containment Council Rhode Island Department of Health South Carolina Revenue and Fiscal Affairs Office South Dakota Association of Healthcare Organizations Tennessee Hospital Association Texas Department of State Health Services Utah Department of Health Vermont Association of Hospitals and Health Systems Virginia Health Information Washington State Department of Health West Virginia Department of Health and Human Resources Wisconsin Department of Health Services Wyoming Hospital Association |
The HCUP National (Nationwide) Inpatient Sample (NIS) is a nationwide database of hospital inpatient stays. The NIS is nationally representative of all community hospitals (i.e., short-term, non-Federal, nonrehabilitation hospitals). The NIS includes all payers. It is drawn from a sampling frame that contains hospitals comprising more than 96 percent of all discharges in the United States. The vast size of the NIS allows the study of topics at the national and regional levels for specific subgroups of patients. In addition, NIS data are standardized across years to facilitate ease of use. Over time, the sampling frame for the NIS has changed; thus, the number of States contributing to the NIS varies from year to year. The NIS is intended for national estimates only; no State-level estimates can be produced. The unweighted sample size for the 2019 NIS is 7,083,805 (weighted, this represents 35,419,023 inpatient stays).
For other information on characteristics of hospital stays, refer to the Hospital Overview HCUP Statistical Briefs topic area located at https://www.hcup-us.ahrq.gov/reports/statbriefs/sbtopic.jsp.
For additional HCUP statistics, visit:
For more information about HCUP, visit www.hcup-us.ahrq.gov/.
For a detailed description of HCUP and more information on the design of the National Inpatient Sample (NIS), please refer to the following database documentation:
Agency for Healthcare Research and Quality. Overview of the National (Nationwide) Inpatient Sample (NIS). Healthcare Cost and Utilization Project (HCUP). Rockville, MD: Agency for Healthcare Research and Quality. Updated September 2022. www.hcup-us.ahrq.gov/nisoverview.jsp. Accessed November 16, 2022.
Owens PL (AHRQ), Liang L (AHRQ), Barrett ML (ML Barrett, Inc), Fingar KR (consultant to IBM). Comorbidities Associated With Adult Inpatient Stays, 2019. HCUP Statistical Brief #303. December 2022. Agency for Healthcare Research and Quality, Rockville, MD. www.hcup-us.ahrq.gov/reports/statbriefs/sb303-Comorbidities-Adult-Hospitalizations-2019.pdf.
The authors would like to acknowledge the contributions of Clare Sun and Minya Sheng of IBM.
***
AHRQ welcomes questions and comments from readers of this publication who are interested in obtaining more information about access, cost, use, financing, and quality of healthcare in the United States. We also invite you to tell us how you are using this Statistical Brief and other HCUP data and tools, and to share suggestions on how HCUP products might be enhanced to further meet your needs. Please email us at hcup@ahrq.gov or send a letter to the address below:
Joel W. Cohen, Ph.D., Director
Center for Financing, Access and Cost Trends
Agency for Healthcare Research and Quality
5600 Fishers Lane
Rockville, MD 20857
This Statistical Brief was posted online on December 15, 2022.
a Agency for Healthcare Research and Quality. Cost-to-Charge Ratio Files. Healthcare Cost and Utilization Project (HCUP). Agency for Healthcare Research and Quality. Updated November 2021. www.hcup-us.ahrq.gov/db/state/costtocharge.jsp. Accessed March 9, 2022.
b Claritas. Claritas Demographic Profile by ZIP Code. https://claritas360.claritas.com/mybestsegments/. Accessed March 9, 2022.
| Supplemental Table 1. Number and percentage of adult inpatient stays with a comorbidity, 2019, for data presented in Figure 1 | ||
| Comorbidity condition | Stays with a comorbidity | |
|---|---|---|
| Number (millions) |
% | |
| Any comorbidity | 25.4 | 84.1 |
| Hypertension | 16.1 | 53.2 |
| Without complications | 9.5 | — |
| With complications | 6.6 | — |
| Diabetes | 8.0 | 26.4 |
| Without complications | 3.1 | — |
| With complications | 4.9 | — |
| Chronic respiratory (lung) disease | 6.2 | 20.5 |
| Deficiency anemias (nutritional & blood loss) | 5.4 | 18.0 |
| Nutritional anemias | 5.2 | — |
| Chronic blood loss anemia | 0.2 | — |
| Obesity | 5.1 | 17.0 |
| Kidney disease & failure | 4.9 | 16.3 |
| Moderate | 3.3 | — |
| Severe | 1.7 | — |
| Heart failure | 4.3 | 14.2 |
| Hypothyroidism | 3.9 | 13.0 |
| Depression | 3.9 | 12.8 |
| Cancer* | 2.2 | 7.3 |
| Weight loss | 2.0 | 6.7 |
| Valvular disease | 2.0 | 6.5 |
| Liver disease & failure | 1.9 | 6.4 |
| Mild | 1.5 | — |
| Moderate to severe | 0.4 | — |
| Other neurological disorders | 1.9 | 6.4 |
| Dementia | 1.9 | 6.2 |
| Coagulopathy | 1.8 | 6.0 |
| Peripheral vascular disease | 1.7 | 5.5 |
| Drug abuse | 1.6 | 5.2 |
| Alcohol abuse | 1.5 | 4.9 |
| Paralysis | 1.3 | 4.3 |
| Psychoses | 1.3 | 4.1 |
| Pulmonary circulation disease | 1.1 | 3.8 |
| Seizures and epilepsy | 1.1 | 3.8 |
| Autoimmune conditions | 1.0 | 3.3 |
| Cerebrovascular disease | 1.0 | 3.3 |
| Neurological disorders affecting movement | 0.8 | 2.5 |
| Other thyroid disorders | 0.4 | 1.2 |
| Peptic ulcer with bleeding | 0.3 | 0.9 |
| AIDS | 0.2 | 0.6 |
| Supplemental Table 2. Presence and number of comorbidities among adult inpatient stays, by patient characteristics, 2019, for data presented in Figure 2 | |||
| Patient characteristic | Percentage of stays | ||
|---|---|---|---|
| 0 comorbidities | 1–2 comorbidities | 3+ comorbidities | |
| All | 15.9 | 33.6 | 50.4 |
| Age, years | |||
| 18–24 | 52.2 | 40.1 | 7.7 |
| 25–34 | 48.4 | 39.1 | 12.5 |
| 35–44 | 28.4 | 42.5 | 29.0 |
| 45–54 | 11.6 | 38.8 | 49.6 |
| 55–64 | 7.4 | 33.9 | 58.7 |
| 65–84 | 4.2 | 28.9 | 66.9 |
| 85+ | 2.5 | 24.8 | 72.7 |
| Sex | |||
| Male | 9.5 | 34.5 | 56.0 |
| Female | 20.8 | 33.0 | 46.2 |
| Race/ethnicity | |||
| Asian/Pacific Islander NH | 26.4 | 33.3 | 40.3 |
| Black NH | 14.2 | 32.1 | 53.7 |
| Hispanic | 25.1 | 34.4 | 40.5 |
| White NH | 14.0 | 33.8 | 52.3 |
| Other NH | 21.4 | 34.7 | 43.9 |
| Expected payer | |||
| Medicare | 3.8 | 27.3 | 68.8 |
| Medicaid | 26.1 | 37.4 | 36.4 |
| Private insurance | 28.9 | 40.3 | 30.7 |
| Self-pay/No charge* | 23.6 | 43.5 | 32.9 |
| Other | 23.2 | 38.2 | 38.6 |
| Community-level income | |||
| Quartile 1 (lowest) | 14.5 | 32.5 | 53.0 |
| Quartiles 2 and 3 | 16.0 | 33.7 | 50.3 |
| Quartile 4 (highest) | 18.2 | 35.2 | 46.5 |
| Supplemental Table 3. Presence and number of comorbidities among adult inpatient stays, by hospital service line, 2019, for data presented in Figure 3 | |||
| Service line | Percentage of stays | ||
|---|---|---|---|
| 0 comorbidities | 1–2 comorbidities | 3+ comorbidities | |
| All inpatient stays (N=30,218,300) |
15.9 | 33.6 | 50.4 |
| Maternal (N=3,849,100) |
62.8 | 33.4 | 3.8 |
| Mental health and/or substance use disorders (N=1,722,800) |
19.4 | 49.4 | 31.2 |
| Injury (N=1,581,000) |
15.3 | 36.7 | 48.0 |
| Surgical (N=6,967,800) |
12.5 | 40.4 | 47.1 |
| General medical (N=16,097,600) |
5.9 | 28.8 | 65.3 |
| Supplemental Table 4. Top five comorbid conditions by type of comorbidity and service line, 2019, for data presented in Figure 4 | |||
| Comorbidity condition | Percentage of service line with condition | ||
|---|---|---|---|
| Maternal (N=3,849,100) | |||
| Obesity | 11.2 | ||
| Deficiency anemias (nutritional & blood loss) | 8.9 | ||
| Nutritional anemias | 8.8 | ||
| Chronic blood loss anemia | 0.1 | ||
| Diabetes (without & with chronic complications) | 6.0 | ||
| Without chronic complications | 5.5 | ||
| With chronic complications | 0.5 | ||
| Chronic respiratory (lung) disease | 5.9 | ||
| Depression | 4.3 | ||
| Mental health and/or substance use disorders (N=1,722,800) | |||
| Hypertension (uncomplicated & complicated) | 35.0 | ||
| Uncomplicated | 30.2 | ||
| Complicated | 4.9 | ||
| Drug abuse | 24.4 | ||
| Chronic respiratory (lung) disease | 15.8 | ||
| Depression | 15.1 | ||
| Alcohol abuse | 14.2 | ||
| Injury (N=1,581,000) | |||
| Hypertension (uncomplicated & complicated) | 57.1 | ||
| Uncomplicated | 37.8 | ||
| Complicated | 19.3 | ||
| Diabetes (without & with chronic complications) | 21.4 | ||
| Without chronic complications | 9.0 | ||
| With chronic complications | 12.4 | ||
| Chronic respiratory (lung) disease | 17.7 | ||
| Hypothyroidism | 14.4 | ||
| Depression | 14.1 | ||
| Surgical (N=6,967,800) | |||
| Hypertension (uncomplicated & complicated) | 63.4 | ||
| Uncomplicated | 42.1 | ||
| Complicated | 21.3 | ||
| Diabetes (without & with chronic complications) | 26.6 | ||
| Without chronic complications | 11.1 | ||
| With chronic complications | 15.5 | ||
| Obesity | 21.8 | ||
| Chronic respiratory (lung) disease | 18.7 | ||
| Kidney disease & failure (moderate & severe) | 14.5 | ||
| Moderate | 9.4 | ||
| Severe | 5.1 | ||
| General medical (N=16,097,600) | |||
| Hypertension (uncomplicated & complicated) | 62.5 | ||
| Uncomplicated | 33.7 | ||
| Complicated | 28.7 | ||
| Diabetes (without & with chronic complications) | 33.2 | ||
| Without chronic complications | 11.2 | ||
| With chronic complications | 22.0 | ||
| Chronic respiratory (lung) disease | 25.5 | ||
| Kidney disease & failure (moderate & severe) | 22.8 | ||
| Moderate | 15.1 | ||
| Severe | 7.7 | ||
| Deficiency anemias (nutritional & blood loss) | 23.4 | ||
| Nutritional | 22.4 | ||
| Blood loss | 1.0 | ||
| Supplemental Table 5. Outcomes of adult inpatient stays with and without comorbidities, by service line, 2019, for data presented in Figure 5 | |||
| Service line | 0 comorbidities | 1–2 comorbidities | 3+ comorbidities |
|---|---|---|---|
| Length of stay, mean days | |||
| Maternal | 2.4 | 2.9 | 4.0 |
| MSUD | 6.6 | 6.7 | 7.8 |
| Injury | 4.3 | 4.9 | 5.8 |
| Surgical | 3.0 | 4.1 | 7.4 |
| General medical | 3.1 | 3.8 | 5.3 |
| Cost per stay, in thousands, mean $ | |||
| Maternal | 5.1 | 6.4 | 9.0 |
| MSUD | 6.3 | 6.8 | 9.2 |
| Injury | 20.1 | 19.2 | 18.8 |
| Surgical | 18.6 | 23.0 | 32.1 |
| General medical | 7.3 | 9.0 | 12.3 |
| In-hospital deaths, per 10,000 stays | |||
| Maternal | 0.3 | 1.1 | 9.2 |
| MSUD | 2.4 | 6.4 | 21.0 |
| Injury | 180.8 | 230.5 | 300.6 |
| Surgical | 33.9 | 82.6 | 278.5 |
| General medical | 258.3 | 188.4 | 387.6 |
| Internet Citation: Statistical Brief #303. Healthcare Cost and Utilization Project (HCUP). December 2022. Agency for Healthcare Research and Quality, Rockville, MD. hcup-us.ahrq.gov/reports/statbriefs/sb303-Comorbidities-Adult-Hospitalizations-2019.jsp. |
| Are you having problems viewing or printing pages on this website? |
| If you have comments, suggestions, and/or questions, please contact hcup@ahrq.gov. |
| If you are experiencing issues related to Section 508 accessibility of information on this website, please contact hcup@ahrq.gov. |
| Privacy Notice, Viewers & Players |
| Last modified 12/14/22 |