|
STATISTICAL BRIEF #300
December 2022
Marc Roemer, M.S., and Jennifer Welch, M.P.H. Introduction In the United States in 2019, there were approximately 35.4 million hospitalizations, about 2 percent of which resulted in an in-hospital death.1 At the start of the COVID-19 pandemic in April 2020, the number of hospitalizations declined substantially, with a 28 percent decrease in hospitalizations compared with April 2019, while the in-hospital mortality rate increased from 2.0 percent in April 2019 to 3.7 percent in April 2020.2 Although studies have examined the change in the number of hospitalizations before versus during the COVID-19 pandemic for certain patient demographic groups and conditions,3-6 little is known about the variation in the types of conditions resulting in hospitalization and changes in the in-hospital mortality rate. This Healthcare Cost and Utilization Project (HCUP) Statistical Brief presents data on hospitalizations based on the 2019 and 2020 State Inpatient Databases (SID) from 38 States plus the District of Columbia. The initial period of the COVID-19 pandemic (April-December 2020) is compared with the same months in the prior year. The number of inpatient stays and the rate of in-hospital deaths are presented for both time periods across all conditions and for COVID-19-related visits specifically in 2020. In addition, the variation in the percentage of COVID-19-related in-hospital deaths among the 38 States and DC is provided. The change in the number of inpatient stays and in-hospital deaths is presented by patient characteristics. Principal diagnoses with the largest decrease in hospitalizations in April-December of 2019 versus 2020 are examined, and the top principal diagnoses among COVID-19-related and non-COVID-related deaths are enumerated. Because the HCUP SID cover nearly the entire universe of hospital encounters in a State, small differences can be evident but not meaningful. Thus, only differences greater than or equal to 10 percent are discussed in the text. This analysis is limited to inpatient stays in 38 States (Alaska, Arizona, Arkansas, California, Colorado, Connecticut, Georgia, Hawaii, Illinois, Indiana, Iowa, Kansas, Kentucky, Louisiana, Maine, Maryland, Michigan, Minnesota, Mississippi, Montana, Nevada, New Jersey, New Mexico, North Carolina, North Dakota, Ohio, Oregon, Rhode Island, South Carolina, South Dakota, Tennessee, Texas, Utah, Vermont, Virginia, Washington, West Virginia, and Wisconsin) and the District of Columbia for which HCUP data were available for April-December 2019 and April-December 2020. These States accounted for 75 percent of the resident U.S. population in 2020.7 Information contained in this Statistical Brief was primarily obtained from the HCUP Summary Trend Tables.2 The HCUP Summary Trend Tables, accessed as downloadable tables, provide State-specific monthly trends in hospital utilization for the most recent HCUP data available. These tables were also used to create the HCUP Visualization of Inpatient Trends in COVID-19 and Other Conditions8 and will be updated periodically as more data become available. |
|
Findings
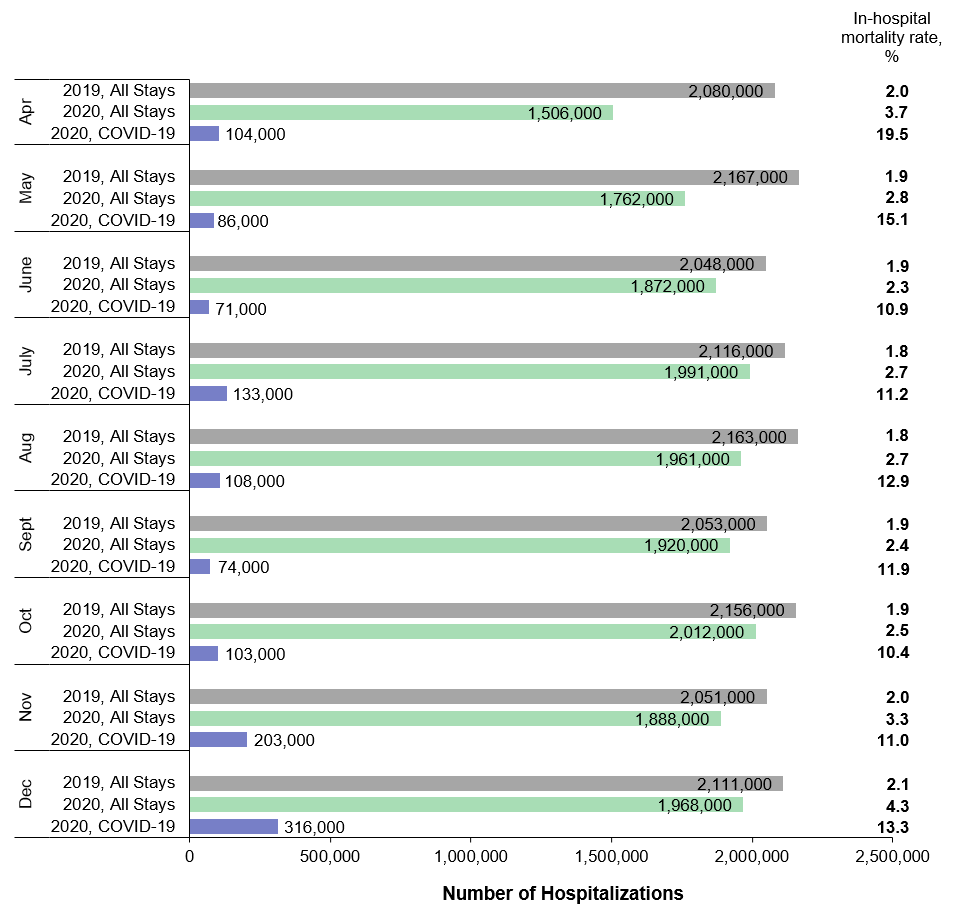
Hospitalization volume and percentage of in-hospital deaths in April–December 2019 and 2020 Figure 1 presents monthly information on hospitalization volume and the percentage of in-hospital deaths for all conditions in 2019, all conditions in 2020, and COVID-19-related hospitalizations in 2020. In total, there were 18,946,173 hospitalizations in April–December 2019 and 16,880,162 hospitalizations in April–December 2020 across 38 States and DC, a decrease of 10.9 percent. There were 1,198,585 COVID-19-related hospitalizations in April–December 2020. The in-hospital mortality rate was 1.9 percent during April–December 2019 and increased to 2.9 percent during April–December 2020. Figure 1. Number of hospitalizations and in-hospital mortality rate by month, 38 States plus DC, April–December 2019 and 2020
Bar chart that presents monthly information on hospitalization volume and the percentage of
in-hospital deaths for all conditions in 2019, all conditions in 2020, and COVID-19-related
hospitalizations in 2020 among 38 States plus DC. Data are provided in Supplemental Table 1.
|
|
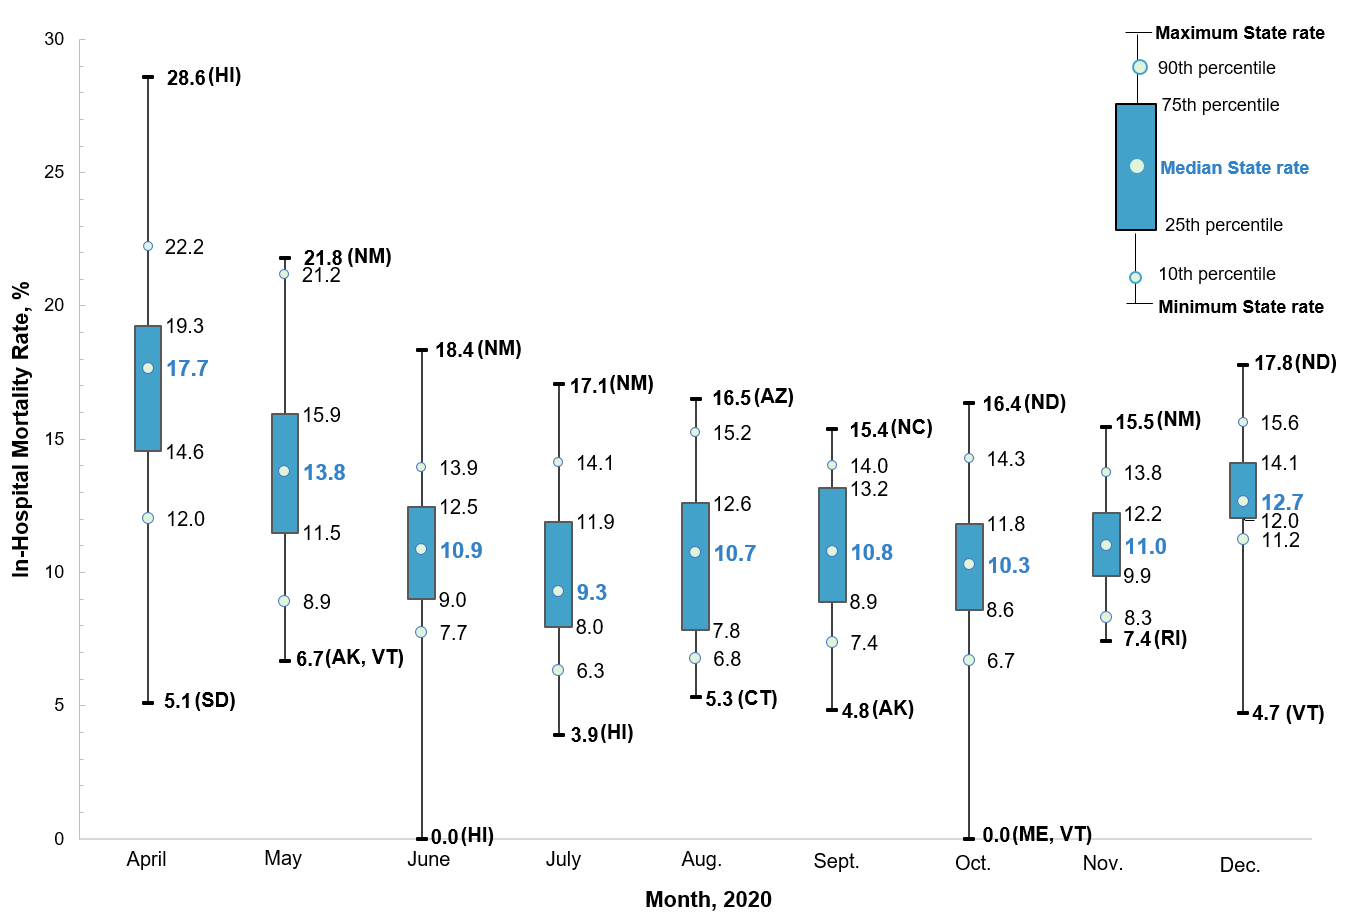
Figure 2 displays the distribution (i.e., minimum and maximum values, the interquartile range from the 25th
to the 75th percentiles as well as the 10th and 90th percentiles) of the monthly COVID-19-related in-hospital
mortality rate among 38 States plus DC included in this Statistical Brief. The median percentage among 38
States plus DC is also presented.
Figure 2. Variation in State-level COVID-19-related in-hospital mortality rate, by month, 38 States plus DC, April–December 2020
Scatter plot that shows the distribution (i.e., minimum and maximum values, the interquartile range
from the 25th to the 75th percentiles as well as the 10th and 90th percentiles) of the monthly
COVID-19-related in-hospital mortality rate among 38 States plus DC. Data are provided in
Supplemental Table 2.
|
|
Table 1 presents information on the number of hospitalizations and all-cause in-hospital deaths and the
percentage change in each by select patient characteristics for April–December 2019 versus
April–December 2020 across 38 States plus DC.
Table 1. Number of hospitalizations, number of in-hospital deaths, and percentage change, by patient characteristic, 38 States plus DC, April–December 2019 and 2020 |
||||||||||||||||||||||||||||||||||||||||||||||||||||||||||||||||||||||||||||||||||||||||||||||||||||||||||||||||||||||||||||||||||||||||||||||||||||||||||||||||||||||||||||||
|
||||||||||||||||||||||||||||||||||||||||||||||||||||||||||||||||||||||||||||||||||||||||||||||||||||||||||||||||||||||||||||||||||||||||||||||||||||||||||||||||||||||||||||||
|
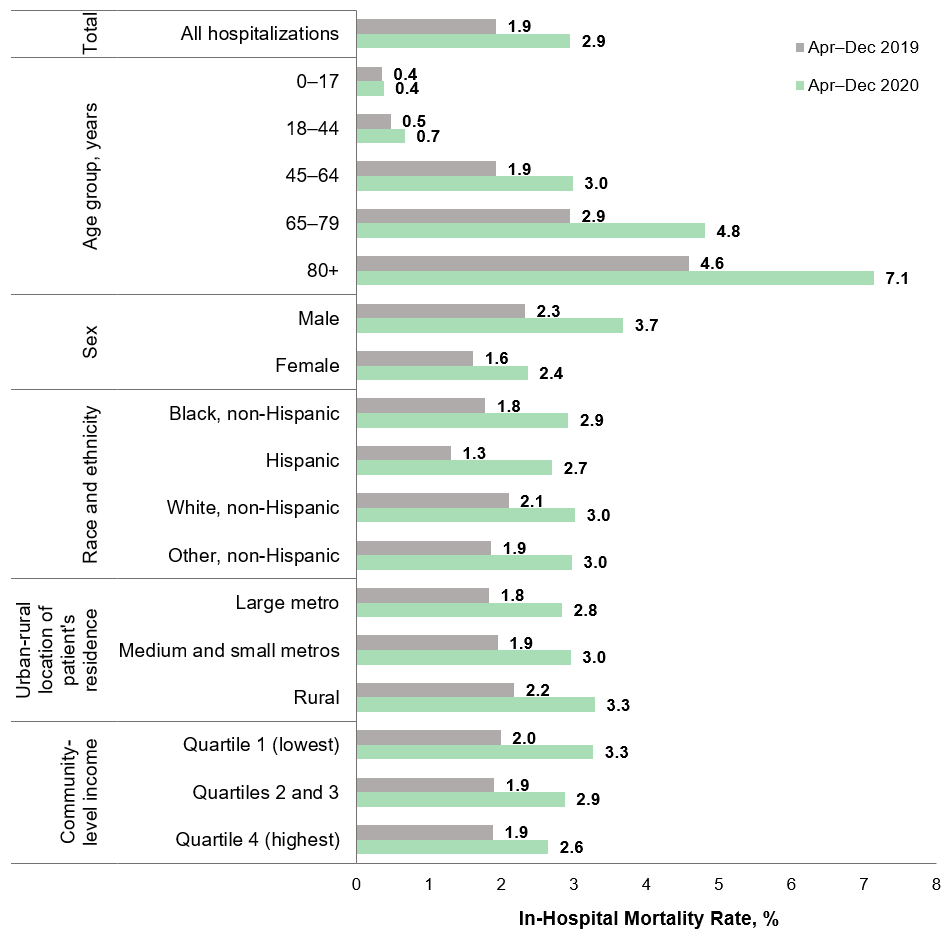
Figure 3 displays the all-cause in-hospital mortality rate by patient characteristic in April through
December 2019 and 2020 across 38 States plus DC.
Figure 3. All-cause in-hospital mortality rate, by patient characteristic, 38 States plus DC, April–December 2019 and 2020
Bar chart that presents the all-cause in-hospital mortality rate by patient characteristic (age
group, sex, race and ethnicity, urban-rural location of patient's residence, and community-level
income) in April through December 2019 and 2020 across 38 States plus DC. Data are provided in
Supplemental Table 3.
|
||||||||||||||||||||||||||||||||||||||||||||||||||||||||||||||||||||||||||||||||||||||||||||||||||||||||||||||||||||||||||||||||||||||||||||||||||||||||||||||||||||||||||||||
|
Changes in hospitalizations by condition in April–December 2019 and 2020
Table 2 presents information on hospitalizations in April–December 2019 and 2020 by condition. The table lists the top 10 principal diagnoses with the greatest decrease in the number of hospitalizations and those with the greatest percentage decrease in the number of hospitalizations. Conditions listed have at least 10,000 hospitalizations in 2019. The table displays the condition chiefly responsible for the hospitalization (principal diagnosis) and all-listed conditions that coexisted at the time of the hospitalization. Table 2. Top 10 conditions ranked by the greatest decrease in number of hospitalizations and greatest percentage decrease in hospitalizations, 38 States plus DC, April–December 2019 and 2020 |
|||||||||||||||||||||||||||||||||||||||||||||||||||||||||||||||||||||||||||||||||||||||||||||||||||||||||||||||||||||||||||||||||||||||||||||||||||||||||||||||||||||||||||||||
|
|||||||||||||||||||||||||||||||||||||||||||||||||||||||||||||||||||||||||||||||||||||||||||||||||||||||||||||||||||||||||||||||||||||||||||||||||||||||||||||||||||||||||||||||
|
In-hospital deaths by principal diagnosis in April–December 2019 and 2020
Table 3 presents the top 10 principal diagnoses among COVID-19-related hospitalizations for which the patient died in the hospital during April–December 2020. Table 3. Top 10 principal diagnoses among COVID-19-related in-hospital deaths, 38 States plus DC, April–December 2020 |
|||||||||||||||||||||||||||||||||||||||||||||||||||||||||||||||||||||||||||||||||||||||||||||||||||||||||||||||||||||||||||||||||||||||||||||||||||||||||||||||||||||||||||||||
|
|||||||||||||||||||||||||||||||||||||||||||||||||||||||||||||||||||||||||||||||||||||||||||||||||||||||||||||||||||||||||||||||||||||||||||||||||||||||||||||||||||||||||||||||
|
Table 4 presents the top 10 principal diagnoses among non-COVID-19-related hospitalizations for which the patient died in the
hospital during April–December 2019 and 2020. The table also provides the percentage change in the number of in-hospital
deaths among hospitalizations not related to COVID-19 during April–December 2020 compared with the same months in 2019.
Table 4. Top 10 principal diagnoses among non-COVID-19-related in-hospital deaths, 38 States plus DC, April–December 2019 and 2020 |
|||||||||||||||||||||||||||||||||||||||||||||||||||||||||||||||||||||||||||||||||||||||||||||||||||||||||||||||||||||||||||||||||||||||||||||||||||||||||||||||||||||||||||||||
|
|||||||||||||||||||||||||||||||||||||||||||||||||||||||||||||||||||||||||||||||||||||||||||||||||||||||||||||||||||||||||||||||||||||||||||||||||||||||||||||||||||||||||||||||
|
References
|
|||||||||||||||||||||||||||||||||||||||||||||||||||||||||||||||||||||||||||||||||||||||||||||||||||||||||||||||||||||||||||||||||||||||||||||||||||||||||||||||||||||||||||||||
|
About Statistical Briefs
Healthcare Cost and Utilization Project (HCUP) Statistical Briefs provide basic descriptive statistics on a variety of topics using HCUP administrative healthcare data. Topics include hospital inpatient, ambulatory surgery, and emergency department use and costs, quality of care, access to care, medical conditions, procedures, and patient populations, among other topics. The reports are intended to generate hypotheses that can be further explored in other research; the reports are not designed to answer in-depth research questions using multivariate methods. |
|||||||||||||||||||||||||||||||||||||||||||||||||||||||||||||||||||||||||||||||||||||||||||||||||||||||||||||||||||||||||||||||||||||||||||||||||||||||||||||||||||||||||||||||
|
Data Source
The estimates in this Statistical Brief are based upon data from the HCUP 2019-2020 State Inpatient Databases (SID) for 38 States and the District of Columbia for which there were monthly data available through December 2020 in the HCUP Summary Trend Tables. The States included in this Statistical Brief were Alaska, Arizona, Arkansas, California, Colorado, Connecticut, Georgia, Hawaii, Illinois, Indiana, Iowa, Kansas, Kentucky, Louisiana, Maine, Maryland, Michigan, Minnesota, Mississippi, Montana, Nevada, New Jersey, New Mexico, North Carolina, North Dakota, Ohio, Oregon, Rhode Island, South Carolina, South Dakota, Tennessee, Texas, Utah, Vermont, Virginia, Washington, West Virginia, and Wisconsin, as well as the District of Columbia. |
|||||||||||||||||||||||||||||||||||||||||||||||||||||||||||||||||||||||||||||||||||||||||||||||||||||||||||||||||||||||||||||||||||||||||||||||||||||||||||||||||||||||||||||||
|
Definitions
Diagnoses, ICD-10-CM, and Clinical Classifications Software Refined (CCSR) for ICD-10-CM Diagnoses
ICD-10-CM is the International Classification of Diseases, Tenth Revision, Clinical Modification. There are over 70,000 ICD-10-CM diagnosis codes. The CCSR aggregates ICD-10-CM diagnosis codes into a manageable number of clinically meaningful categories.a The CCSR is intended to be used analytically to examine patterns of healthcare in terms of cost, utilization, and outcomes; rank utilization by diagnoses; and risk-adjust by clinical condition. The CCSR capitalizes on the specificity of the ICD-10-CM coding scheme and allows ICD-10-CM codes to be classified in more than one category. Approximately 10 percent of diagnosis codes are associated with more than one CCSR category because the diagnosis code documents either multiple conditions or a condition along with a common symptom or manifestation. For this Statistical Brief, the principal diagnosis code is assigned to a single default CCSR based on clinical coding guidelines, etiology and pathology of diseases, and standards set by other Federal agencies. The assignment of the default CCSR for the principal diagnosis is available starting with version v2020.2 of the software tool. ICD-10-CM coding definitions for each CCSR category presented in this Statistical Brief can be found in the CCSR reference file, available at www.hcup-us.ahrq.gov/toolsssoftware/ccsr/ccs_refined.jsp#download. For this Statistical Brief, v2021.2 of the CCSR was used for 2019 data and v2022.1 was used for 2020 data.
Case definition
Types of hospitals included in HCUP State Inpatient Databases
Unit of analysis
Percentage change
Percentage change between groups equals the 2020 value minus the 2019 value
divided by the 2019 value and multiplied by 100.
Reporting of race and ethnicity
Location of patients’ residence
Community-level income
|
|||||||||||||||||||||||||||||||||||||||||||||||||||||||||||||||||||||||||||||||||||||||||||||||||||||||||||||||||||||||||||||||||||||||||||||||||||||||||||||||||||||||||||||||
The Healthcare Cost and Utilization Project (HCUP, pronounced "H-Cup") is a family of healthcare databases and related software tools and products developed through a Federal-State-Industry partnership and sponsored by the Agency for Healthcare Research and Quality (AHRQ). HCUP databases bring together the data collection efforts of State data organizations, hospital associations, and private data organizations (HCUP Partners) and the Federal government to create a national information resource of encounter-level healthcare data. HCUP includes the largest collection of longitudinal hospital care data in the United States, with all-payer, encounter-level information beginning in 1988. These databases enable research on a broad range of health policy issues, including cost and quality of health services, medical practice patterns, access to healthcare programs, and outcomes of treatments at the national, State, and local market levels.
HCUP would not be possible without the contributions of the following data collection Partners from across the United States:
|
Alaska Department of Health Alaska Hospital and Healthcare Association Arizona Department of Health Services Arkansas Department of Health California Department of Health Care Access and Information Colorado Hospital Association Connecticut Hospital Association Delaware Division of Public Health District of Columbia Hospital Association Florida Agency for Health Care Administration Georgia Hospital Association Hawaii Laulima Data Alliance Hawaii University of Hawai'i at Hilo Illinois Department of Public Health Indiana Hospital Association Iowa Hospital Association Kansas Hospital Association Kentucky Cabinet for Health and Family Services Louisiana Department of Health Maine Health Data Organization Maryland Health Services Cost Review Commission Massachusetts Center for Health Information and Analysis Michigan Health & Hospital Association Minnesota Hospital Association Mississippi State Department of Health Missouri Hospital Industry Data Institute Montana Hospital Association Nebraska Hospital Association Nevada Department of Health and Human Services |
New Hampshire Department of Health & Human Services New Jersey Department of Health New Mexico Department of Health New York State Department of Health North Carolina Department of Health and Human Services North Dakota (data provided by the Minnesota Hospital Association) Ohio Hospital Association Oklahoma State Department of Health Oregon Association of Hospitals and Health Systems Oregon Health Authority Pennsylvania Health Care Cost Containment Council Rhode Island Department of Health South Carolina Revenue and Fiscal Affairs Office South Dakota Association of Healthcare Organizations Tennessee Hospital Association Texas Department of State Health Services Utah Department of Health Vermont Association of Hospitals and Health Systems Virginia Health Information Washington State Department of Health West Virginia Department of Health and Human Resources Wisconsin Department of Health Services Wyoming Hospital Association |
The HCUP State Inpatient Databases (SID) are hospital inpatient databases from data organizations participating in HCUP. The SID contain the universe of the inpatient discharge abstracts in the participating HCUP States, translated into a uniform format to facilitate multistate comparisons and analyses. Together, the SID encompass more than 95 percent of all U.S. community hospital discharges. The SID can be used to investigate questions unique to one State, to compare data from two or more States, to conduct market-area variation analyses, and to identify State-specific trends in inpatient care utilization, access, charges, and outcomes.
For other information on COVID-19, refer to the COVID-19 HCUP Statistical Briefs topic area located at www.hcup-us.ahrq.gov/reports/statbriefs/sbtopic.jsp.
For additional HCUP statistics, visit:
For more information about HCUP, visit www.hcup-us.ahrq.gov/.
For a detailed description of HCUP and more information on the design of the State Inpatient Databases (SID), please refer to the following database documentation:
Agency for Healthcare Research and Quality. Overview of the State Inpatient Databases (SID). Healthcare Cost and Utilization Project (HCUP). Rockville, MD: Agency for Healthcare Research and Quality. Updated September 2021. www.hcup-us.ahrq.gov/sidoverview.jsp. Accessed March 9, 2022.
Roemer M (AHRQ), Welch J (IBM). Changes in Hospitalizations and In-Hospital Deaths in the Initial Period of the COVID-19 Pandemic (April–December 2020), 38 States and DC. HCUP Statistical Brief #300. December 2022. Agency for Healthcare Research and Quality, Rockville, MD. www.hcup-us.ahrq.gov/reports/statbriefs/sb300-COVID-19-AllHospital.pdf.
The authors would like to acknowledge the contributions of Pam Owens of AHRQ, Marguerite Barrett of M.L. Barrett, Inc., and Minya Sheng and Audrey Weiss of IBM.
***
AHRQ welcomes questions and comments from readers of this publication who are interested in obtaining more information about access, cost, use, financing, and quality of healthcare in the United States. We also invite you to tell us how you are using this Statistical Brief and other HCUP data and tools, and to share suggestions on how HCUP products might be enhanced to further meet your needs. Please email us at hcup@ahrq.gov or send a letter to the address below:
Joel W. Cohen, Ph.D., Director
Center for Financing, Access and Cost Trends
Agency for Healthcare Research and Quality
5600 Fishers Lane
Rockville, MD 20857
This Statistical Brief was posted online on December 6, 2022.
a Agency for Healthcare Research and Quality. Clinical Classifications Software Refined (CCSR) for ICD-10-CM Diagnoses. Healthcare Cost and Utilization Project (HCUP). Agency for Healthcare Research and Quality. Updated February 2022. www.hcup-us.ahrq.gov/toolssoftware/ccsr/dxccsr.jsp. Accessed October 23, 2022.
b Centers for Disease Control and Prevention, National Center for Health Statistics. ICD-10-CM Official Guidelines for Coding and Reporting FY 2021 (October 1, 2020 – September 30, 2021). www.cdc.gov/nchs/data/icd/10cmguidelines-FY2021.pdf. Accessed October 23, 2022.
c Claritas. Claritas Demographic Profile by ZIP Code. https://claritas360.claritas.com/mybestsegments/. Accessed October 23, 2022.
| Supplemental Table 1. Number of hospitalizations and in-hospital mortality rate by month, 38 States plus DC, April–December 2019 and 2020, for data presented in Figure 1 | |||
| Month | Year and type of stay | Number of hospitalizations | In-hospital mortality rate, % |
|---|---|---|---|
| April | 2019, All Stays | 2,080,000 | 2.0 |
| 2020, All Stays | 1,506,000 | 3.7 | |
| 2020, COVID-19 | 104,000 | 19.5 | |
| May | 2019, All Stays | 2,167,000 | 1.9 |
| 2020, All Stays | 1,762,000 | 2.8 | |
| 2020, COVID-19 | 86,000 | 15.1 | |
| June | 2019, All Stays | 2,048,000 | 1.9 |
| 2020, All Stays | 1,872,000 | 2.3 | |
| 2020, COVID-19 | 71,000 | 10.9 | |
| July | 2019, All Stays | 2,116,000 | 1.8 |
| 2020, All Stays | 1,991,000 | 2.7 | |
| 2020, COVID-19 | 133,000 | 11.2 | |
| August | 2019, All Stays | 2,163,000 | 1.8 |
| 2020, All Stays | 1,961,000 | 2.7 | |
| 2020, COVID-19 | 108,000 | 12.9 | |
| September | 2019, All Stays | 2,053,000 | 1.9 |
| 2020, All Stays | 1,920,000 | 2.4 | |
| 2020, COVID-19 | 74,000 | 11.9 | |
| October | 2019, All Stays | 2,156,000 | 1.9 |
| 2020, All Stays | 2,012,000 | 2.5 | |
| 2020, COVID-19 | 103,000 | 10.4 | |
| November | 2019, All Stays | 2,051,000 | 2.0 |
| 2020, All Stays | 1,888,000 | 3.3 | |
| 2020, COVID-19 | 203,000 | 11.0 | |
| December | 2019, All Stays | 2,111,000 | 2.1 |
| 2020, All Stays | 1,968,000 | 4.3 | |
| 2020, COVID-19 | 316,000 | 13.6 | |
| Supplemental Table 2. Variation in State-level COVID-19-related in-hospital mortality rate, by month, 38 States plus DC, April–December 2020, for data presented in Figure 2 | |||||||
| Month | State-level in-hospital mortality rate, % | ||||||
|---|---|---|---|---|---|---|---|
| Maximum State rate | 90th percentile | 75th percentile | Median State rate | 25th percentile | 10th percentile | Minimum State rate | |
| April | 28.6 (HI) | 22.2 | 19.3 | 17.7 | 14.6 | 12.0 | 5.1 (SD) |
| May | 21.8 (NM) | 21.2 | 15.9 | 13.8 | 11.5 | 8.9 | 6.7 (AK, VT) |
| June | 18.4 (NM) | 13.9 | 12.5 | 10.9 | 9.0 | 7.7 | 0.0 (HI) |
| July | 17.1 (NM) | 14.1 | 11.9 | 9.3 | 8.0 | 6.3 | 3.9 (HI) |
| August | 16.5 (AZ) | 15.2 | 12.6 | 10.7 | 7.8 | 6.8 | 5.3 (CT) |
| September | 15.4 (NC) | 14.0 | 13.2 | 10.8 | 8.9 | 7.4 | 4.8 (AK) |
| October | 16.4 (ND) | 14.3 | 11.8 | 10.3 | 8.6 | 6.7 | 0.0 (ME, VT) |
| November | 15.5 (NM) | 13.8 | 12.2 | 11.0 | 9.9 | 8.3 | 7.4 (RI) |
| December | 17.8 (ND) | 15.6 | 14.1 | 12.7 | 12.0 | 11.2 | 4.7 (VT) |
| Supplemental Table 3. All-cause in-hospital mortality rate, by patient characteristic, 38 States plus DC, April–December 2019 and 2020, for data presented in Figure 3 | ||
| Characteristic | In-hospital mortality rate, % | |
|---|---|---|
| April–Dec 2019 | April–Dec 2020 | |
| All hospitalizations | 1.9 | 2.9 |
| Age group, years | ||
| 0–17 | 0.4 | 0.4 |
| 18–44 | 0.5 | 0.7 |
| 45–64 | 1.9 | 3.0 |
| 65–79 | 2.9 | 4.8 |
| 80+ | 4.6 | 7.1 |
| Sex | ||
| Male | 2.3 | 3.7 |
| Female | 1.6 | 2.4 |
| Race and ethnicity | ||
| Black, non-Hispanic | 1.8 | 2.9 |
| Hispanic | 1.3 | 2.7 |
| White, non-Hispanic | 2.1 | 3.0 |
| Other, non-Hispanic | 1.9 | 3.0 |
| Urban-rural location of patient's residence | ||
| Large metro | 1.8 | 2.8 |
| Medium and small metro | 1.9 | 3.0 |
| Rural | 2.2 | 3.3 |
| Community-level income | ||
| Quartile 1 (lowest) | 2.0 | 3.3 |
| Quartiles 2 and 3 | 1.9 | 2.9 |
| Quartile 4 (highest) | 1.9 | 2.6 |
Percentage change between groups equals the 2020 value minus the 2019 value divided by the 2019 value multiplied by 100.
| Internet Citation: Statistical Brief #300. Healthcare Cost and Utilization Project (HCUP). November 2022. Agency for Healthcare Research and Quality, Rockville, MD. hcup-us.ahrq.gov/reports/statbriefs/sb300-COVID-19-AllHospital.jsp. |
| Are you having problems viewing or printing pages on this website? |
| If you have comments, suggestions, and/or questions, please contact hcup@ahrq.gov. |
| If you are experiencing issues related to Section 508 accessibility of information on this website, please contact hcup@ahrq.gov. |
| Privacy Notice, Viewers & Players |
| Last modified 11/30/22 |