|
STATISTICAL BRIEF #299
November 2022
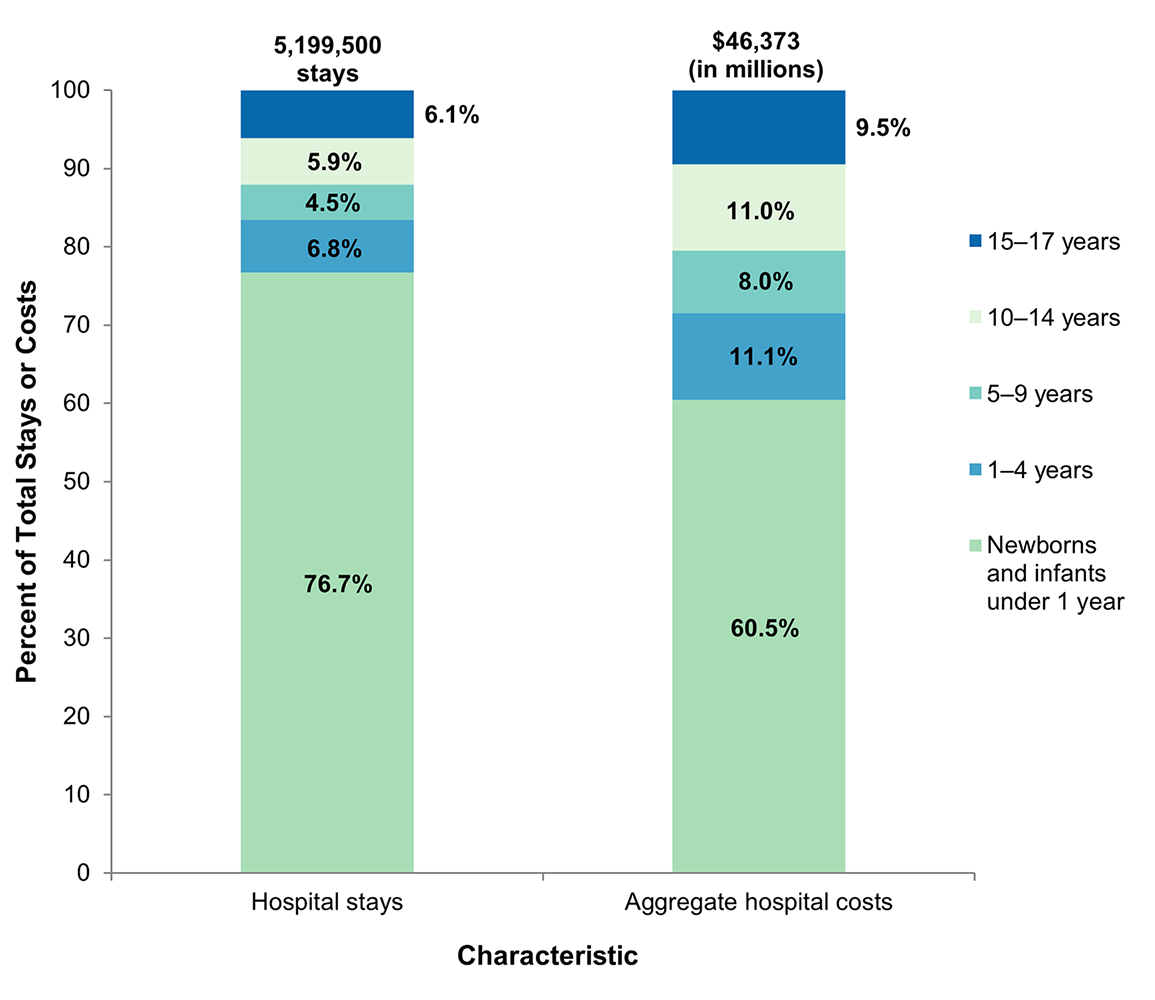
Audrey J. Weiss, Ph.D., Lan Liang, Ph.D., and Kimberly Martin, Ph.D. Introduction Children are hospitalized for a variety of reasons, including birth, appendicitis, and respiratory conditions such as asthma and pneumonia.1,2 Pediatric hospitalizations have been declining in recent years.2 Between 2004 and 2019, the number and rate of inpatient stays for children aged 0–17 years decreased by 20 percent.3 Factors such as a shift to outpatient services as well as increased pediatric care coordination (e.g., through accountable care organizations and patient-centered medical homes) may be changing the nature of pediatric hospitalizations.4,5 Bucholz et al.6 found that both pediatric admissions involving complex chronic conditions and pediatric readmissions increased between 2010 and 2016. Given these changes, understanding the current characteristics of and reasons for inpatient hospitalizations among children is important to inform pediatric clinical practice as well as health policy initiatives aimed at improving children's health. This Healthcare Cost and Utilization Project (HCUP) Statistical Brief presents statistics on hospital stays among children and adolescents, aged 0–17 years, using weighted national estimates from the 2019 National Inpatient Sample (NIS) and State-level estimates from the 2019 State Inpatient Databases (SID). The distribution of hospital stays and aggregate costs by pediatric age group is provided. Characteristics of children's hospital stays are presented by pediatric age group and primary expected payer. The most common principal diagnoses are provided by pediatric age group. Finally, characteristics of pediatric hospitalizations are presented for 48 States and the District of Columbia. Because of the large sample size of the NIS and SID data, small differences can be statistically significant. Thus, only differences greater than or equal to 10 percent are discussed in the text. Findings Characteristics of pediatric hospitalizations, 2019 Figure 1 shows total hospital stays and aggregate hospital costs among children in 2019. |
|
Figure 1. Hospital inpatient stays and aggregate hospital costs among children aged 0–17 years by age group, 2019
Source: Agency for Healthcare Research and Quality (AHRQ), Healthcare Cost and Utilization Project (HCUP), National Inpatient Sample (NIS), 2019 Bar chart showing the distribution of total hospital stays and aggregate hospital costs among children aged 0–17 years by age group in 2019. Total hospital stays: 5,199,500. Distribution of stays: Newborns and infants under 1 year = 76.7%. 1–4 years = 6.8%. 5–9 years = 4.5%. 10–14 years = 5.9%. 15–17 years = 6.1%. Aggregate hospital costs: $46.4 billion. Distribution of costs: Newborns and infants under 1 year: 60.5%. 1–4 years = 11.1%. 5–9 years = 8.0%. 10–14 years = 11.0%. 15–17 years = 9.5%.
|
|
|
Table 1 presents characteristics of inpatient hospitalizations among children in 2019.
Table 1. Characteristics of hospital stays among children aged 0–17 years by age group, 2019 |
|||||||||||||||||||||||||||||||||||||||||||||||||||||||||||||||||||||||||||||||||||||||||||||||||||||||||||||||||||||
| |||||||||||||||||||||||||||||||||||||||||||||||||||||||||||||||||||||||||||||||||||||||||||||||||||||||||||||||||||||
The percentage of stays with a primary expected payer of Medicaid decreased with children's age, from 60.6 percent among infants to 50.6 percent among adolescents aged 15–17 years, but the percentage was lowest for neonates (44.7 percent). Conversely, the percentage of stays with private insurance increased with children's age, from 33.2 percent among infants to 42.1 percent among adolescents aged 15–17 years, but the percentage was highest for neonates (46.9 percent). Neonates also had the highest percentage of stays that were expected to be self-pay/no charge (5.4 percent vs. 2.5–3.3 percent for other age groups). The percentage of pediatric stays for females ranged from 42.5 percent among infants under 1 year of age to 60.2 percent among adolescents aged 15–17 years. Except for neonates, approximately half or more of pediatric stays were admitted through the emergency department (ED), ranging from 48.4 percent for adolescents aged 15–17 years to 62.9 percent for children aged 1–4 years. Very few pediatric stays for neonates (1.4 percent) originated in the ED. |
|
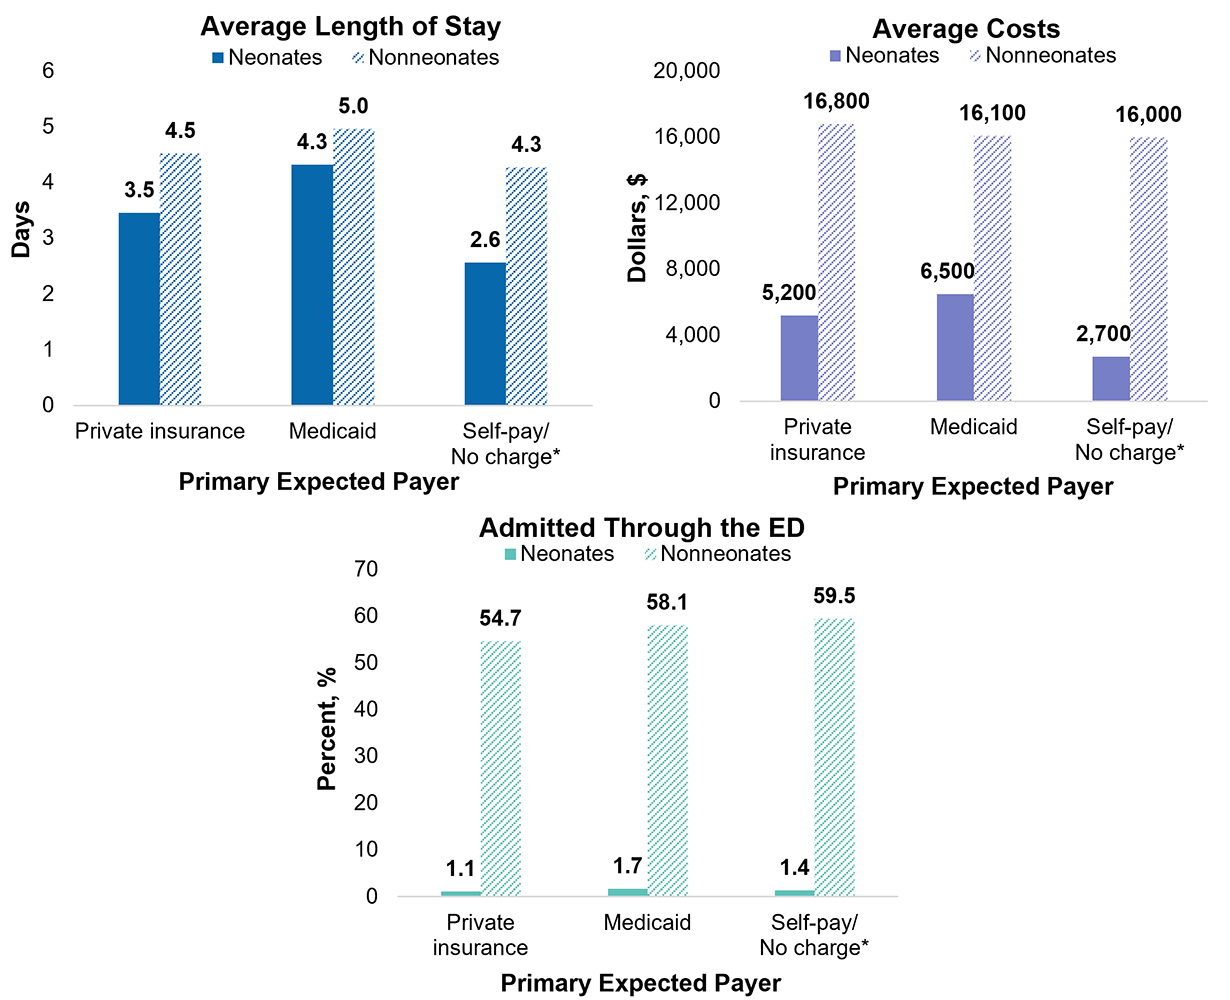
Figure 2 shows characteristics of children's hospital stays by primary expected payer for neonates and nonneonates in 2019. Figure 2. Characteristics of hospital stays among children aged 0–17 years, reported separately for neonates versus nonneonates, by primary expected payer, 2019
Abbreviations: ED, emergency department Three bar charts showing the characteristics (average length of stay, average costs, and percentage admitted through the emergency department) of hospital stays among children aged 0–17 years, for neonates versus nonneonates, in 2019. Data are provided in Supplemental Table 1.
|
|
|
Most common reasons for pediatric hospitalizations, 2019
Table 2 presents the 10 most common principal diagnoses for hospital stays among children in 2019. Table 2. Most common principal diagnoses for hospital stays among children aged 0–17 years by age group, 2019 |
||||||||||||||||||||||||||||||||||||||||||||||||||||||||||||||||||||||||||||||||||||||||||||||||||||||||||||||||||||||||||||||||||||||||||||||||||||||||||||||||||||||||||||||||||||||||||||||||||||||||||||||||||||||||||||||||||||||||||||||||||||||||||||||||||||||||||||||||||||||||||||||||||||||||||||||||||||||||||||||||||||||||||||||||||||||||||||||
| ||||||||||||||||||||||||||||||||||||||||||||||||||||||||||||||||||||||||||||||||||||||||||||||||||||||||||||||||||||||||||||||||||||||||||||||||||||||||||||||||||||||||||||||||||||||||||||||||||||||||||||||||||||||||||||||||||||||||||||||||||||||||||||||||||||||||||||||||||||||||||||||||||||||||||||||||||||||||||||||||||||||||||||||||||||||||||||||
|
State-level characteristics of pediatric hospitalizations, 2019
Table 3 presents the mean length of stay, mean costs, and percentage admitted through the ED among hospital stays for children by the hospital State in 2019. States are ranked from the highest to lowest value on each characteristic. Table 3. State-level characteristics of hospital stays among children aged 0–17 years, 2019 |
||||||||||||||||||||||||||||||||||||||||||||||||||||||||||||||||||||||||||||||||||||||||||||||||||||||||||||||||||||||||||||||||||||||||||||||||||||||||||||||||||||||||||||||||||||||||||||||||||||||||||||||||||||||||||||||||||||||||||||||||||||||||||||||||||||||||||||||||||||||||||||||||||||||||||||||||||||||||||||||||||||||||||||||||||||||||||||||||||||||||||||||||||||||||||||||||||||||||||||||||||||||||||||||
| ||||||||||||||||||||||||||||||||||||||||||||||||||||||||||||||||||||||||||||||||||||||||||||||||||||||||||||||||||||||||||||||||||||||||||||||||||||||||||||||||||||||||||||||||||||||||||||||||||||||||||||||||||||||||||||||||||||||||||||||||||||||||||||||||||||||||||||||||||||||||||||||||||||||||||||||||||||||||||||||||||||||||||||||||||||||||||||||||||||||||||||||||||||||||||||||||||||||||||||||||||||||||||||||
|
References
For this Statistical Brief, when more than one payer is listed for a hospital discharge, the first-listed payer is used. Admissions through the ED Inpatient stays admitted through the ED are identified by the HCUP data element HCUP_ED > 0, which indicates evidence of ED services at the same hospital as the inpatient stay. The assignment of HCUP_ED depends on the reporting of revenue center codes, a Partner-provided flag for ED admissions, or Current Procedural Terminology (CPT®) procedure codes that identify ED professional services. In data year 2019, the SID for Delaware and New Hampshire include limited information that is needed to identify ED admissions, and therefore, the ED admission rates for these two States may be artificially low. About HCUP The Healthcare Cost and Utilization Project (HCUP, pronounced "H-Cup") is a family of healthcare databases and related software tools and products developed through a Federal-State-Industry partnership and sponsored by the Agency for Healthcare Research and Quality (AHRQ). HCUP databases bring together the data collection efforts of State data organizations, hospital associations, and private data organizations (HCUP Partners) and the Federal government to create a national information resource of encounter-level healthcare data. HCUP includes the largest collection of longitudinal hospital care data in the United States, with all-payer, encounter-level information beginning in 1988. These databases enable research on a broad range of health policy issues, including cost and quality of health services, medical practice patterns, access to healthcare programs, and outcomes of treatments at the national, State, and local market levels. HCUP would not be possible without the contributions of the following data collection Partners from across the United States: |
|
Alaska Department of Health Alaska Hospital and Healthcare Association Arizona Department of Health Services Arkansas Department of Health California Department of Health Care Access and Information Colorado Hospital Association Connecticut Hospital Association Delaware Division of Public Health District of Columbia Hospital Association Florida Agency for Health Care Administration Georgia Hospital Association Hawaii Laulima Data Alliance Hawaii University of Hawai'i at Hilo Illinois Department of Public Health Indiana Hospital Association Iowa Hospital Association Kansas Hospital Association Kentucky Cabinet for Health and Family Services Louisiana Department of Health Maine Health Data Organization Maryland Health Services Cost Review Commission Massachusetts Center for Health Information and Analysis Michigan Health & Hospital Association Minnesota Hospital Association Mississippi State Department of Health Missouri Hospital Industry Data Institute |
Montana Hospital Association Nebraska Hospital Association Nevada Department of Health and Human Services New Hampshire Department of Health & Human Services New Jersey Department of Health New Mexico Department of Health New York State Department of Health North Carolina Department of Health and Human Services North Dakota (data provided by the Minnesota Hospital Association) Ohio Hospital Association Oklahoma State Department of Health Oregon Association of Hospitals and Health Systems Oregon Office of Health Analytics Pennsylvania Health Care Cost Containment Council Rhode Island Department of Health South Carolina Revenue and Fiscal Affairs Office South Dakota Association of Healthcare Organizations Tennessee Hospital Association Texas Department of State Health Services Utah Department of Health Vermont Association of Hospitals and Health Systems Virginia Health Information Washington State Department of Health West Virginia Department of Health and Human Resources, West Virginia Health Care Authority Wisconsin Department of Health Services Wyoming Hospital Association |
|
About the NIS
The HCUP National (Nationwide) Inpatient Sample (NIS) is a nationwide database of hospital inpatient stays. The NIS is nationally representative of all community hospitals (i.e., short-term, non-Federal, nonrehabilitation hospitals). The NIS includes all payers. It is drawn from a sampling frame that contains hospitals comprising more than 96 percent of all discharges in the United States. The vast size of the NIS allows the study of topics at the national and regional levels for specific subgroups of patients. In addition, NIS data are standardized across years to facilitate ease of use. Over time, the sampling frame for the NIS has changed; thus, the number of States contributing to the NIS varies from year to year. The NIS is intended for national estimates only; no State-level estimates can be produced. The unweighted sample size for the 2019 NIS is 7,083,805 (weighted, this represents 35,419,023 inpatient stays). About the SID The HCUP State Inpatient Databases (SID) are hospital inpatient databases from data organizations participating in HCUP. The SID contain the universe of the inpatient discharge abstracts in the participating HCUP States, translated into a uniform format to facilitate multistate comparisons and analyses. Together, the SID encompass more than 95 percent of all U.S. community hospital discharges. The SID can be used to investigate questions unique to one State, to compare data from two or more States, to conduct market-area variation analyses, and to identify State-specific trends in inpatient care utilization, access, charges, and outcomes. For More Information For other information on pediatric hospital stays in the United States, refer to the pediatric HCUP Statistical Briefs topic area located at www.hcup-us.ahrq.gov/reports/statbriefs/sbtopic.jsp. For additional HCUP statistics, visit:
For a detailed description of HCUP and more information on the design of the National Inpatient Sample (NIS) and State Inpatient Databases (SID), please refer to the following database documentation: Agency for Healthcare Research and Quality. Overview of the National (Nationwide) Inpatient Sample (NIS). Healthcare Cost and Utilization Project (HCUP). Rockville, MD: Agency for Healthcare Research and Quality. Updated September 2021. www.hcup-us.ahrq.gov/nisoverview.jsp. Accessed March 9, 2022. Agency for Healthcare Research and Quality.Overview of the State Inpatient Databases (SID). Healthcare Cost and Utilization Project (HCUP). Rockville, MD: Agency for Healthcare Research and Quality. Updated September 2021. www.hcup-us.ahrq.gov/sidoverview.jsp. Accessed March 9, 2022. Suggested Citation Weiss AJ (IBM), Liang L (AHRQ), Martin K (AHRQ). Overview of Hospital Stays Among Children and Adolescents, 2019. HCUP Statistical Brief #299. November 2022. Agency for Healthcare Research and Quality, Rockville, MD. www.hcup-us.ahrq.gov/reports/statbriefs/sb299-Hospital-Stays-Children-2019.pdf. Acknowledgments The authors would like to acknowledge the contributions of Marguerite Barrett of M.L. Barrett, Inc., and Minya Sheng of IBM. *** AHRQ welcomes questions and comments from readers of this publication who are interested in obtaining more information about access, cost, use, financing, and quality of healthcare in the United States. We also invite you to tell us how you are using this Statistical Brief and other HCUP data and tools, and to share suggestions on how HCUP products might be enhanced to further meet your needs. Please email us at hcup@ahrq.gov or send a letter to the address below:Joel W. Cohen, Ph.D., Director Center for Financing, Access and Cost Trends Agency for Healthcare Research and Quality 5600 Fishers Lane Rockville, MD 20857 This Statistical Brief was posted online on November 29, 2022. a Agency for Healthcare Research and Quality. Clinical Classifications Software Refined (CCSR) for ICD-10-CM Diagnoses. Healthcare Cost and Utilization Project (HCUP). Agency for Healthcare Research and Quality. Updated February 2022. www.hcup-us.ahrq.gov/toolssoftware/ccsr/dxccsr.jsp. Accessed March 9, 2022. b Agency for Healthcare Research and Quality. Cost-to-Charge Ratio Files. Healthcare Cost and Utilization Project (HCUP). Agency for Healthcare Research and Quality. Updated November 2021. www.hcup-us.ahrq.gov/db/state/costtocharge.jsp. Accessed March 9, 2022. c For additional information about the NHEA, see Centers for Medicare & Medicaid Services (CMS). National Health Expenditure Data. CMS website. Updated December 1, 2021. www.cms.gov/Research-Statistics-Data-and-Systems/Statistics-Trends-and-Reports/NationalHealthExpendData/index.html?redirect=/NationalHealthExpendData/. Accessed March 9, 2022. d American Hospital Association. TrendWatch Chartbook, 2020. Appendix 1: Supplementary Data Tables, Trends in the Overall Health Care Market. Table 4.2: Distribution of Inpatient vs. Outpatient Revenues, 1995–2018. www.aha.org/system/files/media/file/2020/10/TrendwatchChartbook-2020-Appendix.pdf. Accessed March 9, 2022. |
| Supplemental Table 1. Characteristics of hospital stays among children aged 0–17 years, reported separately for neonates versus nonneonates, by primary expected payer, 2019, for data presented in Figure 2 | |||
| Characteristic | Private insurance | Medicaid | Self-pay/No charge* |
|---|---|---|---|
| Length of stay, days | – | – | – |
| Neonates | 3.5 | 4.3 | 2.6 |
| Nonneonates | 4.5 | 5.0 | 4.3 |
| Average costs, $ | – | – | – |
| Neonates | 5,200 | 6,500 | 2,700 |
| Nonneonates | 16,800 | 16,100 | 16,000 |
| Admitted through the emergency department, % | – | – | – |
| Neonates | 1.1 | 1.7 | 1.4 |
| Nonneonates | 54.7 | 58.1 | 59.5 |
| Internet Citation: Statistical Brief #299. Healthcare Cost and Utilization Project (HCUP). November 2022. Agency for Healthcare Research and Quality, Rockville, MD. hcup-us.ahrq.gov/reports/statbriefs/sb299-Hospital-Stays-Children-2019.jsp. |
| Are you having problems viewing or printing pages on this website? |
| If you have comments, suggestions, and/or questions, please contact hcup@ahrq.gov. |
| If you are experiencing issues related to Section 508 accessibility of information on this website, please contact hcup@ahrq.gov. |
| Privacy Notice, Viewers & Players |
| Last modified 11/28/22 |