HEALTHCARE COST & UTILIZATION PROJECT

User Support

Do Your own analysis
Explore Expert Research & Limited Datasets

Geographic Variation in Inpatient Stays for Five Leading Mental Disorders, 2016-2018

STATISTICAL BRIEF #288
February 2022

Kathryn R. Fingar, Ph.D., M.P.H., and Marc Roemer, M.S.


Introduction

In 2019, approximately one in five adults in the United States reported having some type of mental illness in the past year, and 16 percent of these adults received mental health services.1 Mental disorders are a leading reason for hospitalization in the United States.2 Depressive disorders and schizophrenia rank in the top 20 principal diagnoses for inpatient stays.2,3

Rates of inpatient stays for mental disorders reflect many factors, including the prevalence of mental disorders in the community, the availability of treatment options, as well as access to treatment. Inpatient stays for mental disorders are especially important to track at the substate level to inform inpatient and outpatient resource allocation based on the needs of the community. Statistics from 2016-2018 provide a baseline from which to examine changes in inpatient utilization for mental disorders that have occurred since the beginning of the COVID-19 pandemic in 2020.4

This Healthcare Cost and Utilization Project (HCUP) Statistical Brief presents 3-year aggregate statistics on national, State, and substate regional variation in inpatient stays for mental disorders among patients of all ages at community hospitals (excluding rehabilitation and long-term care hospitals) based on the 2016-2018 National Inpatient Sample (NIS) and the 2016-2018 State Inpatient Databases (SID). Geographic areas are based on the patient ZIP Code of residence. This Statistical Brief focuses on the five leading mental disorder principal diagnoses for inpatient stays in the United States: depressive disorders, schizophrenia spectrum and other psychotic disorders, bipolar and related disorders, suicidal ideation or attempt and intentional self-harm, and trauma- and stressor-related disorders. Statistics are presented for 38 States that, at the time this Statistical Brief was written, had released aggregate 2016-2018 data through the Community-Level Statistics path of HCUPnet, an online query tool for county- and substate region-level statistics.2 These States represented 80 percent of the U.S. population in 2018. Because of the large sample size of the NIS and SID data, small differences can be statistically significant but not clinically important. Thus, only differences greater than or equal to 10 percent are discussed in the text.

Findings

State variation in the rate of inpatient stays for mental disorders, 2016-2018
Figure 1 illustrates the distribution (i.e., minimum and maximum values as well as the 25th and 75th percentiles) of population rates of the five leading mental disorder reasons (i.e., principal diagnosis) for inpatient stays across the 38 States included in this Statistical Brief. The national rate also is presented.
Highlights

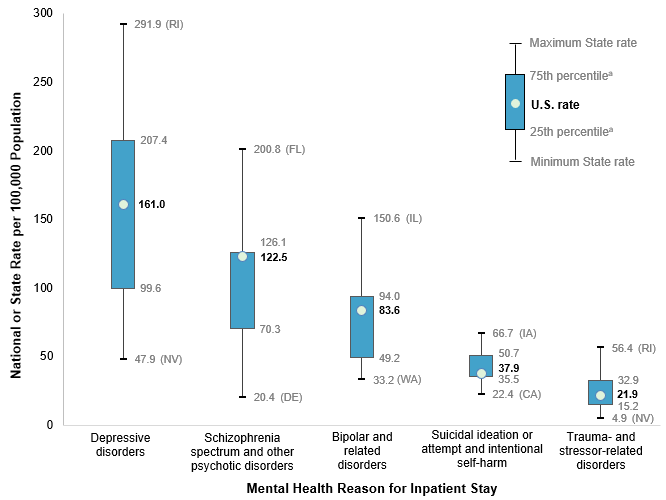
Figure 1. Variation in State rate (per 100,000 population) of leading mental disorder principal diagnoses for inpatient stays, 2016-2018


Figure 1 is box and whisker plot showing the distribution (i.e., minimum and maximum values as well as the 25th and 75th percentiles) of population rates of the five leading mental disorder reasons for inpatient stays across 38 States as well as the national rate.

a The 25th and 75th percentiles are based on the distribution of rates across the 38 States that participate in the HCUPnet Community-Level Statistics path. The U.S. rate is a national weighted estimate from the Healthcare Cost and Utilization Project (HCUP) National Inpatient Sample (NIS).
Source: Agency for Healthcare Research and Quality (AHRQ), Healthcare Cost and Utilization Project (HCUP), 2016-2018 National Inpatient Sample (NIS) and 2016-2018 State Inpatient Databases (SID) for 38 States that, at the time this Statistical Brief was written, had released aggregate 2016-2018 data through the Community-Level Statistics path on HCUPnet, an online query tool

Box and whisker plot showing the distribution (i.e., minimum and maximum values as well as the 25th and 75th percentiles) of population rates of the five leading mental disorder reasons for inpatient stays across 38 States as well as the national rate. Depressive disorders: minimum State rate, 47.9 (NV); 25th percentile, 99.6; U.S. rate, 161.0; 75th percentile, 207.4; maximum State rate, 291.9 (RI). Schizophrenia spectrum and other psychotic disorders: minimum State rate, 20.4 (DE); 25th percentile, 70.3; U.S. rate, 122.5; 75th percentile, 126.1; maximum State rate, 200.8 (FL). Bipolar and related disorders: minimum State rate, 33.2 (WA); 25th percentile, 49.2; U.S. rate, 83.6; 75th percentile, 94.0; maximum State rate, 150.6 (IL). Suicidal ideation or attempt and intentional self-harm: minimum State rate, 22.4 (CA); 25th percentile, 35.5; U.S. rate, 37.9; 75th percentile, 50.7; maximum State rate, 66.7 (IA). Trauma- and stressor-related disorders: minimum State rate, 4.9 (NV); 25th percentile, 15.2; U.S. rate, 21.9; 75th percentile, 32.9; maximum State rate, 56.4 (RI).


Table 1. Rate of inpatient stays per 100,000 population of the top five mental disorder principal diagnoses and State rank, 2016-2018
State Depressive disorders Schizophrenia spectrum and other psychotic disorders Bipolar and related disorders Suicidal ideation or attempt and intentional self-harm Trauma- and stressor-related disorders
Rate State rank Rate State rank Rate State rank Rate State rank Rate State rank
United States 161.0 122.5 83.6 37.9 21.9
Alaska 137.2 27 66.3 31 41.6 35 61.8 4 33.0 10
Arizona 63.7 36 58.7 32 47.1 30 36.8 27 13.1 30
Arkansas 196.7 13 143.2 6 79.8 19 63.1 3 34.7 8
California 70.3 34 147.5 4 43.1 34 22.4 38 7.7 37
Colorado 80.7 32 42.7 37 35.9 37 40.7 20 19.3 22
Delaware 67.0 35 20.4 38 37.4 36 35.4 29 7.9 36
Florida 197.0 12 200.8 1 109.1 8 41.4 18 32.3 11
Georgia 87.3 31 95.0 21 51.8 27 31.5 33 11.0 32
Hawaii 97.4 29 91.9 23 49.3 28 24.8 37 29.9 13
Illinois 235.5 6 173.2 2 150.6 1 39.9 24 15.7 28
Indiana 232.8 7 99.9 18 84.4 16 40.6 21 18.3 24
Iowa 242.9 4 95.4 20 87.5 14 66.7 1 37.2 7
Kentucky 208.9 10 96.4 19 70.0 22 43.9 17 30.7 12
Louisiana 175.4 21 139.9 7 92.3 13 32.7 32 20.8 20
Maryland 190.0 16 126.6 10 128.8 4 25.0 36 22.6 19
Massachusetts 178.6 20 105.5 15 93.6 11 39.8 25 38.8 5
Michigan 146.7 26 92.1 22 87.5 15 45.2 16 15.1 29
Minnesota 242.9 5 124.5 11 84.4 17 58.6 6 45.5 3
Mississippi 184.2 18 134.6 8 66.5 24 35.7 28 54.4 2
Montana 202.8 11 83.6 24 84.3 18 64.2 2 43.9 4
Nebraska 276.9 2 128.1 9 140.4 2 45.7 15 34.5 9
Nevada 47.9 38 104.2 17 68.7 23 40.3 22 4.9 38
New Jersey 175.2 22 145.8 5 121.7 6 28.4 35 19.2 23
New Mexico 179.8 19 105.1 16 92.5 12 48.3 14 18.1 25
North Carolina 196.4 14 110.7 14 94.2 10 32.7 31 24.0 16
North Dakota 193.2 15 68.7 29 65.2 25 50.1 11 38.0 6
Oklahoma 147.3 25 80.0 27 71.0 21 60.9 5 11.5 31
Oregon 77.7 33 82.0 25 49.1 29 52.7 8 16.3 27
Pennsylvania 215.3 9 121.0 12 117.2 7 41.0 19 27.7 15
Rhode Island 291.9 1 168.5 3 127.6 5 49.5 12 56.4 1
South Carolina 106.2 28 75.2 28 46.0 31 38.7 26 22.8 17
Tennessee 188.9 17 81.8 26 98.7 9 39.9 23 16.7 26
Texas 93.4 30 55.5 35 45.0 32 31.3 34 9.7 34
Utah 229.7 8 68.3 30 74.2 20 50.9 10 10.1 33
Washington 55.2 37 55.7 34 33.2 38 33.7 30 9.7 35
West Virginia 270.8 3 119.9 13 139.7 3 51.3 9 22.8 18
Wisconsin 167.4 23 56.5 33 58.1 26 49.0 13 20.6 21
Wyoming 147.8 24 43.1 36 45.0 33 56.7 7 29.4 14
Notes: Rates are per 100,000 population. The U.S. rate is a national weighted estimate from the Healthcare Cost and Utilization Project (HCUP) National Inpatient Sample (NIS).
Source: Agency for Healthcare Research and Quality (AHRQ), Healthcare Cost and Utilization Project (HCUP), 2016-2018 National Inpatient Sample (NIS) and 2016-2018 State Inpatient Databases (SID) for 38 States that, at the time this Statistical Brief was written, had released aggregate 2016-2018 data through the Community-Level Statistics path on HCUPnet, an online query tool

  • Nebraska and Rhode Island had among the highest rates for four of the five leading mental disorder reasons for inpatient stays.

    In Nebraska and Rhode Island, rates of four of the five leading mental disorder reasons for inpatient stays were above the 75th percentile (as shown in Figure 1). In these two States, respectively, rates of inpatient stays per 100,000 population were:
    • 276.9 and 291.9 for depressive disorders
    • 128.1 and 168.5 for schizophrenia spectrum and other psychotic disorders
    • 140.4 and 127.6 for bipolar and related disorders
    • 34.5 and 56.4 for trauma- and stressor-related disorders


  • Delaware, Texas, and Washington had among the lowest rates for each of the five leading mental disorder reasons for inpatient stays.

    In Delaware, Texas, and Washington, rates of each of the five leading mental disorder reasons for inpatient stays fell below the 25th percentile (as shown in Figure 1). In these States, rates of inpatient stays per 100,000 population were:
    • 55.2-93.4 for depressive disorders
    • 20.4-55.7 for schizophrenia spectrum and other psychotic disorders
    • 33.2-45.0 for bipolar and related disorders
    • 31.3-35.4 for suicidal ideation or attempt and intentional self-harm
    • 7.9-9.7 for trauma- and stressor-related disorders


  • In most States, inpatient stays for depressive disorders were most common, with some exceptions.

    In contrast with most other States, where depressive disorders were by far the top inpatient mental disorder diagnosis, in California and Nevada the leading reason for mental disorder stays was schizophrenia spectrum and other psychotic disorders. In these States, respectively, the rates of stays for schizophrenia (147.5 and 104.2 per 100,000 population) were more than twice as high as the rates of stays for depression (70.3 and 47.9).
Substate region variation in leading reasons for inpatient stays for mental disorders, 2016-2018
Figures 2 through 6 display rates of the five most common mental disorder reasons for inpatient stays by substate region. The rates are categorized into quintiles based on the distribution of unsuppressed rates across all regions in the 38 States included in this Statistical Brief. Within these States, there are 255 substate regions identified by Community-Level Statistics. Hot spots were defined as regions with rates in the highest quintile (quintile 5).

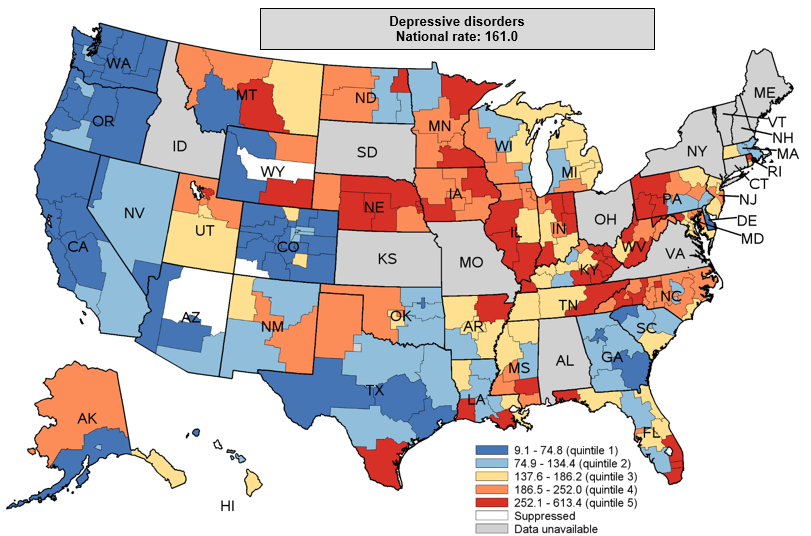
Figure 2. Rate of inpatient stays with a principal diagnosis of depressive disorders per 100,000 population, by substate region, 2016-2018


Figure 2 is a color-coded map of the United States that shows substate region-level rates per 100,000 population for inpatient stays with a principal diagnosis of depressive disorders in 2016 to 2018 for 38 States.

Note: Data for Hawaii and Delaware are at the county level, not the substate region level. The quintiles are based on the distribution of unsuppressed rates across the 38 States that participate in the HCUPnet Community-Level Statistics path. The U.S. rate is a national weighted estimate from the Healthcare Cost and Utilization Project (HCUP) National Inpatient Sample (NIS).
Source: Agency for Healthcare Research and Quality (AHRQ), Healthcare Cost and Utilization Project (HCUP), 2016-2018 National Inpatient Sample (NIS) and 2016-2018 State Inpatient Databases (SID) for 38 States that, at the time this Statistical Brief was written, had released aggregate 2016-2018 data through the Community-Level Statistics path on HCUPnet, an online query tool.

Color-coded map of the United States that shows substate region-level rates per 100,000 population for inpatient stays with a principal diagnosis of depressive disorders in 2016 to 2018 for 38 States, by rate quintile (quintile 1: 9.1-74.8; quintile 2: 74.9-134.4; quintile 3: 137.6-186.2; quintile 4: 186.5-252.0; quintile 5: 252.1-613.4). National rate: 161.0.


  • Hot spots of inpatient stays for depressive disorders included substate regions scattered across the Midwest, Appalachia, and the southernmost parts of the South.

    Of the 38 States included in this Statistical Brief, 21 had a region with a rate of inpatient stays for depressive disorders at or above 252.1 per 100,000 population (in the highest quintile). The rate ranged from 9.1 in western Arizona to 613.4 in southeastern Kentucky.

    Hot spots of inpatient stays for depressive disorders were scattered primarily across States in the Midwest, including Illinois, Indiana, Iowa, Minnesota, Nebraska, and North Dakota. Hot spots also occurred in with Appalachia,a covering parts of Kentucky, Maryland, North Carolina, Pennsylvania, Tennessee, and West Virginia, and were in the southernmost substate regions of States located in the South, including Florida, Louisiana, Mississippi, and Texas. From west to east, other isolated hot spots included central Montana, southeastern Wyoming, northeastern Arkansas, and northern Rhode Island.

    In six States—four in the West—all substate regions had rates of inpatient stays for depressive disorders in the lowest two quintiles: California, Delaware, Georgia, Nevada, Oregon, and Washington.

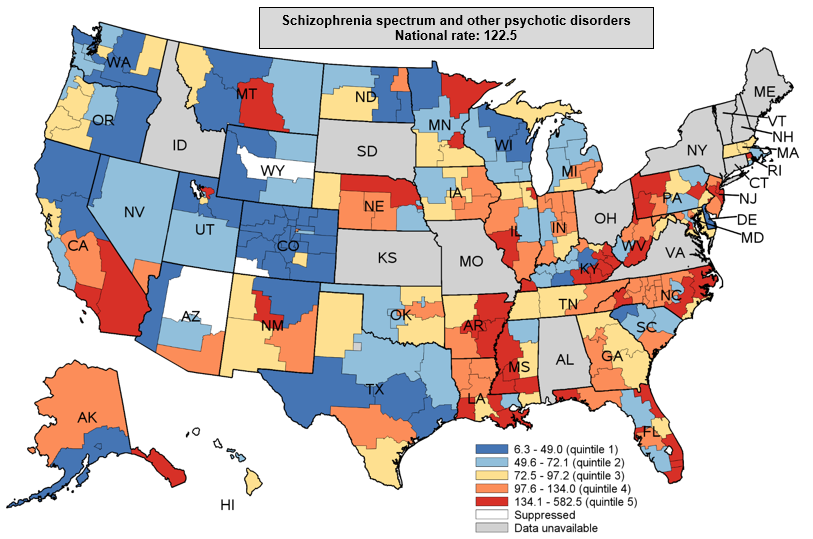
Figure 3. Rate of inpatient stays with a principal diagnosis of schizophrenia spectrum and other psychotic disorders per 100,000 population, by substate region, 2016-2018


Figure 3 is color-coded map of the United States that shows substate region-level rates per 100,000 population for inpatient stays with a principal diagnosis of schizophrenia spectrum and other psychotic disorders in 2016 to 2018 for 38 States.

Note: Data for Hawaii and Delaware are at the county level, not the substate region level. The quintiles are based on the distribution of unsuppressed rates across the 38 States that participate in the HCUPnet Community-Level Statistics path. The U.S. rate is a national weighted estimate from the Healthcare Cost and Utilization Project (HCUP) National Inpatient Sample (NIS).
Source: Agency for Healthcare Research and Quality (AHRQ), Healthcare Cost and Utilization Project (HCUP), 2016-2018 National Inpatient Sample (NIS) and 2016-2018 State Inpatient Databases (SID) for 38 States that, at the time this Statistical Brief was written, had released aggregate 2016-2018 data through the Community-Level Statistics path on HCUPnet, an online query tool.

Color-coded map of the United States that shows substate region-level rates per 100,000 population for inpatient stays with a principal diagnosis of schizophrenia spectrum and other psychotic disorders in 2016 to 2018 for 38 States, by rate quintile (quintile 1: 6.3-49.0; quintile 2: 49.6-72.1; quintile 3: 72.5-97.2; quintile 4: 97.6-134.0; quintile 5: 134.1-582.5). National rate: 122.5.


  • Hot spots of inpatient stays for schizophrenia spectrum and other psychotic disorders occurred in parts of Appalachia, Arkansas, Louisiana, Mississippi, and southern California.

    Of the 38 included States, 19 had a region with a rate of inpatient stays for schizophrenia spectrum and other psychotic disorders at or above 134.1 per 100,000 population (in the highest quintile). The rate ranged from 6.3 in southwestern Colorado to 582.5 in the southernmost part of Florida.

    Hot spots of inpatient stays for schizophrenia spectrum and other psychotic disorders were in regions of Arkansas, Louisiana, and Mississippi, along the Mississippi River. Hot spots also occurred in Appalachia, covering parts of Kentucky, North Carolina, Pennsylvania, and West Virginia, as well as southern California.

    From west to east, other isolated hot spots of inpatient stays for schizophrenia spectrum and other psychotic disorders included the Alaska panhandle, the Salt Lake City area of Utah, central Montana, central New Mexico, northern Nebraska, central and northeastern Minnesota, various parts of Florida (the panhandle, central western, northeastern, and southeastern), central Maryland (the counties of Baltimore City and Prince George's), central New Jersey, and northern Rhode Island.

    All regions in Wisconsin had rates of inpatient stays for schizophrenia spectrum and other psychotic disorders in the lowest two quintiles.

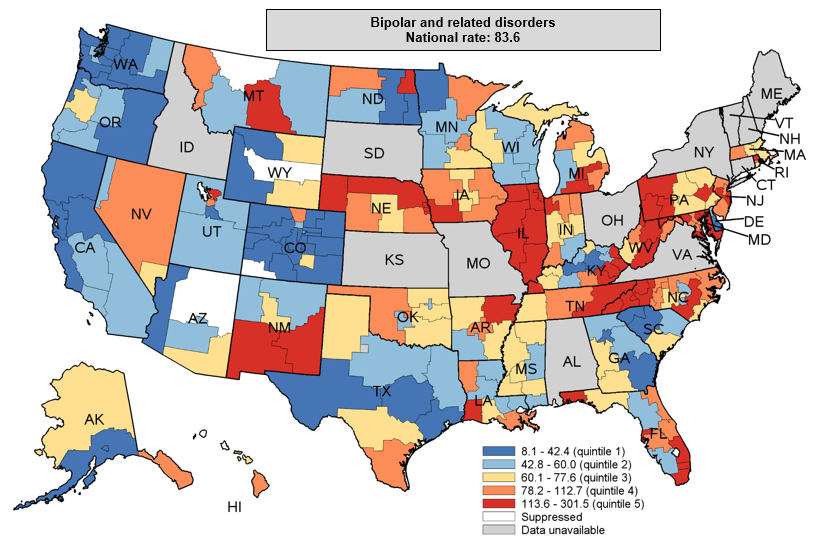
Figure 4. Rate of inpatient stays with a principal diagnosis of bipolar and related disorders per 100,000 population, by substate region, 2016-2018


Figure 4 is Color-coded map of the United States that shows substate region-level rates per 100,000 population for inpatient stays with a principal diagnosis of bipolar and related disorders in 2016 to 2018 for 38 States.

Note: Data for Hawaii and Delaware are at the county level, not the substate region level. The quintiles are based on the distribution of unsuppressed rates across the 38 States that participate in the HCUPnet Community-Level Statistics path. The U.S. rate is a national weighted estimate from the Healthcare Cost and Utilization Project (HCUP) National Inpatient Sample (NIS).
Source: Agency for Healthcare Research and Quality (AHRQ), Healthcare Cost and Utilization Project (HCUP), 2016-2018 National Inpatient Sample (NIS) and 2016-2018 State Inpatient Databases (SID) for 38 States that, at the time this Statistical Brief was written, had released aggregate 2016-2018 data through the Community-Level Statistics path on HCUPnet, an online query tool.

Color-coded map of the United States that shows substate region-level rates per 100,000 population for inpatient stays with a principal diagnosis of bipolar and related disorders in 2016 to 2018 for 38 States, by rate quintile (quintile 1: 8.1-42.4; quintile 2: 42.8-60.0; quintile 3: 60.1-77.6; quintile 4: 78.2-112.7; quintile 5: 113.6-301.5). National rate: 83.6.


  • All regions in Illinois were classified as hot spots of inpatient stays for bipolar and related disorders.

    Of the 38 included States, 20 had a region with a rate of inpatient stays for bipolar and related disorders at or above 113.6 per 100,000 population (in the highest quintile). The rate ranged from 8.1 in central Colorado to 301.5 in the northernmost part of West Virginia.

    All regions in Illinois were classified as hot spots of inpatient stays for bipolar and related disorders. Hot spots also occurred in Appalachia, covering parts of Kentucky, Maryland, North Carolina, Pennsylvania, Tennessee, and West Virginia.

    From west to east, other isolated hot spots of inpatient stays for bipolar and related disorders included the Salt Lake City area of Utah, central Montana, southern New Mexico, northeast North Dakota, northern Nebraska, southwest Iowa, southwest Louisiana, northeast Arkansas, northwest Indiana, central southern Michigan, various parts of Florida (the panhandle, central western, and southeast), central New Jersey, and northern Rhode Island.

    In two States in the West (California and Washington) and in Delaware, all substate regions had rates of inpatient stays for bipolar and related disorders in the lowest two quintiles.

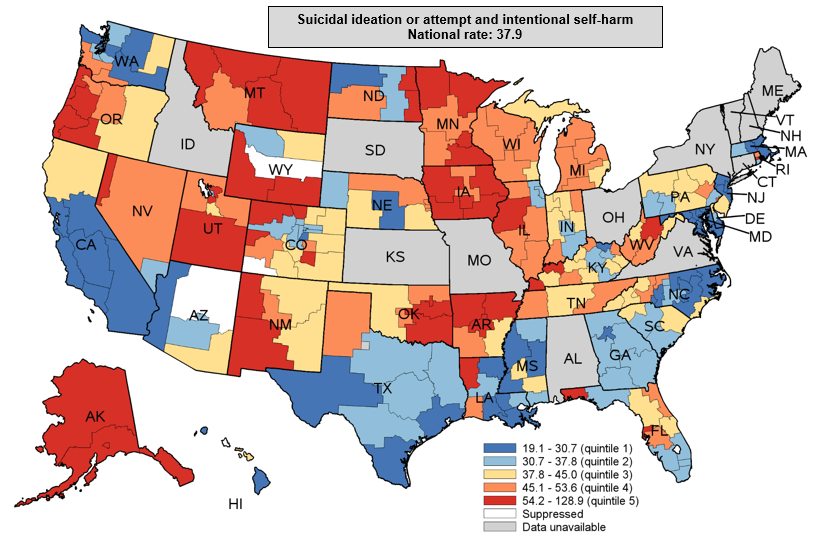
Figure 5. Rate of inpatient stays with a principal diagnosis of suicidal ideation or attempt and intentional self-harm per 100,000 population, by substate region, 2016-2018


Figure 5 is color-coded map of the United States that shows substate region-level rates per 100,000 population for inpatient stays with a principal diagnosis of suicidal ideation or attempt and intentional self-harm in 2016 to 2018 for 38 States.

Note: Data for Hawaii and Delaware are at the county level, not the substate region level. The quintiles are based on the distribution of unsuppressed rates across the 38 States that participate in the HCUPnet Community-Level Statistics path. The U.S. rate is a national weighted estimate from the Healthcare Cost and Utilization Project (HCUP) National Inpatient Sample (NIS).
Source: Agency for Healthcare Research and Quality (AHRQ), Healthcare Cost and Utilization Project (HCUP), 2016-2018 National Inpatient Sample (NIS) and 2016-2018 State Inpatient Databases (SID) for 38 States that, at the time this Statistical Brief was written, had released aggregate 2016-2018 data through the Community-Level Statistics path on HCUPnet, an online query tool.

Color-coded map of the United States that shows substate region-level rates per 100,000 population for inpatient stays with a principal diagnosis of suicidal ideation or attempt and intentional self-harm in 2016 to 2018 for 38 States, by rate quintile (quintile 1: 19.1-30.7; quintile 2: 30.7-37.8; quintile 3: 37.8-45.0; quintile 4: 45.1-53.6; quintile 5: 54.2-128.9). National rate: 37.9.


  • All regions in Alaska were classified as hot spots of inpatient stays for suicidal ideation or attempt and intentional self-harm.

    Of the 38 included States, 19 had a region with a rate of inpatient stays for suicidal ideation or attempt and intentional self-harm at or above 54.2 per 100,000 population (in the highest quintile). The rate ranged from 19.1 in the San Francisco Bay area of California to 128.9 in central western Colorado.

    All regions in Alaska were classified as hot spots of inpatient stays for suicidal ideation or attempt and intentional self-harm. Multiple regions classified as hot spots also were located in States across the midwestern, southern, and western parts of the United States: Arkansas, Colorado, Florida, Kentucky, Iowa, Minnesota, Montana, New Mexico, North Dakota, Oklahoma, Oregon, Utah, and Wyoming. From west to east, other isolated hot spots were in northwestern Nevada, northwestern Louisiana, northwestern Illinois, northeastern West Virginia, and central Rhode Island.

    In three States along the eastern seaboard (Georgia, Maryland, and Massachusetts), all substate regions had rates of inpatient stays for suicidal ideation or attempt and intentional self-harm in the lowest two quintiles. In California, Delaware, New Jersey, and Texas, all but one substate region had a rate in the lowest two quintiles.

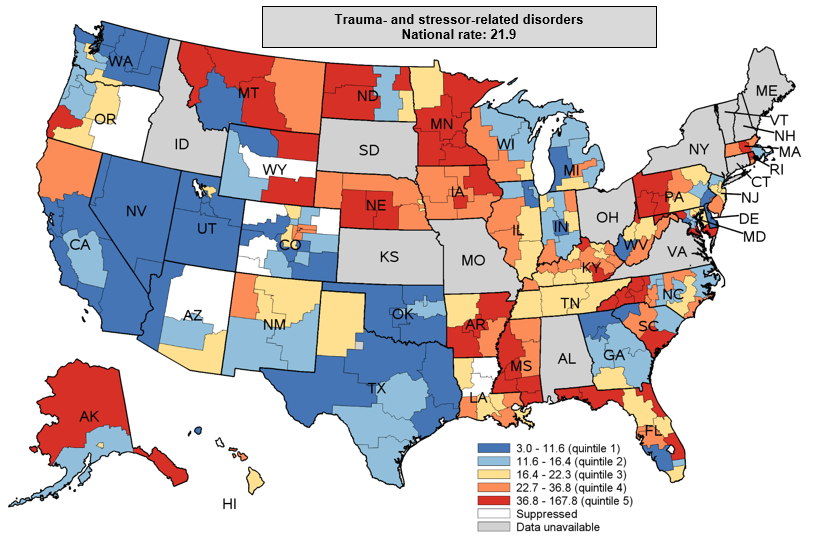
Figure 6. Rate of inpatient stays with a principal diagnosis of trauma- and stressor-related disorders per 100,000 population, by substate region, 2016-2018


Figure 6 is a color-coded map of the United States that shows substate region-level rates per 100,000 population for inpatient stays with a principal diagnosis of trauma- and stressor-related disorders in 2016 to 2018 for 38 States.

Note: Data for Hawaii and Delaware are at the county level, not the substate region level. The quintiles are based on the distribution of unsuppressed rates across the 38 States that participate in the HCUPnet Community-Level Statistics path. The U.S. rate is a national weighted estimate from the Healthcare Cost and Utilization Project (HCUP) National Inpatient Sample (NIS).
Source: Agency for Healthcare Research and Quality (AHRQ), Healthcare Cost and Utilization Project (HCUP), 2016-2018 National Inpatient Sample (NIS) and 2016-2018 State Inpatient Databases (SID) for 38 States that, at the time this Statistical Brief was written, had released aggregate 2016-2018 data through the Community-Level Statistics path on HCUPnet, an online query tool.

Color-coded map of the United States that shows substate region-level rates per 100,000 population for inpatient stays with a principal diagnosis of trauma- and stressor-related disorders in 2016 to 2018 for 38 States, by rate quintile (quintile 1: 3.0-11.6; quintile 2: 11.6-16.4; quintile 3: 16.4-22.3; quintile 4: 22.7-36.8; quintile 5: 36.8-167.8). National rate: 21.9.


  • All but one region in Minnesota and all but two regions in Alaska, Arkansas, Mississippi, Montana, and North Dakota were hot spots of inpatient stays for trauma- and stressor-related disorders.

    Of the 38 included States, 19 had a region with a rate of inpatient stays for trauma- and stressor-related disorders at or above 36.8 per 100,000 population (in the highest quintile). The rate ranged from 3.0 in northwestern Colorado to 167.8 in the westernmost part of the panhandle in Florida.

    Multiple regions classified as hot spots of inpatient stays for trauma- and stressor-related disorders were located in Alaska, Arkansas, Florida, Iowa, Kentucky, Maryland, Minnesota, Mississippi, Montana, Nebraska, North Carolina, North Dakota, Pennsylvania, Rhode Island, and Wyoming. From west to east, other isolated hot spots were in southwestern Oregon, northern West Virginia, southern South Carolina, and central Massachusetts.

    In three States (Delaware, Nevada, and Oklahoma), all regions had rates of inpatient stays for trauma- and stressor-related disorders in the lowest two quintiles.
References

1 Substance Abuse and Mental Health Services Administration, Center for Behavioral Health Statistics and Quality. Key Substance Use and Mental Health Indicators in the United States: Results from the 2019 National Survey on Drug Use and Health. HHS Publication No. PEP20-07-01-001, NSDUH Series H-55. 2020. www.store.samhsa.gov/sites/default/files/SAMHSA_Digital_Download/PEP20-07-01-001-PDF.pdf. Accessed October 11, 2021.
2 Agency for Healthcare Research and Quality. HCUPnet website. datatools.ahrq.gov/hcupnet. Accessed October 11, 2021.
3 McDermott KW, Roemer M. Most Frequent Principal Diagnoses for Inpatient Stays in U.S. Hospitals, 2018. HCUP Statistical Brief #277. July, 2021. Agency for Healthcare Research and Quality, Rockville, MD. www.hcup-us.ahrq.gov/reports/statbriefs/sb277-Top-Reasons-Hospital-Stays-2018.pdf. Accessed December 8, 2021.
4 COVID-19 Mental Disorders Collaborators. Global prevalence and burden of depressive and anxiety disorders in 204 countries and territories in 2020 due to the COVID-19 pandemic. Lancet. 2021;398(10312):1700-12.

About Statistical Briefs

Healthcare Cost and Utilization Project (HCUP) Statistical Briefs provide basic descriptive statistics on a variety of topics using HCUP administrative healthcare data. Topics include hospital inpatient, ambulatory surgery, and emergency department use and costs, quality of care, access to care, medical conditions, procedures, and patient populations, among other topics. The reports are intended to generate hypotheses that can be further explored in other research; the reports are not designed to answer in-depth research questions using multivariate methods.

Data Source

The State and substate estimates in this Statistical Brief are based upon data from the HCUP 2016-2018 State Inpatient Databases (SID) for 38 States that, at the time this Statistical Brief was written, had released aggregate 2016-2018 data through the Community-Level Statistics (CLS) path of HCUPnet, an online query tool. National estimates come from the HCUP 2016-2018 National Inpatient Sample (NIS). The States included in this Statistical Brief were Alaska, Arizona, Arkansas, California, Colorado, Delaware, Florida, Georgia, Hawaii, Illinois, Indiana, Iowa, Kentucky, Louisiana, Maryland, Massachusetts, Michigan, Minnesota, Mississippi, Montana, Nebraska, Nevada, New Jersey, New Mexico, North Carolina, North Dakota, Oklahoma, Oregon, Pennsylvania, Rhode Island, South Carolina, Tennessee, Texas, Utah, Washington, West Virginia, Wisconsin, and Wyoming.

Substate regions were created from definitions provided by the HCUP Partner, if available, or by a regionalization scheme developed by the Substance Abuse and Mental Health Services Administration.b Delaware and Hawaii do not release region-level data, so statistics for these States are presented at the county level. In CLS, statistics are suppressed if the reporting cell draws from fewer than two hospitals or contains fewer than 11 discharges or because the county was missing 2 percent or more of total discharges in the HCUP SID when compared with the Medicare Hospital Service Area File.

Supplemental sources included population denominator data for use with HCUP databases, derived from information available from Claritas, a vendor that produces population estimates and projections based on data from the U.S. Census Bureau.c

Definitions

Diagnoses, ICD-10-CM, and Clinical Classifications Software Refined (CCSR) for ICD-10-CM Diagnoses
The principal diagnosis is that condition established after study to be chiefly responsible for the patient's admission to the hospital. Secondary diagnoses are conditions that coexist at the time of admission that require or affect patient care treatment received or management, or that develop during the inpatient stay.

ICD-10-CM is the International Classification of Diseases, Tenth Revision, Clinical Modification. There are over 70,000 ICD-10-CM diagnosis codes.

The CCSR aggregates ICD-10-CM diagnosis codes into a manageable number of clinically meaningful categories.d The CCSR is intended to be used analytically to examine patterns of healthcare in terms of cost, utilization, and outcomes; rank utilization by diagnoses; and risk-adjust by clinical condition. The CCSR capitalizes on the specificity of the ICD-10-CM coding scheme and allows ICD-10-CM codes to be classified in more than one category. Approximately 10 percent of diagnosis codes are associated with more than one CCSR category because the diagnosis code documents either multiple conditions or a condition along with a common symptom or manifestation. For this Statistical Brief, the principal diagnosis code is assigned to a single default CCSR based on clinical coding guidelines, etiology and pathology of diseases, and standards set by other Federal agencies. The assignment of the default CCSR for the principal diagnosis is available starting with version v2020.2 of the software tool. ICD-10-CM coding definitions for each CCSR category presented in this Statistical Brief can be found in the CCSR reference file, available at www.hcup-us.ahrq.gov/toolssoftware/ccsr/ccs_refined.jsp#download. For this Statistical Brief, v2021.1 of the CCSR was used for 2016 data and v2021.2 was used for 2017 and 2018 data.

Case definition
The CCSR categories defining mental disorders for this Statistical Brief are based on the principal diagnosis and include:
  • MBD001: Schizophrenia spectrum and other psychotic disorders
  • MBD002: Depressive disorders
  • MBD003: Bipolar and related disorders
  • MBD007: Trauma- and stressor-related disorders
  • MBD012: Suicidal ideation or attempt and intentional self-harm

Types of hospitals included in the HCUP National (Nationwide) Inpatient Sample
The National (Nationwide) Inpatient Sample (NIS) is based on data from community hospitals, which are defined as short-term, non-Federal, general, and other hospitals, excluding hospital units of other institutions (e.g., prisons). The NIS includes obstetrics and gynecology, otolaryngology, orthopedic, cancer, pediatric, public, and academic medical center hospitals. Excluded are long-term care facilities such as rehabilitation, psychiatric, and alcoholism and chemical dependency hospitals. Beginning in 2012, long-term acute care hospitals are also excluded. However, if a patient received long-term care, rehabilitation, or treatment for a psychiatric or chemical dependency condition in a community hospital, the discharge record for that stay will be included in the NIS.

Types of hospitals included in HCUP State Inpatient Databases
This analysis used State Inpatient Databases (SID) limited to data from community hospitals, which are defined as short-term, non-Federal, general, and other hospitals, excluding hospital units of other institutions (e.g., prisons). Community hospitals include obstetrics and gynecology, otolaryngology, orthopedic, cancer, pediatric, public, and academic medical center hospitals. Excluded for this analysis are long-term care facilities such as rehabilitation, psychiatric, and alcoholism and chemical dependency hospitals. However, if a patient received long-term care, rehabilitation, or treatment for a psychiatric or chemical dependency condition in a community hospital, the discharge record for that stay was included in the analysis.

Unit of analysis
The unit of analysis is the hospital discharge (i.e., the hospital stay), not a person or patient. This means that a person who is admitted to the hospital multiple times in 1 year will be counted each time as a separate discharge from the hospital. This includes discharges from any HCUP hospital of a patient who resides in the geographic area of interest.

Population rates
Rates of stays per 100,000 population were calculated using 2016-2018 hospital discharge totals in the numerator and Claritase estimates of the 2016-2018 U.S. population in the denominator. Individuals hospitalized multiple times are counted more than once in the numerator. State- and substate region-level rates are based on the ZIP Code of the patient's residence.

For the national and State-level information presented in Figure 1 and Table 1, the rate of inpatient stays was calculated annually at the national level and for each State, as the number of stays divided by the population estimate for that year multiplied by 100,000. Then, to obtain the weighted 3-year average, the annual rates were summed, weighted by the ratio of the population total in each year to the 3-year aggregate population. These National and State-level rates include information from all regions, including those suppressed in the other figures.

    National and State rate2016-2018 = rate2016 * (population estimate2016/population estimate2016-2018) + rate2017 * (population estimate2017/population estimate2016-2018) + rate2018 * (population estimate2018/population estimate2016-2018)
Figures 2 through 6 are derived from region-level rates of inpatient stays. The 3-year region-level estimates were calculated as follows:

    Region rate2016-2018 = (number of stays2016 + number of stays2017 + number of stays2018)/(population estimate2016 + population estimate2017 + population estimate2018) * 100,000
About HCUP

The Healthcare Cost and Utilization Project (HCUP, pronounced "H-Cup") is a family of healthcare databases and related software tools and products developed through a Federal-State-Industry partnership and sponsored by the Agency for Healthcare Research and Quality (AHRQ). HCUP databases bring together the data collection efforts of State data organizations, hospital associations, and private data organizations (HCUP Partners) and the Federal government to create a national information resource of encounter-level healthcare data. HCUP includes the largest collection of longitudinal hospital care data in the United States, with all-payer, encounter-level information beginning in 1988. These databases enable research on a broad range of health policy issues, including cost and quality of health services, medical practice patterns, access to healthcare programs, and outcomes of treatments at the national, State, and local market levels.

HCUP would not be possible without the contributions of the following data collection Partners from across the United States:
Alaska Department of Health and Social Services
Alaska State Hospital and Nursing Home Association
Arizona Department of Health Services
Arkansas Department of Health
California Office of Statewide Health Planning and Development
Colorado Hospital Association
Connecticut Hospital Association
Delaware Division of Public Health
District of Columbia Hospital Association
Florida Agency for Health Care Administration
Georgia Hospital Association
Hawaii Laulima Data Alliance
Hawaii University of Hawai'i at Hilo
Illinois Department of Public Health
Indiana Hospital Association
Iowa Hospital Association
Kansas Hospital Association
Kentucky Cabinet for Health and Family Services
Louisiana Department of Health
Maine Health Data Organization
Maryland Health Services Cost Review Commission
Massachusetts Center for Health Information and Analysis
Michigan Health & Hospital Association
Minnesota Hospital Association
Mississippi State Department of Health
Missouri Hospital Industry Data Institute
Montana Hospital Association
Nebraska Hospital Association
Nevada Department of Health and Human Services
New Hampshire Department of Health & Human Services
New Jersey Department of Health
New Mexico Department of Health
New York State Department of Health
North Carolina Department of Health and Human Services
North Dakota (data provided by the Minnesota Hospital Association)
Ohio Hospital Association
Oklahoma State Department of Health
Oregon Association of Hospitals and Health Systems
Oregon Office of Health Analytics
Pennsylvania Health Care Cost Containment Council
Rhode Island Department of Health
South Carolina Revenue and Fiscal Affairs Office
South Dakota Association of Healthcare Organizations
Tennessee Hospital Association
Texas Department of State Health Services
Utah Department of Health
Vermont Association of Hospitals and Health Systems
Virginia Health Information
Washington State Department of Health
West Virginia Department of Health and Human Resources, West Virginia Health Care Authority
Wisconsin Department of Health Services
Wyoming Hospital Association

About the NIS

The HCUP National (Nationwide) Inpatient Sample (NIS) is a nationwide database of hospital inpatient stays. The NIS is nationally representative of all community hospitals (i.e., short-term, non-Federal, nonrehabilitation hospitals). The NIS includes all payers. It is drawn from a sampling frame that contains hospitals comprising more than 96 percent of all discharges in the United States. The vast size of the NIS allows the study of topics at the national and regional levels for specific subgroups of patients. In addition, NIS data are standardized across years to facilitate ease of use. Over time, the sampling frame for the NIS has changed; thus, the number of States contributing to the NIS varies from year to year. The NIS is intended for national estimates only; no State-level estimates can be produced. The unweighted sample size for the 2018 NIS is 7,105,498 (weighted, this represents 35,527,481 inpatient stays). The unweighted sample size for the 2016 NIS is 7,135,090 (weighted, this represents 35,675,421 inpatient stays).

About the SID

The HCUP State Inpatient Databases (SID) are hospital inpatient databases from data organizations participating in HCUP. The SID contain the universe of the inpatient discharge abstracts in the participating HCUP States, translated into a uniform format to facilitate multistate comparisons and analyses. Together, the SID encompass more than 95 percent of all U.S. community hospital discharges. The SID can be used to investigate questions unique to one State, to compare data from two or more States, to conduct market-area variation analyses, and to identify State-specific trends in inpatient care utilization, access, charges, and outcomes.

About HCUPnet

HCUPnet (datatools.ahrq.gov/hcupnet) is an online query system that offers instant access to the largest set of all-payer healthcare databases that are publicly available. HCUPnet has an easy step-by-step query system that creates tables and graphs of national and regional statistics as well as data trends for community hospitals in the United States. HCUPnet generates statistics using data from HCUP's National (Nationwide) Inpatient Sample (NIS), the Kids' Inpatient Database (KID), the Nationwide Emergency Department Sample (NEDS), the Nationwide Readmissions Database (NRD), the State Inpatient Databases (SID), and the State Emergency Department Databases (SEDD).

For More Information

For other information on mental disorder-related hospitalizations, refer to the HCUP Statistical Briefs located at www.hcup-us.ahrq.gov/reports/statbriefs/sb_mhsa.jsp.

For additional HCUP statistics, visit:
For more information about HCUP, visit www.hcup-us.ahrq.gov/.

For a detailed description of HCUP and more information on the design of the National Inpatient Sample (NIS) and State Inpatient Databases (SID), please refer to the following database documentation:

Agency for Healthcare Research and Quality. Overview of the National (Nationwide) Inpatient Sample (NIS). Healthcare Cost and Utilization Project (HCUP). Rockville, MD: Agency for Healthcare Research and Quality. Updated December 2020. www.hcup-us.ahrq.gov/nisoverview.jsp. Accessed January 22, 2021.

Agency for Healthcare Research and Quality. Overview of the State Inpatient Databases (SID). Healthcare Cost and Utilization Project (HCUP). Rockville, MD: Agency for Healthcare Research and Quality. Updated October 2020. www.hcup-us.ahrq.gov/sidoverview.jsp. Accessed January 22, 2021.

Suggested Citation

Fingar KR (IBM), Roemer M (AHRQ). Geographic Variation in Inpatient Stays for Five Leading Mental Disorders, 2016-2018. HCUP Statistical Brief #288. February 2022. Agency for Healthcare Research and Quality, Rockville, MD. www.hcup-us.ahrq.gov/reports/statbriefs/sb288-Mental-Disorder-Hospitalizations-by-Region-2016-2018.pdf.

Acknowledgments

The authors would like to acknowledge the contributions of Manjie Fu, Veronica Hernandez, Mimi Mauskopf, Jillian McCarty, and Minya Sheng of IBM.

***

AHRQ welcomes questions and comments from readers of this publication who are interested in obtaining more information about access, cost, use, financing, and quality of healthcare in the United States. We also invite you to tell us how you are using this Statistical Brief and other HCUP data and tools, and to share suggestions on how HCUP products might be enhanced to further meet your needs. Please email us at hcup@ahrq.gov or send a letter to the address below:

Joel W. Cohen, Ph.D., Director
Center for Financing, Access and Cost Trends
Agency for Healthcare Research and Quality
5600 Fishers Lane
Rockville, MD 20857


This Statistical Brief was posted online on February 15, 2022


a Note that Appalachia is an area of the United States that includes parts of the Ohio River Valley and spans 13 States, including parts of northern Alabama, Georgia, Mississippi, and South Carolina; eastern parts of Kentucky, Ohio, and Tennessee; western parts of Maryland, North Carolina, and Virginia; the southern tier of New York; most of Pennsylvania; and all of West Virginia. Appalachian Regional Commission. About the Appalachian Region. www.arc.gov/about-the-appalachian-region/. Exit Disclaimer Accessed October 13, 2021.
b Substance Abuse and Mental Health Services Administration. 2010-2012 National Survey on Drug Use and Health Substate Region Definitions. www.samhsa.gov/data/sites/default/files/substate2k12-RegionDefs/NSDUHsubstateRegionDefs2012.htm. Accessed October 11, 2021.
c Claritas. Claritas Demographic Profile by ZIP Code. https://claritas360.claritas.com/mybestsegments/. Exit Disclaimer Accessed January 22, 2021.
d Agency for Healthcare Research and Quality. HCUP Clinical Classifications Software Refined (CCSR) for ICD-10-CM Diagnoses. Healthcare Cost and Utilization Project (HCUP). Agency for Healthcare Research and Quality. Updated March 2021. www.hcup-us.ahrq.gov/toolssoftware/ccsr/dxccsr.jsp. Accessed June 14, 2021.
e Claritas. Claritas Demographic Profile by ZIP Code. https://claritas360.claritas.com/mybestsegments/. Exit Disclaimer Accessed January 22, 2021.

Internet Citation: Statistical Brief #288. Healthcare Cost and Utilization Project (HCUP). February 2022. Agency for Healthcare Research and Quality, Rockville, MD. www.hcup-us.ahrq.gov/reports/statbriefs/sb288-Mental-Disorder-Hospitalizations-by-Region-2016-2018.jsp.
Are you having problems viewing or printing pages on this website?
If you have comments, suggestions, and/or questions, please contact hcup@ahrq.gov.
Privacy Notice, Viewers & Players
Last modified 2/18/22