|
STATISTICAL BRIEF #287
December 2021
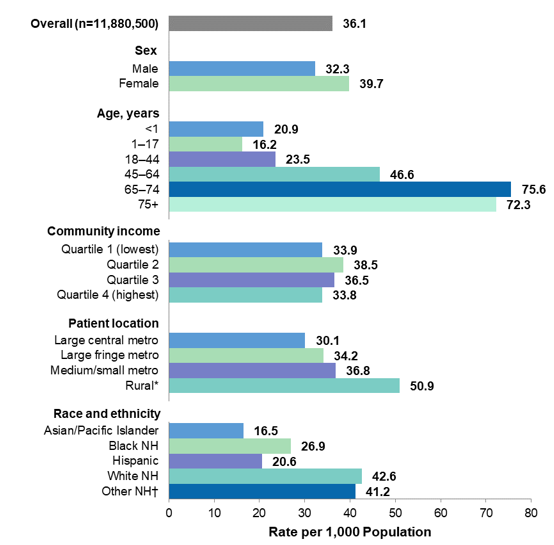
Kimberly W. McDermott, Ph.D., and Lan Liang, Ph.D. Introduction The volume of ambulatory surgeries performed at U.S. community hospitals has grown consistently over the past quarter century, increasing from 13.4 million surgeries in 1995 to 19.2 million surgeries in 2018.1 Reflective of this growth, outpatient services accounted for 49 percent of community hospital revenue in 2018.1 Identifying the volume and characteristics of encounters for major ambulatory surgeries, as well as the most common ambulatory surgeries performed, can help provide baseline data for assessing the potential impacts over time of elective procedure deferrals,2 changes in reimbursement policy, and advances in medical technology. This Healthcare Cost and Utilization Project (HCUP) Statistical Brief presents statistics on major ambulatory surgeries performed in hospital-owned facilities using weighted estimates from the 2019 Nationwide Ambulatory Surgery Sample (NASS). Major ambulatory surgeries are defined as select invasive, therapeutic surgical procedures that typically require the use of an operating room and regional anesthesia, general anesthesia, or sedation (i.e., surgeries flagged as "narrow" in the HCUP Surgery Flags Software3). Procedures intended primarily for diagnostic purposes are excluded. The rate of major ambulatory surgeries is provided by patient characteristics and hospital characteristics. Additionally, the most common all-listed major ambulatory surgeries are presented overall and by age-sex group, race and ethnicity, and primary expected payer. Because of the large sample size of the NASS data, small differences can be statistically significant. Thus, only differences greater than or equal to 10 percent are discussed in the text. Note that the NASS only includes community hospital-owned ambulatory surgery facilities. Findings Encounters for major ambulatory surgeries performed in hospital-owned facilities, by patient and hospital characteristics, 2019 Figure 1 presents the rate of encounters for major ambulatory surgeries by select patient characteristics. |
|
Figure 1. Population rate of encounters for major ambulatory surgeries performed in hospital-owned facilities by patient characteristic, 2019
Abbreviation: NH, non-Hispanic; metro, metropolitan Bar chart that presents the rate per 1,000 population of encounters for major ambulatory surgeries performed in hospital-owned facilities in 2019 by patient characteristic. Overall (n = 11,880,500): 36.1. Sex: male = 32.3; female = 39.7. Age: <1 year = 20.9; 1-17 years = 16.2; 18-44 years = 23.5; 45-64 years = 46.6; 65-74 years = 75.6; 75+ years = 72.3. Community income: quartile 1 (lowest) = 33.9; quartile 2 = 38.5; quartile 3 = 36.5; quartile 4 (highest) = 33.8. Patient location: large central metropolitan = 30.1; large fringe metropolitan = 34.2; medium/small metropolitan = 36.8; rural (includes micropolitan and noncore communities) = 50.9. Race and ethnicity: Asian/Pacific Islander = 16.5; non-Hispanic Black = 26.9; Hispanic = 20.6; non-Hispanic White = 42.6; non-Hispanic Other (includes American Indian/Alaska Native and other non-Hispanic individuals) = 41.2.
|
| Table 1. Encounters for major ambulatory surgeries performed in hospital-owned facilities by hospital characteristic, 2019 | ||
| Characteristic | Encounters for major ambulatory surgeries | |
|---|---|---|
| Number | Percent | |
| Overall | 11,880,500 | 100.0 |
| Bed size | ||
| Small (0-99 beds) | 2,023,900 | 17.0 |
| Medium (100-299 beds) | 3,915,300 | 33.0 |
| Large (300+ beds) | 5,941,200 | 50.0 |
| Ownership | ||
| Public | 1,419,800 | 12.0 |
| Private, not-for-profit | 8,997,500 | 75.7 |
| Private, investor-owned | 1,463,200 | 12.3 |
| Location | ||
| Urban | 10,431,300 | 87.8 |
| Rural | 1,449,200 | 12.2 |
| Teaching status | ||
| Teaching | 8,541,400 | 71.9 |
| Nonteaching | 3,339,100 | 28.1 |
| Region | ||
| Northeast | 2,051,900 | 17.3 |
| Midwest | 3,064,300 | 25.8 |
| South | 4,332,300 | 36.5 |
| West | 2,431,900 | 20.5 |
| Notes: Number of encounters is rounded to the nearest hundred. Percentages are calculated from unrounded values. Source: Agency for Healthcare Research and Quality (AHRQ), Healthcare Cost and Utilization Project (HCUP), Nationwide Ambulatory Surgery Sample (NASS), 2019 | ||
| Table 2. Top 20 major ambulatory surgeries performed in hospital-owned facilities, 2019 | |||||
| Rank | CCS-Services and Procedures category | Total major ambulatory surgeries | Encounters involving one or more major ambulatory surgery | ||
|---|---|---|---|---|---|
| Number | Percent | Number | Percent | ||
| 1 | Lens and cataract procedures | 1,235,400 | 7.9 | 1,172,800 | 9.9 |
| 2 | Other (select) therapeutic procedures on muscles and tendons* | 1,158,600 | 7.4 | 911,700 | 7.7 |
| 3 | Cholecystectomy and common duct exploration | 643,200 | 4.1 | 606,900 | 5.1 |
| 4 | Other (select) operating room therapeutic procedures on joints* | 594,500 | 3.8 | 518,600 | 4.4 |
| 5 | Other (select) operating room therapeutic procedures on nose, mouth and pharynx* | 537,800 | 3.4 | 292,700 | 2.5 |
| 6 | Other (select) operating room therapeutic procedures on skin and breast* | 537,700 | 3.4 | 376,100 | 3.2 |
| 7 | Inguinal and femoral hernia repair | 494,900 | 3.2 | 456,600 | 3.8 |
| 8 | Hernia repair other than inguinal and femoral | 470,500 | 3.0 | 434,200 | 3.7 |
| 9 | Tonsillectomy and/or adenoidectomy | 460,400 | 2.9 | 422,100 | 3.6 |
| 10 | Decompression of the peripheral nerve | 449,200 | 2.9 | 387,600 | 3.3 |
| 11 | Excision of semilunar cartilage (meniscus) of knee | 433,500 | 2.8 | 404,800 | 3.4 |
| 12 | Hysterectomy, abdominal and vaginal | 419,000 | 2.7 | 399,800 | 3.4 |
| 13 | Myringotomy | 371,900 | 2.4 | 335,400 | 2.8 |
| 14 | Lumpectomy, quadrantectomy of breast | 347,500 | 2.2 | 331,700 | 2.8 |
| 15 | Other (select) operating room therapeutic procedures on bone* | 334,500 | 2.1 | 288,200 | 2.4 |
| 16 | Arthroplasty knee | 317,800 | 2.0 | 301,900 | 2.5 |
| 17 | Insertion, revision, replacement, removal of cardiac pacemaker or cardioverter/defibrillator | 310,200 | 2.0 | 265,900 | 2.2 |
| 18 | Appendectomy | 308,500 | 2.0 | 278,400 | 2.3 |
| 19 | Partial excision bone | 307,100 | 2.0 | 277,300 | 2.3 |
| 20 | Laminectomy, excision intervertebral disc | 296,200 | 1.9 | 276,700 | 2.3 |
| Top 20 major ambulatory surgeries | 10,028,500 | 64.0 | 8,057,700 | 67.8 | |
| All major ambulatory surgeries | 15,669,400 | 100.0 | 11,880,500 | 100.0 | |
| Abbreviation: CCS-Services and Procedures, Clinical Classifications Software for Services and Procedures Notes: Numbers of procedures and encounters are rounded to the nearest hundred. Percentages are calculated from unrounded values. Procedures are grouped using the Healthcare Cost and Utilization Project (HCUP) CCS-Services and Procedures. Note that a single encounter could involve more than one surgery, and the same encounter may be included in the encounter totals for more than one surgery grouping. * See Appendix for example surgeries included in this CCS-Services and Procedures category. Source: Agency for Healthcare Research and Quality (AHRQ), Healthcare Cost and Utilization Project (HCUP), Nationwide Ambulatory Surgery Sample (NASS), 2019 | |||||
| Table 3. Most frequent major ambulatory surgeries performed in hospital-owned facilities by age-sex group, 2019 | |||||||
| Males | Females | ||||||
|---|---|---|---|---|---|---|---|
| Rank | CCS-Services and Procedures category | Number of major ambulatory surgeries | Rate per 1,000 population | Rank | CCS-Services and Procedures category | Number of major ambulatory surgeries | Rate per 1,000 population |
| Ages 0-17 years | 959,500 | 25.4 | Ages 0-17 years | 675,700 | 18.7 | ||
| 1 | Tonsillectomy and/or adenoidectomy | 201,300 | 5.3 | 1 | Tonsillectomy and/or adenoidectomy | 175,700 | 4.9 |
| 2 | Myringotomy | 201,300 | 5.3 | 2 | Myringotomy | 138,500 | 3.8 |
| 3 | Other (select) operating room therapeutic procs on male genital* | 98,700 | 2.6 | 3 | Appendectomy | 30,700 | 0.8 |
| 4 | Appendectomy | 45,100 | 1.2 | 4 | Other (select) operating room therapeutic procs on nose, mouth and pharynx* | 28,400 | 0.8 |
| 5 | Other (select) operating room therapeutic procs on nose, mouth and pharynx* | 37,100 | 1.0 | 5 | Other (select) operating room therapeutic procs on bone* | 27,700 | 0.8 |
| Ages 18-44 years | 1,345,200 | 22.6 | Ages 18-44 years | 2,300,500 | 39.7 | ||
| 1 | Other (select) therapeutic procs on muscles and tendons* | 117,900 | 2.0 | 1 | Cholecystectomy and common duct exploration | 225,400 | 3.9 |
| 2 | Other (select) operating room therapeutic procs on joints* | 102,300 | 1.7 | 2 | Hysterectomy, abdominal and vaginal | 175,400 | 3.0 |
| 3 | Other (select) operating room therapeutic procs on nose, mouth and pharynx* | 92,900 | 1.6 | 3 | Other (select) operating room therapeutic procs on skin and breast* | 158,900 | 2.7 |
| 4 | Appendectomy | 75,000 | 1.3 | 4 | Other (select) operating room therapeutic procs, female organs* | 144,900 | 2.5 |
| 5 | Inguinal and femoral hernia repair | 73,500 | 1.2 | 5 | Oophorectomy, unilateral and bilateral | 131,400 | 2.3 |
| Ages 45-64 years | 2,194,500 | 53.4 | Ages 45-64 years | 3,140,000 | 72.7 | ||
| 1 | Other (select) therapeutic procs on muscles and tendons* | 268,800 | 6.5 | 1 | Other (select) therapeutic procs on muscles and tendons* | 281,700 | 6.5 |
| 2 | Inguinal and femoral hernia repair | 169,300 | 4.1 | 2 | Other (select) operating room therapeutic procs on skin and breast* | 232,900 | 5.4 |
| 3 | Hernia repair other than inguinal and femoral | 126,900 | 3.1 | 3 | Hysterectomy, abdominal and vaginal | 189,100 | 4.4 |
| 4 | Other (select) operating room therapeutic procs on joints* | 118,300 | 2.9 | 4 | Cholecystectomy, common duct exploration | 157,200 | 3.6 |
| 5 | Lens and cataract procs | 111,900 | 2.7 | 5 | Lens and cataract procs | 148,500 | 3.4 |
| Ages 65+ years | 2,312,300 | 97.3 | Ages 65+ years | 2,739,400 | 92.1 | ||
| 1 | Lens and cataract procs | 391,000 | 16.5 | 1 | Lens and cataract procs | 563,000 | 18.9 |
| 2 | Inguinal and femoral hernia repair | 169,700 | 7.1 | 2 | Other (select) therapeutic procs on muscles and tendons* | 173,300 | 5.8 |
| 3 | Other (select) therapeutic procs on muscles and tendons* | 160,800 | 6.8 | 3 | Lumpectomy, quadrantectomy of breast | 133,100 | 4.5 |
| 4 | Cardiac pacemaker or cardioverter/defibrillator procs | 145,700 | 6.1 | 4 | Arthroplasty knee | 114,100 | 3.8 |
| 5 | Other (select) operating room procs on vessels other than head and neck* | 98,800 | 4.2 | 5 | Other (select) therapeutic procedures, hemic and lymphatic system* | 97,100 | 3.3 |
| Abbreviations: CCS-Services and Procedures, Clinical Classifications Software for Services and Procedures; procs, procedures Notes: Number of procedures is rounded to the nearest hundred. Rates are calculated from unrounded values. Procedures are grouped using the Healthcare Cost and Utilization Project (HCUP) CCS-Services and Procedures. * See Appendix for example surgeries included in this CCS-Services and Procedures category. Source: Agency for Healthcare Research and Quality (AHRQ), Healthcare Cost and Utilization Project (HCUP), Nationwide Ambulatory Surgery Sample (NASS), 2019 | |||||||
| Table 4. Most frequent major ambulatory surgeries performed in hospital-owned facilities by patient race and ethnicity, 2019 | |||
| Race and ethnicity, rank | CCS-Services and Procedures category | Number of major ambulatory surgeries | Rate per 1,000 population |
|---|---|---|---|
| Asian/Pacific Islander | 407,200 | 21.1 | |
| 1 | Lens and cataract procedures | 47,100 | 2.4 |
| 2 | Other (select) therapeutic procedures on muscles and tendons* | 21,800 | 1.1 |
| 3 | Other (select) operating room therapeutic procedures on nose, mouth and pharynx* | 18,300 | 0.9 |
| 4 | Lumpectomy, quadrantectomy of breast | 16,400 | 0.8 |
| 5 | Cholecystectomy and common duct exploration | 16,100 | 0.8 |
| Non-Hispanic Black | 1,404,000 | 34.3 | |
| 1 | Lens and cataract procedures | 105,500 | 2.6 |
| 2 | Other (select) therapeutic procedures on muscles and tendons* | 103,600 | 2.5 |
| 3 | Other (select) operating room therapeutic procedures on skin and breast* | 55,300 | 1.4 |
| 4 | Other (select) operating room therapeutic procedures on joints* | 50,600 | 1.2 |
| 5 | Creation, revision and removal of arteriovenous fistula or vessel-to-vessel cannula for dialysis | 49,000 | 1.2 |
| Hispanic | 1,599,400 | 26.4 | |
| 1 | Other (select) therapeutic procedures on muscles and tendons* | 108,000 | 1.8 |
| 2 | Cholecystectomy and common duct exploration | 104,400 | 1.7 |
| 3 | Lens and cataract procedures | 92,100 | 1.5 |
| 4 | Tonsillectomy and/or adenoidectomy | 65,100 | 1.1 |
| 5 | Other (select) operating room therapeutic procedures on skin and breast* | 56,700 | 0.9 |
| Non-Hispanic White | 11,109,400 | 56.2 | |
| 1 | Lens and cataract procedures | 910,000 | 4.6 |
| 2 | Other (select) therapeutic procedures on muscles and tendons* | 849,200 | 4.3 |
| 3 | Other (select) operating room therapeutic procedures on joints* | 444,700 | 2.3 |
| 4 | Cholecystectomy and common duct exploration | 440,300 | 2.2 |
| 5 | Other (select) operating room therapeutic procedures on nose, mouth and pharynx* | 382,500 | 1.9 |
| Non-Hispanic Other† | 38,600 | 3.6 | |
| 1 | Lens and cataract procedures | 50,800 | 4.7 |
| 2 | Other (select) therapeutic procedures on muscles and tendons* | 849,200 | 4.3 |
| 3 | Other (select) operating room therapeutic procedures on nose, mouth and pharynx* | 26,000 | 2.4 |
| 4 | Tonsillectomy and/or adenoidectomy | 25,400 | 2.4 |
| 5 | Cholecystectomy and common duct exploration | 22,900 | 2.1 |
| Abbreviation: CCS-Services and Procedures, Clinical Classifications Software for Services and Procedures Notes: Number of procedures is rounded to the nearest hundred. Rates are calculated from unrounded values. Procedures are grouped using the Healthcare Cost and Utilization Project (HCUP) CCS-Services and Procedures. * See Appendix for example surgeries included in this CCS-Services and Procedures category. † Other NH includes American Indian/Alaska Native and other non-Hispanic individuals. Source: Agency for Healthcare Research and Quality (AHRQ), Healthcare Cost and Utilization Project (HCUP), Nationwide Ambulatory Surgery Sample (NASS), 2019 | |||
Table 5 presents the most common major ambulatory surgeries by primary expected payer in 2019. |
| Table 5. Most frequent major ambulatory surgeries performed in hospital-owned facilities by primary expected payer, 2019 | |||
| Primary expected payer, rank | CCS-Services and Procedures category | Number of major ambulatory surgeries | Percent of major ambulatory surgeries among primary expected payer |
|---|---|---|---|
| Medicare | 4,973,000 | 100.0 | |
| 1 | Lens and cataract procedures | 843,400 | 17.0 |
| 2 | Other (select) therapeutic procedures on muscles and tendons* | 342,000 | 6.9 |
| 3 | Insertion, revision, replacement, removal of cardiac pacemaker or cardioverter/defibrillator | 227,800 | 4.6 |
| 4 | Other (select) operating room procedures on vessels other than head and neck* | 186,400 | 3.7 |
| 5 | Arthroplasty knee | 181,600 | 3.7 |
| Medicaid | 2,113,100 | 100.0 | |
| 1 | Tonsillectomy and/or adenoidectomy | 188,700 | 8.9 |
| 2 | Myringotomy | 148,400 | 7.0 |
| 3 | Other (select) therapeutic procedures on muscles and tendons* | 133,800 | 6.3 |
| 4 | Cholecystectomy and common duct exploration | 104,300 | 4.9 |
| 5 | Other (select) operating room therapeutic procedures on nose, mouth and pharynx* | 75,100 | 3.6 |
| Private insurance | 7,379,500 | 100.0 | |
| 1 | Other (select) therapeutic procedures on muscles and tendons* | 555,400 | 7.5 |
| 2 | Cholecystectomy and common duct exploration | 358,100 | 4.9 |
| 3 | Other (select) operating room therapeutic procedures on nose, mouth and pharynx* | 332,800 | 4.5 |
| 4 | Other (select) operating room therapeutic procedures on joints* | 323,900 | 4.4 |
| 5 | Hysterectomy, abdominal and vaginal | 287,600 | 3.9 |
| Self-pay/No Charge† | 465,300 | 100.0 | |
| 1 | Other (select) operating room therapeutic procedures on skin and breast* | 105,200 | 22.6 |
| 2 | Cholecystectomy and common duct exploration | 31,300 | 6.7 |
| 3 | Appendectomy | 28,200 | 6.1 |
| 4 | Other (select) therapeutic procedures on muscles and tendons* | 23,500 | 5.0 |
| 5 | Lens and cataract procedures | 16,300 | 3.5 |
| Other | 713,800 | 100.0 | |
| 1 | Other (select) therapeutic procedures on muscles and tendons* | 101,900 | 14.3 |
| 2 | Other (select) operating room therapeutic procedures on joints* | 66,200 | 9.3 |
| 3 | Excision of semilunar cartilage of knee | 37,800 | 5.3 |
| 4 | Decompression peripheral nerve | 28,200 | 3.9 |
| 5 | Partial excision bone | 26,400 | 3.7 |
| Abbreviation: CCS-Services and Procedures, Clinical Classifications Software for Services and Procedures Notes: Number of procedures is rounded to the nearest hundred. Percentages are calculated from unrounded values. Procedures are grouped using the Healthcare Cost and Utilization Project (HCUP) CCS-Services and Procedures. Percentages are provided because there is currently no data source for national population insurance estimates that align with HCUP's definition of expected primary payer. * See Appendix for example surgeries included in this CCS-Services and Procedures category. † Self-pay/No charge: includes self-pay, no charge, charity, and no expected payment. Source: Agency for Healthcare Research and Quality (AHRQ), Healthcare Cost and Utilization Project (HCUP), Nationwide Ambulatory Surgery Sample (NASS), 2019 | |||
Appendix. Example surgeries by Clinical Classifications Software for Services and Procedures category In some cases, Clinical Classifications Software for Services and Procedures (CCS-Services and Procedures) category labels reflect a broad range of surgeries (e.g., Other therapeutic procedures on muscles and tendons). This appendix provides a description of some of the most common surgeries within the nonspecific CCS-Services and Procedures categories included in this report (i.e., categories identified as "Other" in the CCS-Services and Procedures software). |
| CCS-Services and Procedures category | Example surgeries |
|---|---|
| Other (select) operating room therapeutic procedures on nose, mouth and pharynx (CCS-Services and Procedures 33) |
|
| Other (select) operating room procedures on vessels other than head and neck (CCS-Services and Procedures 61) |
|
| Other (select) therapeutic procedures, hemic and lymphatic system (CCS-Services and Procedures 67) |
|
| Other (select) operating room therapeutic procedures, male genital (CCS-Services and Procedures 118) |
|
| Other (select) operating room therapeutic procedures, female organs (CCS-Services and Procedures 132) |
|
| Other (select) therapeutic procedures on muscles and tendons (CCS-Services and Procedures 160) |
|
| Other (select) operating room therapeutic procedures on bone (CCS-Services and Procedures 161) |
|
| Other (select) operating room therapeutic procedures on joints (CCS-Services and Procedures 162) |
|
| Other (select) operating room therapeutic procedures on skin and breast (CCS-Services and Procedures 175) |
|
| Abbreviation: CCS-Services and Procedures, Clinical Classifications Software for Services and Procedures | |
References
1 American Hospital Association. TrendWatch Chartbook 2020, Supplementary Data Tables. www.aha.org/system/files/media/file/2020/10/TrendwatchChartbook-2020-Appendix.pdf. 2 Best MJ, McFarland EG, Anderson GF, Srikumaran U. The likely economic impact of fewer elective surgical procedures on US hospitals during the COVID-19 pandemic. Surgery. 2020;168(5):962-7. 3 Agency for Healthcare Research and Quality. Surgery Flags Software for Services and Procedures. Healthcare Cost and Utilization Project (HCUP). Last modified May 25, 2021. www.hcup-us.ahrq.gov/toolssoftware/surgeryflags_svcproc/surgeryflagssvc_proc.jsp. Accessed October 1, 2021. About Statistical Briefs Healthcare Cost and Utilization Project (HCUP) Statistical Briefs provide basic descriptive statistics on a variety of topics using HCUP administrative healthcare data. Topics include hospital inpatient, ambulatory surgery, and emergency department use and costs, quality of care, access to care, medical conditions, procedures, and patient populations, among other topics. The reports are intended to generate hypotheses that can be further explored in other research; the reports are not designed to answer in-depth research questions using multivariate methods. Data Source The estimates in this Statistical Brief are based upon data from the HCUP Nationwide Ambulatory Surgery Sample (NASS). Supplemental sources include population denominator data for use with HCUP databases, derived from information available from Claritas, a vendor that produces population estimates and projections based on data from the U.S. Census Bureau.a Definitions Procedures, Current Procedural Terminology (CPT®), and Clinical Classifications Software for Services and Procedures (CCS-Services and Procedures) All-listed procedures include all procedures performed during the hospital stay or outpatient visit, whether for definitive treatment or for diagnostic or exploratory purposes. CPT assigns numeric codes to procedures. There are approximately 9,600 CPT procedure codes. The CCS-Services and Procedures provides a method for classifying CPT and Healthcare Common Procedure Coding System (HCPCS) Level II codes into clinically meaningful procedure categories.b More than 10,000 CPT codes and 6,000 HCPCS Level II codes are collapsed into over 240 categories that may be more useful for presenting descriptive statistics than are individual CPT or HCPCS Level II codes. Encounters included in the HCUP Nationwide Ambulatory Surgery Sample The 2019 Nationwide Ambulatory Surgery Sample (NASS) is limited to encounters with at least one in-scope ambulatory surgery on the record performed at a hospital-owned facility. In-scope procedures are defined as major surgeries (invasive, therapeutic procedures that typically require the use of an operating room and regional anesthesia, general anesthesia, or sedation, flagged as "narrow" surgeries in the HCUP Surgery Flags Softwarec) that belong to a subset of CCS-Services and Procedures categories. To be considered in scope for the 2019 NASS, a CCS-Services and Procedures category must (1) have a relatively high major ambulatory surgery volume or aggregate charge total in the State Ambulatory Surgery and Services Databases (SASD) and State Emergency Department Databases (SEDD) and (2) show evidence of reliable reporting from hospitals in the SASD and SEDD.d Types of hospitals included in the HCUP Nationwide Ambulatory Surgery Sample The NASS is based on data from hospital-owned ambulatory surgery facilities. The designation of a facility as hospital-owned is specific to its financial relationship with a hospital that provides inpatient care and is not related to its physical location. Ambulatory surgery performed in hospital-owned facilities may be performed within the hospital, in a facility attached to the hospital, or in a facility physically separated from the hospital. The NASS is further limited to ambulatory surgeries performed at facilities owned by community hospitals. Community hospitals are defined as short-term, non-Federal, general, and other specialty hospitals, excluding hospital units of other institutions (e.g., prisons). Rehabilitation and long-term acute care hospitals are excluded. Unit of analysis The unit of analysis is the ambulatory surgery or ambulatory surgery encounter, not a person or patient. This means that a person who has multiple ambulatory surgery encounters in 1 year will be counted each time as a separate encounter. If a person has multiple ambulatory surgeries performed during the same encounter or during multiple encounters, the surgeries are counted as separate and unique surgeries. Population rates Rates of ambulatory surgeries (or ambulatory surgery encounters) per 1,000 population were calculated using 2019 surgery totals (or encounter totals) in the numerator and Claritase estimates of the 2019 U.S. population in the denominator. Individuals with multiple surgeries or encounters are counted more than once in the numerator. Population rate of surgeries/encounters equals the number of surgeries/encounters among patients in group divided by the number of U.S. residents in group multiplied by 100,000 Hospital location The classification of whether a hospital is in a metropolitan area (urban) or nonmetropolitan area (rural) is assigned from the American Hospital Association (AHA) Annual Survey and is based on the Core Based Statistical Area (CBSA) definition of rurality developed by the Office of Management and Budget (OMB). Hospitals located in counties with a CBSA type of "Division" or "Metropolitan" were considered urban, and hospitals with a CBSA type of "Rural" or "Micropolitan" were classified as rural. This Statistical Brief used the CBSA classification released in 2014, which was based on the 2010 Census. Location of patients' residence Place of residence is based on the urban-rural classification scheme for U.S. counties developed by the National Center for Health Statistics (NCHS) and based on the OMB definition of a metropolitan service area as including a city and a population of at least 50,000 residents:
Community-level income Community-level income is based on the median household income of the patient's ZIP Code of residence. Quartiles are defined so that the total U.S. population is evenly distributed. The value ranges for the income quartiles vary by year. The income quartile is missing for patients who are homeless or foreign. Expected payer To make coding uniform across all HCUP data sources, the primary expected payer for the ambulatory surgery encounter combines detailed categories into general groups:
For this Statistical Brief, when more than one payer is listed for an ambulatory surgery encounter, the first-listed payer is used. Region Region is one of the four regions defined by the U.S. Census Bureau:
Data on hospital ownership and status as a teaching hospital were obtained from the AHA Annual Survey of Hospitals. Hospital ownership/control includes categories for government nonfederal (public), private not-for-profit (voluntary), and private investor-owned (proprietary). Teaching hospital is defined as having a residency program approved by the Accreditation Council for Graduate Medical Education, being a member of the Council of Teaching Hospitals, or having a ratio of full-time equivalent interns and residents to beds of 0.25 or higher. Reporting of race and ethnicity Data on Hispanic ethnicity are collected differently among the States and also can differ from the census methodology of collecting information on race (White, Black, Asian/Pacific Islander, American Indian/Alaska Native, Other [including mixed race]) separately from ethnicity (Hispanic, non-Hispanic). State data organizations often collect Hispanic ethnicity as one of several categories that include race. Therefore, for multistate analyses, HCUP creates the combined categorization of race and ethnicity for data from States that report ethnicity separately. When a State data organization collects Hispanic ethnicity separately from race, HCUP uses Hispanic ethnicity to override any other race category to create a Hispanic category for the uniformly coded race and ethnicity data element, while also retaining the original race and ethnicity data. This Statistical Brief reports race and ethnicity for the following categories: Hispanic, non-Hispanic White, non-Hispanic Black, Asian/Pacific Islander, and non-Hispanic Other (American Indian/Alaska Native, Other). About HCUP The Healthcare Cost and Utilization Project (HCUP, pronounced "H-Cup") is a family of healthcare databases and related software tools and products developed through a Federal-State-Industry partnership and sponsored by the Agency for Healthcare Research and Quality (AHRQ). HCUP databases bring together the data collection efforts of State data organizations, hospital associations, and private data organizations (HCUP Partners) and the Federal government to create a national information resource of encounter-level healthcare data. HCUP includes the largest collection of longitudinal hospital care data in the United States, with all-payer, encounter-level information beginning in 1988. These databases enable research on a broad range of health policy issues, including cost and quality of health services, medical practice patterns, access to healthcare programs, and outcomes of treatments at the national, State, and local market levels. HCUP would not be possible without the contributions of the following data collection Partners from across the United States: |
|
Alaska Department of Health and Social Services Alaska State Hospital and Nursing Home Association Arizona Department of Health Services Arkansas Department of Health California Office of Statewide Health Planning and Development Colorado Hospital Association Connecticut Hospital Association Delaware Division of Public Health District of Columbia Hospital Association Florida Agency for Health Care Administration Georgia Hospital Association Hawaii Laulima Data Alliance Hawaii University of Hawai'i at Hilo Illinois Department of Public Health Indiana Hospital Association Iowa Hospital Association Kansas Hospital Association Kentucky Cabinet for Health and Family Services Louisiana Department of Health Maine Health Data Organization Maryland Health Services Cost Review Commission Massachusetts Center for Health Information and Analysis Michigan Health & Hospital Association Minnesota Hospital Association Mississippi State Department of Health Missouri Hospital Industry Data Institute |
Montana Hospital Association Nebraska Hospital Association Nevada Department of Health and Human Services New Hampshire Department of Health & Human Services New Jersey Department of Health New Mexico Department of Health New York State Department of Health North Carolina Department of Health and Human Services North Dakota (data provided by the Minnesota Hospital Association) Ohio Hospital Association Oklahoma State Department of Health Oregon Association of Hospitals and Health Systems Oregon Office of Health Analytics Pennsylvania Health Care Cost Containment Council Rhode Island Department of Health South Carolina Revenue and Fiscal Affairs Office South Dakota Association of Healthcare Organizations Tennessee Hospital Association Texas Department of State Health Services Utah Department of Health Vermont Association of Hospitals and Health Systems Virginia Health Information Washington State Department of Health West Virginia Department of Health and Human Resources, West Virginia Health Care Authority Wisconsin Department of Health Services Wyoming Hospital Association |
|
About the NASS
The HCUP Nationwide Ambulatory Surgery Sample (NASS) is a nationwide database of encounters for major ambulatory surgeries performed in hospital-owned facilities. The NASS is constructed using records from the HCUP State Ambulatory Surgery and Services Databases (SASD). The 2019 NASS also includes records from the HCUP State Emergency Department Databases (SEDD). Major ambulatory surgeries are defined as select invasive, therapeutic surgical procedures that typically require the use of an operating room and regional anesthesia, general anesthesia, or sedation. (These surgeries are flagged as "narrow" in the HCUP Surgery Flags Software.f) Procedures intended primarily for diagnostic purposes are excluded. As the largest all-payer ambulatory surgery database in the United States, the NASS facilitates research on a variety of topics, including quality of and access to ambulatory surgery care, the impact of health policy changes, and utilization of ambulatory surgery services by specific populations. The NASS is produced annually beginning with data year 2016. The number of States contributing to the NASS varies from year to year. The NASS is intended for national estimates only; no State-level estimates can be produced. Unweighted, the 2019 NASS contains approximately 9.0 million major ambulatory surgery encounters (weighted, this represents 11.9 million major ambulatory surgery encounters). For More Information For other information on procedures, refer to the HCUP Statistical Briefs located at www.hcup-us.ahrq.gov/reports/statbriefs/sb_procedures.jsp. For additional HCUP statistics, visit:
For a detailed description of HCUP and more information on the design of the Nationwide Ambulatory Surgery Sample (NASS), please refer to the following database documentation: Agency for Healthcare Research and Quality. Overview of the Nationwide Ambulatory Surgery Sample (NASS). Healthcare Cost and Utilization Project (HCUP). Rockville, MD: Agency for Healthcare Research and Quality. Updated October 2021. www.hcup-us.ahrq.gov/nassoverview.jsp. Accessed October 21, 2021. Suggested Citation McDermott KW (IBM Watson Health), Liang L (AHRQ). Overview of Major Ambulatory Surgeries Performed in Hospital-Owned Facilities, 2019. HCUP Statistical Brief #287. December 2021. Agency for Healthcare Research and Quality, Rockville, MD. www.hcup-us.ahrq.gov/reports/statbriefs/sb287-Ambulatory-Surgery-Overview-2019.pdf. Acknowledgments The authors would like to acknowledge the contributions of Manjie Fu of IBM Watson Health. *** AHRQ welcomes questions and comments from readers of this publication who are interested in obtaining more information about access, cost, use, financing, and quality of healthcare in the United States. We also invite you to tell us how you are using this Statistical Brief and other HCUP data and tools, and to share suggestions on how HCUP products might be enhanced to further meet your needs. Please email us at hcup@ahrq.gov or send a letter to the address below:Joel W. Cohen, Ph.D., Director Center for Financing, Access and Cost Trends Agency for Healthcare Research and Quality 5600 Fishers Lane Rockville, MD 20857 This Statistical Brief was posted online on December 21, 2021. a Claritas. Claritas Demographic Profile by ZIP Code. https://claritas360.claritas.com/mybestsegments/. b Agency for Healthcare Research and Quality. Clinical Classifications Software (CCS) for Services and Procedures. Healthcare Cost and Utilization Project (HCUP). Last modified April 26, 2021. www.hcup-us.ahrq.gov/toolssoftware/ccs_svcsproc/ccssvcproc.jsp.Accessed September October 1, 2021. c Agency for Healthcare Research and Quality. Surgery Flags Software for Services and Procedures. Healthcare Cost and Utilization Project (HCUP). Last modified May 25, 2021. www.hcup-us.ahrq.gov/toolssoftware/surgeryflags_svcproc/surgeryflagssvc_proc.jsp. Accessed October 1, 2021. d Agency for Healthcare Research and Quality. Overview of the Nationwide Ambulatory Surgery Sample (NASS). Healthcare Cost and Utilization Project (HCUP). Last modified October 19, 2021. www.hcup-us.ahrq.gov/nassoverview.jsp. Accessed December 9, 2021. e Claritas. Claritas Demographic Profile by ZIP Code. https://claritas360.claritas.com/mybestsegments/. f Agency for Healthcare Research and Quality. Surgery Flags Software for Services and Procedures. Healthcare Cost and Utilization Project (HCUP). Last modified May 25, 2021. www.hcup-us.ahrq.gov/toolssoftware/surgeryflags_svcproc/surgeryflagssvc_proc.jsp. Accessed October 1, 2021. |