|
STATISTICAL BRIEF #279
July 2021
Kathryn R. Fingar, Ph.D., M.P.H., and Lawrence D. Reid, Ph.D., M.P.H. Introduction In 2018, 34.2 million individuals in the United States had ever been diagnosed with diabetes, constituting 10.5 percent of the U.S. population overall.1 This does not include another 7.3 million individuals aged 18 years or older estimated to have undiagnosed diabetes (as determined by measured fasting plasma glucose or A1C levels).1 The most common form of diabetes is type 2 diabetes, which is characterized by the body's improper use of insulin.2 Type 2 diabetes is most often diagnosed in adulthood and is associated with nonoptimal weight, poor diet, and lack of exercise.2 Type 1 diabetes is characterized by the body's inability to produce insulin and is more often diagnosed in childhood than type 2 diabetes.2 Both types of diabetes, if untreated, result in elevated levels of blood glucose that can lead to serious complications over time, such as cardiovascular disease, kidney damage, stroke, blindness, and limb amputation.3 Diabetes and the sequelae of the disease are associated with approximately 8 million hospitalizations annually.1 This Healthcare Cost and Utilization Project (HCUP) Statistical Brief presents statistics on nonmaternala inpatient stays involving type 1 or type 2 diabetes among patients aged 1 year or older using weighted estimates from the 2018 National Inpatient Sample (NIS). Patient and hospital characteristics, as well as average length of stay, cost per stay, and in-hospital mortality, are examined by type of diabetes and compared with stays without a diabetes diagnosis. Additionally, reasons for hospitalization and comorbidities among stays involving type 1 or type 2 diabetes are presented. Because of the large sample size of the NIS data, small differences can be statistically significant. Thus, only differences greater than or equal to 10 percent are discussed in the text. Findings Characteristics of inpatient stays involving diabetes, 2018 Figure 1 displays the percentage of nonmaternal inpatient stays involving type 1 or type 2 diabetes by patient age group, compared with stays without a diabetes diagnosis, in 2018. |
|
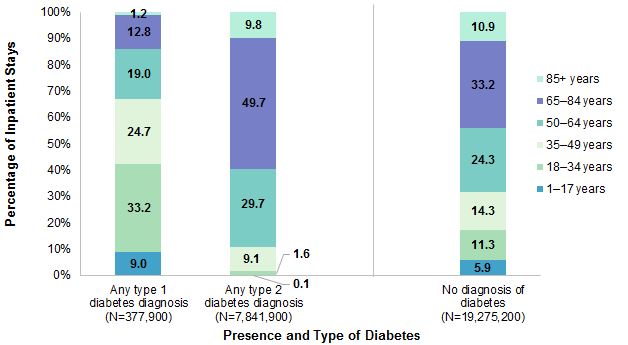
Figure 1. Patient age distribution of nonmaternal inpatient stays, by presence and type of diabetes, 2018
Notes: Stays were categorized based on all-listed diagnoses as having type 1 diabetes or type 2 diabetes, excluding the following: stays with any diagnosis of diabetes due to an underlying condition, diabetes that was drug or chemical induced, or other specified type (N=54,500); stays with codes for both type 1 and type 2 diabetes (N=6,000); and stays with a diagnosis of diabetes where the codes on the record were not specific enough to categorize the patient as having type 1 or type 2 diabetes (N=1,000). Number of stays is rounded to the nearest hundred. Percentages are calculated from unrounded values. Bar chart that shows the percentage of nonmaternal inpatient stays involving type 1 or type 2 diabetes by patient age group, versus stays without a diabetes diagnosis, in 2018. Any type 1 diabetes diagnosis (N=377,900): 1-17 years: 9.0. 18-34 years: 33.2. 35-49 years: 24.7. 50-64 years: 19.0. 65-84 years: 12.8. 85+ years: 1.2. Any type 2 diabetes diagnosis (N=7,841,900): 1-17 years: 0.1. 18-34 years: 1.6. 35-49 years: 9.1. 50-64 years: 29.7. 65-84 years: 49.7. 85+ years: 9.8. No diagnosis of diabetes (N=19,275,200): 1-17 years: 5.9. 18-34 years: 11.3. 35-49 years: 14.3. 50-64 years: 24.3. 65-84 years: 33.2. 85+ years: 10.9.
|
|
| Table 1. Characteristics of nonmaternal inpatient stays involving diabetes, compared with those without a diabetes diagnosis, 2018 | |||
| Characteristic | Any type 1 diabetes diagnosis | Any type 2 diabetes diagnosis | No diagnosis of diabetes |
|---|---|---|---|
| Total, N | 377,900 | 7,841,900 | 19,275,200 |
| Male, % | 49.8 | 51.2 | 48.2 |
| Expected payer, % | |||
| Medicare | 31.7 | 65.7 | 47.7 |
| Medicaid | 30.4 | 11.9 | 17.8 |
| Private insurance | 27.6 | 16.9 | 26.1 |
| Self-pay/No charge* | 7.5 | 3.1 | 5.2 |
| Other | 2.7 | 2.3 | 3.1 |
| Community income, % | |||
| Quartile 1 (lowest) | 32.0 | 32.9 | 28.0 |
| Quartile 2 | 27.6 | 27.3 | 26.3 |
| Quartile 3 | 22.6 | 22.2 | 23.6 |
| Quartile 4 (highest) | 16.0 | 15.8 | 20.2 |
| Race/ethnicity, % | |||
| Asian/Pacific Islander | 1.2 | 2.8 | 2.1 |
| Black | 19.6 | 17.5 | 13.5 |
| Hispanic | 10.5 | 12.2 | 9.6 |
| White | 62.7 | 61.6 | 68.7 |
| Other | 3.3 | 3.7 | 3.4 |
| Location of residence, % | |||
| Metro | 82.8 | 82.4 | 83.1 |
| Rural, metro-adjacent | 11.0 | 11.5 | 10.7 |
| Rural, remote | 5.6 | 5.7 | 5.5 |
| Notes: Stays were categorized based on all-listed diagnoses as having type 1 diabetes or type 2 diabetes, excluding the following: stays with any diagnosis of diabetes due to an underlying condition, diabetes that was drug or chemical induced, or other specified type (N=54,500); stays with codes for both type 1 and type 2 diabetes (N=6,000); and stays with a diagnosis of diabetes where the codes on the record were not specific enough to categorize the patient as having type 1 or type 2 diabetes (N=1,000). Number of stays is rounded to the nearest hundred. Percentages are calculated from unrounded values. Less than 3% of stays were missing data on race/ethnicity, less than 2% of stays were missing data on community income, and less than 1% of stays were missing data on expected payer and location of residence. No stays were missing data on sex. * Self-pay/No charge: includes self-pay, no charge, charity, and no expected payment. Source: Agency for Healthcare Research and Quality (AHRQ), Healthcare Cost and Utilization Project (HCUP), National Inpatient Sample (NIS), 2018 | |||
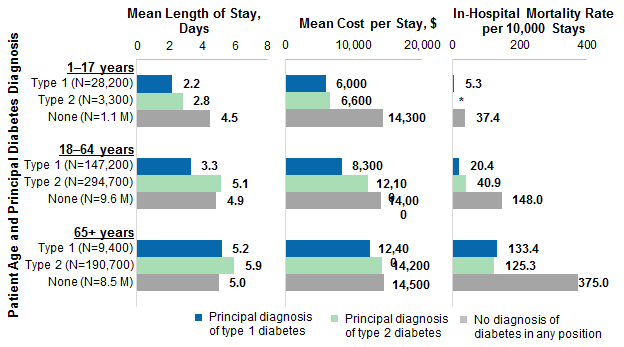
Figure 2 displays the mean length of stay, mean cost per stay, and rate of in-hospital deaths per 10,000 stays, by patient age group, for stays with a principal diagnosis of type 1 or type 2 diabetes in 2018. These statistics also are shown for stays without any diagnosis of diabetes in any position. |
|
Figure 2. Outcomes of nonmaternal stays among patients hospitalized for diabetes, compared with those without a diabetes diagnosis, 2018
Abbreviation: M, million Bar chart that shows the mean length of stay in days, mean cost per stay, and in-hospital mortality rate per 10,000 stays, by patient age group, for stays with a principal diagnosis of type 1 or type 2 diabetes, versus stays without a diabetes diagnosis, in 2018. Data are provided in Supplemental Table 1.
|
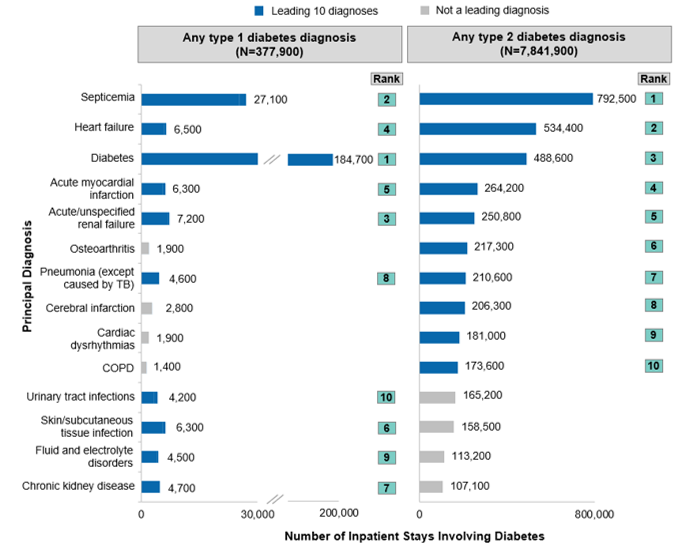
Figure 3 displays the top 10 principal diagnoses (i.e., the primary reason for hospitalization) for all stays involving type 1 or type 2 diabetes in 2018. The conditions are sorted by the volume of stays involving Type 2 diabetes. |
|
Figure 3. Top 10 reasons for hospitalization for stays involving type 1 or type 2 diabetes, 2018
Abbreviations: COPD, chronic obstructive pulmonary disease; TB, tuberculosis
Bar chart that shows the top 10 reasons for stays involving type 1 or type 2 diabetes in 2018. Data are provided in Supplemental Table 2. |
|
| Table 2. Top 10 comorbidities for nonmaternal stays with a principal diagnosis of diabetes, 2018 | ||||
| Secondary diagnosis | Principal diagnosis of type 1 diabetes (N=184,700) | Principal diagnosis of type 2 diabetes (N=488,600) | ||
|---|---|---|---|---|
| Rank | % | Rank | % | |
| Disorders of lipid metabolism | 6 | 20.1 | 1 | 49.7 |
| Fluid and electrolyte disorders | 1 | 59.1 | 2 | 44.8 |
| Hypertension with complications* | —† | —† | 3 | 41.1 |
| Essential hypertension | 5 | 21.2 | 4 | 40.1 |
| Chronic kidney disease | 10 | 16.4 | 5 | 35.8 |
| Pressure ulcer of skin | —† | —† | 6 | 34.7 |
| Nonpressure ulcer of skin | —† | —† | 7 | 31.3 |
| Coronary atherosclerosis* | —† | —† | 8 | 29.3 |
| Acute/unspecified renal failure | 2 | 29.3 | 9 | 28.6 |
| Skin/subcutaneous tissue infections | —† | —† | 10 | 28.2 |
| Tobacco-related disorders | 3 | 25.9 | —† | —† |
| Polyneuropathies | 4 | 25.0 | —† | —† |
| Depressive disorders | 7 | 17.1 | —† | —† |
| Implant, device or graft encounter | 8 | 17.1 | —† | —† |
| Esophageal disorders | 9 | 16.7 | —† | —† |
| Notes: Stays were categorized based on all-listed diagnoses as having type 1 diabetes or type 2 diabetes, excluding the following: stays with any diagnosis of diabetes due to an underlying condition, diabetes that was drug or chemical induced, or other specified type (N=54,500); stays with codes for both type 1 and type 2 diabetes (N=6,000); and stays with a diagnosis of diabetes where the codes on the record were not specific enough to categorize the patient as having type 1 or type 2 diabetes (N=1,000). Diagnoses are grouped according to the Clinical Classifications Software Refined (CCSR) for ICD-10-CM Diagnoses version 2021.1. Secondary diagnoses of diabetes and unspecific diagnoses, including Other specified status (81.0% and 80.5% of stays principally for type 1 or type 2 diabetes, respectively), Other specified and unspecified disorders of stomach and duodenum (17.9% of stays principally for type 1 diabetes), and Personal/family history of disease (32.9% and 43.0% of stays principally for type 1 or type 2 diabetes respectively), are not shown, although they ranked among the leading 10 diagnoses. Number of stays is rounded to the nearest hundred. Percentages are calculated from unrounded values. * Full descriptions of the CCSR category: Hypertension with complications and secondary hypertension; Coronary atherosclerosis and other heart disease. † Not in the top 10 diagnoses. Source: Agency for Healthcare Research and Quality (AHRQ), Healthcare Cost and Utilization Project (HCUP), National Inpatient Sample (NIS), 2018 | ||||
1 Centers for Disease Control and Prevention. National Diabetes Statistics Report, 2020. 2020. www.diabetesresearch.org/file/national-diabetes-statistics-report-2020.pdf. 2 Centers for Disease Control and Prevention. Diabetes. Page last reviewed June 11, 2020. www.cdc.gov/diabetes/basics/diabetes.html. Accessed March 16, 2021. 3 World Health Organization. Diabetes. April 13, 2021. www.who.int/news-room/fact-sheets/detail/diabetes. About Statistical Briefs Healthcare Cost and Utilization Project (HCUP) Statistical Briefs provide basic descriptive statistics on a variety of topics using HCUP administrative healthcare data. Topics include hospital inpatient, ambulatory surgery, and emergency department use and costs, quality of care, access to care, medical conditions, procedures, and patient populations, among other topics. The reports are intended to generate hypotheses that can be further explored in other research; the reports are not designed to answer in-depth research questions using multivariate methods. Data Source The estimates in this Statistical Brief are based upon data from the Healthcare Cost and Utilization Project (HCUP) 2018 National Inpatient Sample (NIS). Definitions Diagnoses, ICD-10-CM, Clinical Classifications Software Refined (CCSR) for ICD-10-CM Diagnoses and Major Diagnostic Categories (MDCs) The principal diagnosis is that condition established after study to be chiefly responsible for the patient's admission to the hospital. Secondary diagnoses are conditions that coexist at the time of admission that require or affect patient care treatment received or management, or that develop during the inpatient stay. All-listed diagnoses include the principal diagnosis plus the secondary conditions. ICD-10-CM is the International Classification of Diseases, Tenth Revision, Clinical Modification. In October 2015, ICD-10-CM replaced the International Classification of Diseases, Ninth Revision, Clinical Modification (ICD-9-CM) diagnosis coding system for most inpatient and outpatient medical encounters. There are over 70,000 ICD-10-CM diagnosis codes. The CCSR aggregates ICD-10-CM diagnosis codes into a manageable number of clinically meaningful categories.b The CCSR is intended to be used analytically to examine patterns of healthcare in terms of cost, utilization, and outcomes; rank utilization by diagnoses; and risk-adjust by clinical condition. The CCSR capitalizes on the specificity of the ICD-10-CM coding scheme and allows ICD-10-CM codes to be classified in more than one category. Approximately 10 percent of diagnosis codes are associated with more than one CCSR category because the diagnosis code documents either multiple conditions or a condition along with a common symptom or manifestation. For this Statistical Brief, the principal diagnosis code is assigned to a single default CCSR based on clinical coding guidelines, etiology and pathology of diseases, and standards set by other Federal agencies. The assignment of the default CCSR for the principal diagnosis is available starting with version v2020.2 of the software tool. ICD-10-CM coding definitions for each CCSR category presented in this Statistical Brief can be found in the CCSR reference file, available at www.hcup-us.ahrq.gov/toolssoftware/ccsr/ccs_refined.jsp#download. For this Statistical Brief, v2021.1 of the CCSR was used. MDCs assign ICD-10-CM principal diagnosis codes to 1 of 25 general diagnosis categories. Case definition The CCSR categories that define diabetes are:
Types of hospitals included in the HCUP National (Nationwide) Inpatient Sample The National (Nationwide) Inpatient Sample (NIS) is based on data from community hospitals, which are defined as short-term, non-Federal, general, and other hospitals, excluding hospital units of other institutions (e.g., prisons). The NIS includes obstetrics and gynecology, otolaryngology, orthopedic, cancer, pediatric, public, and academic medical center hospitals. Excluded are long-term care facilities such as rehabilitation, psychiatric, and alcoholism and chemical dependency hospitals. Beginning in 2012, long-term acute care hospitals are also excluded. However, if a patient received long-term care, rehabilitation, or treatment for a psychiatric or chemical dependency condition in a community hospital, the discharge record for that stay will be included in the NIS. Unit of analysis The unit of analysis is the hospital discharge (i.e., the hospital stay), not a person or patient. This means that a person who is admitted to the hospital multiple times in 1 year will be counted each time as a separate discharge from the hospital. Costs and charges Total hospital charges were converted to costs using HCUP Cost-to-Charge Ratios based on hospital accounting reports from the Centers for Medicare & Medicaid Services (CMS).c Costs reflect the actual expenses incurred in the production of hospital services, such as wages, supplies, and utility costs; charges represent the amount a hospital billed for the case. For each hospital, a hospital-wide cost-to-charge ratio is used. Hospital charges reflect the amount the hospital billed for the entire hospital stay and do not include professional (physician) fees. For the purposes of this Statistical Brief, costs are reported to the nearest hundred dollars. Location of patients' residence Place of residence is based on the rural-urban continuum codes (RUCC) for U.S. counties developed by the United States Department of Agriculture (USDA).d RUCC classifies metropolitan counties by population size and nonmetropolitan counties by the size of the urban population and whether the county is adjacent or not adjacent to a metropolitan area. For this Statistical Brief, we collapsed the RUCC codes into the following three categories: Metropolitan (metro) area:
Community-level income is based on the median household income of the patient's ZIP Code of residence. Quartiles are defined so that the total U.S. population is evenly distributed. Cut-offs for the quartiles are determined annually using ZIP Code demographic data obtained from Claritas, a vendor that produces population estimates and projections based on data from the U.S. Census Bureau.e The value ranges for the income quartiles vary by year. The income quartile is missing for patients who are homeless or foreign. Expected payer To make coding uniform across all HCUP data sources, the primary expected payer for the hospital stay combines detailed categories into general groups:
For this Statistical Brief, when more than one payer is listed for a hospital discharge, the first-listed payer is used. Discharge status Discharge status reflects the disposition of the patient at discharge from the hospital and includes whether the patient died in the hospital. Reporting of race and ethnicity Data on Hispanic ethnicity are collected differently among the States and also can differ from the census methodology of collecting information on race (White, Black, Asian/Pacific Islander, American Indian/Alaska Native, Other [including mixed race]) separately from ethnicity (Hispanic, non-Hispanic). State data organizations often collect Hispanic ethnicity as one of several categories that include race. Therefore, for multistate analyses, HCUP creates the combined categorization of race and ethnicity for data from States that report ethnicity separately. When a State data organization collects Hispanic ethnicity separately from race, HCUP uses Hispanic ethnicity to override any other race category to create a Hispanic category for the uniformly coded race/ethnicity data element, while also retaining the original race and ethnicity data. This Statistical Brief reports race/ethnicity for the following categories: non-Hispanic Asian/Pacific Islander, non-Hispanic Black, Hispanic, non-Hispanic White, and non-Hispanic Other. About HCUP The Healthcare Cost and Utilization Project (HCUP, pronounced "H-Cup") is a family of healthcare databases and related software tools and products developed through a Federal-State-Industry partnership and sponsored by the Agency for Healthcare Research and Quality (AHRQ). HCUP databases bring together the data collection efforts of State data organizations, hospital associations, and private data organizations (HCUP Partners) and the Federal government to create a national information resource of encounter-level healthcare data. HCUP includes the largest collection of longitudinal hospital care data in the United States, with all-payer, encounter-level information beginning in 1988. These databases enable research on a broad range of health policy issues, including cost and quality of health services, medical practice patterns, access to healthcare programs, and outcomes of treatments at the national, State, and local market levels. HCUP would not be possible without the contributions of the following data collection Partners from across the United States: |
|
Alaska Department of Health and Social Services
Alaska State Hospital and Nursing Home Association Arizona Department of Health Services Arkansas Department of Health California Office of Statewide Health Planning and Development Colorado Hospital Association Connecticut Hospital Association Delaware Division of Public Health District of Columbia Hospital Association Florida Agency for Health Care Administration Georgia Hospital Association Hawaii Laulima Data Alliance Hawaii University of Hawai'i at Hilo Illinois Department of Public Health Indiana Hospital Association Iowa Hospital Association Kansas Hospital Association Kentucky Cabinet for Health and Family Services Louisiana Department of Health Maine Health Data Organization Maryland Health Services Cost Review Commission Massachusetts Center for Health Information and Analysis Michigan Health & Hospital Association Minnesota Hospital Association Mississippi State Department of Health Missouri Hospital Industry Data Institute |
Montana Hospital Association Nebraska Hospital Association Nevada Department of Health and Human Services New Hampshire Department of Health & Human Services New Jersey Department of Health New Mexico Department of Health New York State Department of Health North Carolina Department of Health and Human Services North Dakota (data provided by the Minnesota Hospital Association) Ohio Hospital Association Oklahoma State Department of Health Oregon Association of Hospitals and Health Systems Oregon Office of Health Analytics Pennsylvania Health Care Cost Containment Council Rhode Island Department of Health South Carolina Revenue and Fiscal Affairs Office South Dakota Association of Healthcare Organizations Tennessee Hospital Association Texas Department of State Health Services Utah Department of Health Vermont Association of Hospitals and Health Systems Virginia Health Information Washington State Department of Health West Virginia Department of Health and Human Resources, West Virginia Health Care Authority Wisconsin Department of Health Services Wyoming Hospital Association |
|
About the NIS
The HCUP National (Nationwide) Inpatient Sample (NIS) is a nationwide database of hospital inpatient stays. The NIS is nationally representative of all community hospitals (i.e., short-term, non-Federal, nonrehabilitation hospitals). The NIS includes all payers. It is drawn from a sampling frame that contains hospitals comprising more than 95 percent of all discharges in the United States. The vast size of the NIS allows the study of topics at the national and regional levels for specific subgroups of patients. In addition, NIS data are standardized across years to facilitate ease of use. Over time, the sampling frame for the NIS has changed; thus, the number of States contributing to the NIS varies from year to year. The NIS is intended for national estimates only; no State-level estimates can be produced. The unweighted sample size for the 2018 NIS is 7,105,498 (weighted, this represents 35,527,481 inpatient stays). For More Information For other information on diabetes, refer to the HCUP Statistical Briefs located at www.hcup-us.ahrq.gov/reports/statbriefs/sb_diabetes.jsp. For additional HCUP statistics, visit:
For a detailed description of HCUP and more information on the design of the National Inpatient Sample (NIS), please refer to the following database documentation: Agency for Healthcare Research and Quality. Overview of the National (Nationwide) Inpatient Sample (NIS). Healthcare Cost and Utilization Project (HCUP). Rockville, MD: Agency for Healthcare Research and Quality. Updated December 2020. www.hcup-us.ahrq.gov/nisoverview.jsp. Accessed January 22, 2021. Suggested Citation Fingar KR (IBM Watson Health), Reid LD (AHRQ). Diabetes-Related Inpatient Stays, 2018. HCUP Statistical Brief #279. July 2021. Agency for Healthcare Research and Quality, Rockville, MD. www.hcup-us.ahrq.gov/reports/statbriefs/sb279-Diabetes-Inpatient-Stays-2018.pdf. Acknowledgments The authors would like to acknowledge the contributions of Minya Sheng and Timothy Burrell of IBM Watson Health and Asako Moriya of the Agency for Healthcare Research and Quality. *** AHRQ welcomes questions and comments from readers of this publication who are interested in obtaining more information about access, cost, use, financing, and quality of healthcare in the United States. We also invite you to tell us how you are using this Statistical Brief and other HCUP data and tools, and to share suggestions on how HCUP products might be enhanced to further meet your needs. Please email us at hcup@ahrq.gov or send a letter to the address below:Joel W. Cohen, Ph.D., Director Center for Financing, Access and Cost Trends Agency for Healthcare Research and Quality 5600 Fishers Lane Rockville, MD 20857 This Statistical Brief was posted online on July 27, 2021. a It can be challenging to distinguish between pre-existing diabetes (chronic disease) and gestational diabetes (which resolves postpartum) in certain datasets and this is especially true when the condition is first detected during pregnancy itself. Since diabetes during pregnancy is a unique condition with predictable metabolic changes, including inherent insulin resistance, it may be appropriate to analyze this subpopulation separately. Thus, this Statistical Brief excludes maternal stays, including those with pre-existing diabetes (type 1 or type 2) or with gestational diabetes, both of which have unique concerns for the mother and infant that are different from diabetes occurring among nonmaternal stays. b Agency for Healthcare Research and Quality. HCUP Clinical Classifications Software Refined (CCSR) for ICD-10-CM Diagnoses. Healthcare Cost and Utilization Project (HCUP). Agency for Healthcare Research and Quality. Updated November 2020. www.hcup-us.ahrq.gov/toolssoftware/ccsr/ccs_refined.jsp. Accessed January 22, 2021. c Agency for Healthcare Research and Quality. HCUP Cost-to-Charge Ratio (CCR) Files. Healthcare Cost and Utilization Project (HCUP). 2001–2017. Agency for Healthcare Research and Quality. Updated September 2020. www.hcup-us.ahrq.gov/db/state/costtocharge.jsp. Accessed January 22, 2021. d United States Department of Agriculture. Rural-Urban Continuum Codes. www.ers.usda.gov/data-products/rural-urban-continuum-codes/. Accessed January 22, 2021. |
| Supplemental Table 1. Outcomes of nonmaternal stays among patients hospitalized for diabetes, compared with those without a diabetes diagnosis, 2018, for data presented in Figure 2 | |||
| Patient age and principal diabetes diagnosis | Mean length of stay, days | Mean cost per stay, $ | In-hospital mortality rate per 10,000 stays |
|---|---|---|---|
| 1-17 years | |||
| Type 1 (N=28,200) | 2.2 | 6,000 | 5.3 |
| Type 2 (N=3,300) | 2.8 | 6,600 | * |
| None (N=1.1 M) | 4.5 | 14,300 | 37.4 |
| 18-64 years | |||
| Type 1 (N=147,200) | 3.3 | 8,300 | 20.4 |
| Type 2 (N=294,700) | 5.1 | 12,100 | 40.9 |
| None (N=9.6 M) | 4.9 | 14,000 | 148.0 |
| 65+ years | |||
| Type 1 (N=9,400) | 5.2 | 12,400 | 133.4 |
| Type 2 (N=190,700) | 5.9 | 14,200 | 125.3 |
| None (N=8.5 M) | 5.0 | 14,500 | 375.0 |
| Abbreviation: M, million * Not shown because there were fewer than 11 in-hospital deaths in this group. |
|||
| Supplemental Table 2. Top 10 reasons for hospitalization for stays involving type 1 or type 2 diabetes, 2018, for data presented in Figure 3 | ||||
| Principal diagnosis | Any type 1 diabetes diagnosis | Any type 2 diabetes diagnosis | ||
|---|---|---|---|---|
| Number of stays (N=377,900) | Top 10 rank | Number of stays (N=7,841,900) | Top 10 rank | |
| Septicemia | 27,100 | 2 | 792,500 | 1 |
| Heart failure | 6,500 | 4 | 534,400 | 2 |
| Diabetes | 184,700 | 1 | 488,600 | 3 |
| Acute myocardial infarction | 6,300 | 5 | 264,200 | 4 |
| Acute and unspecified renal failure | 7,200 | 3 | 250,800 | 5 |
| Osteoarthritis | 1,900 | - | 217,300 | 6 |
| Pneumonia (except that caused by tuberculosis) | 4,600 | 8 | 210,600 | 7 |
| Cerebral infarction | 2,800 | - | 206,300 | 8 |
| Cardiac dysrhythmias | 1,900 | - | 181,000 | 9 |
| Chronic obstructive pulmonary disease and bronchiectasis | 1,400 | - | 173,600 | 10 |
| Urinary tract infections | 4,200 | 10 | 165,200 | - |
| Skin and subcutaneous tissue infections | 6,300 | 6 | 158,500 | - |
| Fluid and electrolyte disorders | 4,500 | 9 | 113,200 | - |
| Chronic kidney disease | 4,700 | 7 | 107,100 | - |