|
STATISTICAL BRIEF #278
July 2021
Audrey J. Weiss, Ph.D., and H. Joanna Jiang, Ph.D. Introduction Hospital readmissions are a leading healthcare concern, both in terms of implications for the quality of care provided to hospitalized patients and for the healthcare costs associated with readmission. Some readmissions, such as those for cancer and related treatment, are expected and planned, but many readmissions are not. Hospitals, health systems, and payers have implemented a variety of strategies, such as care coordination and patient education, to reduce preventable readmissions. National statistics about the clinical conditions with the highest number and rate of readmissions and the highest readmission costs can help identify areas of focus for initiatives aimed at reducing preventable readmissions. This Healthcare Cost and Utilization Project (HCUP) Statistical Brief presents statistics on hospital inpatient conditions with high frequency and cost of readmissions among adults (aged 18 years and older) by expected payer using the 2018 Nationwide Readmissions Database (NRD). A readmission was defined as a subsequent hospital admission for any cause within 30 days following an initial stay (index admission) between January and November 2018. Three readmission metrics are presented overall and by expected payer: (1) conditions with the highest number of readmissions, (2) conditions with the highest readmission rate, and (3) conditions with the highest average readmission cost. The expected payer and condition (principal diagnosis) are based on the index admission. Index admissions for cancer and cancer-related therapies are included in overall readmission statistics but are not reported in condition-specific statistics. Findings Overview of adult hospital readmissions by expected payer, 2018 Figure 1 presents three sets of statistics, overall and by expected payer, on 30-day all-cause adult hospital readmissions: the number of readmissions, the readmission rate, and the average cost of readmissions. |
|
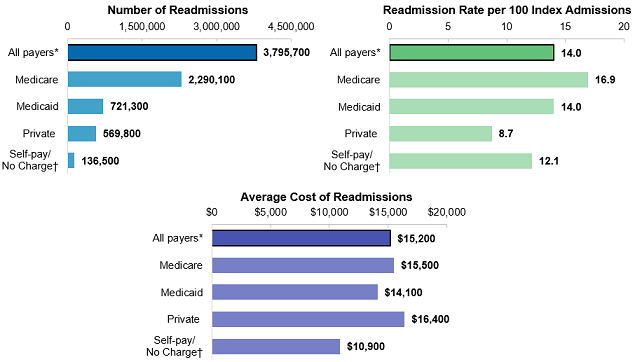
Figure 1. Number, rate, and average cost of 30-day all-cause adult hospital readmissions, by expected payer, 2018
Note: Number of readmissions is rounded to the nearest hundred. Average cost of readmission is rounded to the nearest $100. Bar chart that shows the number of readmissions, the readmission rate, and the average cost of readmissions for adults in 2018 by expected payer. Data are provided in Supplemental Table 1. |
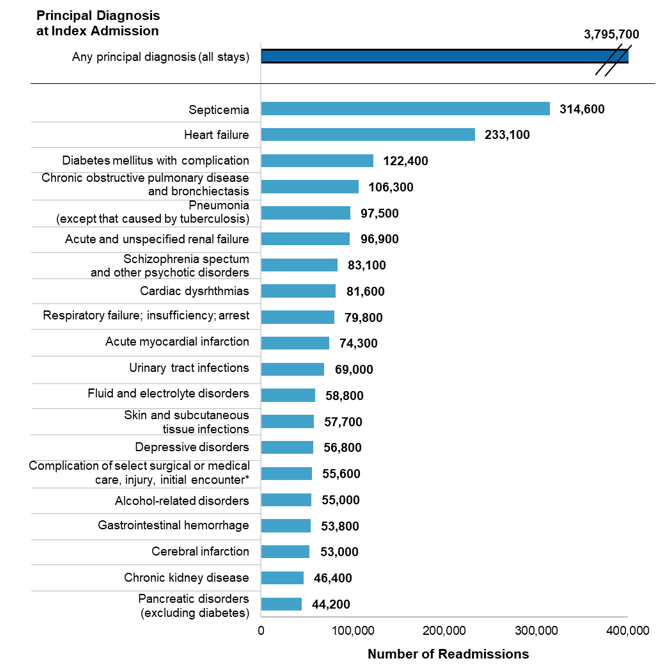
Figure 2 presents the 20 principal diagnoses (conditions) at index admission with the highest number of 30-day all-cause hospital readmissions among adults in 2018. |
|
Figure 2. Top 20 principal diagnoses with the highest number of 30-day all-cause adult hospital readmissions, 2018
Abbreviation: ICD-10-CM, International Classification of Diseases, Tenth Revision, Clinical Modification Bar chart that shows the 20 principal diagnoses at index admission with the most 30-day all-cause readmissions among adults in 2018. Any principal diagnosis (all stays): 3,795,700 readmissions. Septicemia: 314,600. Heart failure: 233,100. Diabetes mellitus with complication: 122,400. Chronic obstructive pulmonary disease and bronchiectasis: 106,300. Pneumonia (except that caused by tuberculosis): 97,500. Acute and unspecified renal failure: 96,900. Schizophrenia spectrum and other psychotic disorders: 83,100. Cardiac dysrhythmias: 81,600. Respiratory failure; insufficiency; arrest: 79,800. Acute myocardial infarction: 74,300. Urinary tract infections: 69,000. Fluid and electrolyte disorders: 58,800. Skin and subcutaneous tissue infections: 57,700. Depressive disorders: 56,800. Complication of select surgical or medical care, injury, initial encounter (includes complications, such as infection, for surgical or medical care other than those from cardiovascular, genitourinary, or internal orthopedic devices or from organ/tissue transplants): 55,600. Alcohol-related disorders: 55,000. Gastrointestinal hemorrhage: 53,800. Cerebral infarction: 53,000. Chronic kidney disease: 46,400. Pancreatic disorders (excluding diabetes): 44,200. |
|
| Table 1. Top five principal diagnoses with the highest number of 30-day all-cause adult hospital readmissions, by expected payer, 2018 | |||||
| Principal diagnosis at index admission | Number of index admissions | 30-day readmissions | Percent of total payer-specific readmissions | ||
|---|---|---|---|---|---|
| Rank | Number | Rate* | |||
| Medicare | 13,533,200 | - | 2,290,100 | 16.9 | 100.0 |
| Septicemia | 1,144,300 | 1 | 213,900 | 18.7 | 9.3 |
| Heart failure | 775,900 | 2 | 178,000 | 22.9 | 7.8 |
| Chronic obstructive pulmonary disease and bronchiectasis | 387,600 | 3 | 78,000 | 20.1 | 3.4 |
| Pneumonia (except that caused by tuberculosis) | 437,000 | 4 | 73,800 | 16.9 | 3.2 |
| Acute and unspecified renal failure | 360,600 | 5 | 72,100 | 20.0 | 3.1 |
| Medicaid | 5,144,200 | - | 721,300 | 14.0 | 100.0 |
| Septicemia | 259,900 | 1 | 49,300 | 19.0 | 6.8 |
| Schizophrenia spectrum and other psychotic disorders | 166,100 | 2 | 39,300 | 23.7 | 5.4 |
| Diabetes mellitus with complication | 140,500 | 3 | 33,700 | 24.0 | 4.7 |
| Heart failure | 110,000 | 4 | 30,800 | 28.0 | 4.3 |
| Alcohol-related disorders | 113,800 | 5 | 24,600 | 21.6 | 3.4 |
| Private insurance | 6,532,900 | - | 569,800 | 8.7 | 100.0 |
| Septicemia | 281,900 | 1 | 37,600 | 13.3 | 6.6 |
| Heart failure | 89,400 | 2 | 15,800 | 17.6 | 2.8 |
| Diabetes mellitus with complication | 111,000 | 3 | 14,200 | 12.8 | 2.5 |
| Hypertension and hypertensive-related conditions complicating pregnancy; childbirth; and the puerperium | 171,700 | 4 | 11,100 | 6.4 | 1.9 |
| Complication of select surgical or medical care, injury, initial encounter† | 73,800 | 5 | 11,000 | 14.9 | 1.9 |
| Self-pay/No charge‡ | 1,123,700 | - | 136,500 | 12.1 | 100.0 |
| Septicemia | 71,000 | 1 | 8,600 | 12.2 | 6.3 |
| Alcohol-related disorders | 43,200 | 2 | 8,300 | 19.1 | 6.1 |
| Diabetes mellitus with complication | 47,000 | 3 | 8,100 | 17.2 | 5.9 |
| Depressive disorders | 51,900 | 4 | 7,500 | 14.5 | 5.5 |
| Heart failure | 27,900 | 5 | 5,100 | 18.2 | 3.7 |
| Abbreviation: ICD-10-CM, International Classification of Diseases, Tenth Revision, Clinical Modification Notes: Diagnoses are grouped using the Clinical Classifications Software Refined (CCSR) for ICD-10-CM Diagnoses. Principal diagnosis is assigned to a single default CCSR category. CCSR categories classified as "neoplasms" (cancer) or "factors influencing health status and contact with health services" (e.g., encounter for antineoplastic therapies) are excluded from reporting. A minimum volume threshold for index admissions was required for a CCSR category to be reported: 10,000 for Medicare, Medicaid, and private insurance and 5,000 for self-pay/no charge. Number of index admissions and readmissions are rounded to the nearest hundred. * Readmission rate is per 100 index admissions. † This includes complications, such as infection, for surgical or medical care other than those from cardiovascular, genitourinary, or internal orthopedic devices or from organ/tissue transplants. ‡ Self-pay/No charge: includes self-pay, no charge, charity, and no expected payment. Source: Agency for Healthcare Research and Quality (AHRQ), Healthcare Cost and Utilization Project (HCUP), Nationwide Readmissions Database (NRD), 2018 | |||||
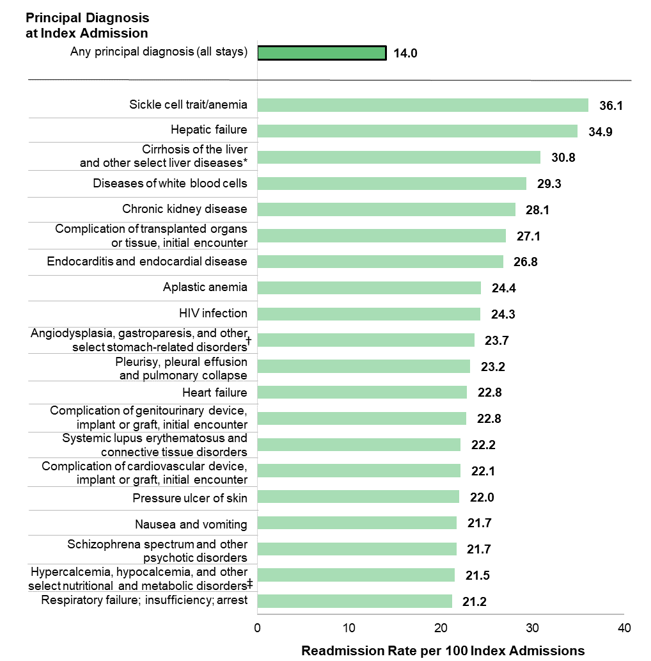
Figure 3 presents the 20 principal diagnoses (conditions) at index admission with the highest rate of 30-day all-cause hospital readmissions among adults in 2018. |
|
Figure 3. Top 20 principal diagnoses with the highest rate of 30-day all-cause adult hospital readmissions, 2018
Abbreviation: ICD-10-CM, International Classification of Diseases, Tenth Revision, Clinical Modification Bar chart that shows the 20 principal diagnoses at index admission with the highest rate of 30-day all-cause readmissions among adults in 2018. Any principal diagnosis (all stays): 14.0 per 100 index readmissions. Sickle cell trait/anemia: 36.1. Hepatic failure: 34.9. Cirrhosis of the liver and other select liver diseases (primarily includes cirrhosis of the liver as well as other liver diseases, excluding hepatic failure): 30.8. Diseases of white blood cells: 29.3. Chronic kidney disease: 28.1. Complication of transplanted organs or tissue, initial encounter: 27.1. Endocarditis and endocardial disease: 26.8. Aplastic anemia: 24.4. HIV infection: 24.3. Angiodysplasia, gastroparesis, and other select stomach-related disorders (primarily includes angiodysplasia of the stomach and duodenum, gastroparesis, and adult hypertrophic pyloric stenosis as well as other select disorders of the stomach and duodenum): 23.7. Pleurisy, pleural effusion and pulmonary collapse: 23.2. Heart failure: 22.8. Complication of genitourinary device, implant or graft, initial encounter: 22.8. Systemic lupus erythematosus and connective tissue disorders: 22.2. Complication of cardiovascular device, implant or graft, initial encounter: 22.1. Pressure ulcer of skin: 22.0. Nausea and vomiting: 21.7. Schizophrenia spectrum and other psychotic disorders: 21.7. Hypercalcemia, hypocalcemia, and other select nutritional and metabolic disorders (primarily includes hypercalcemia, hypocalcemia, hypomagnesemia, and organ-limited amyloidosis as well as other select nutritional and metabolic disorders): 21.5. Respiratory failure; insufficiency; arrest: 21.2. |
|
| Table 2. Top five principal diagnoses with the highest rate of 30-day all-cause adult hospital readmissions, by expected payer, 2018 | |||||
| Principal diagnosis at index admission | Number of index admissions | 30-day readmissions | Percent of total payer-specific readmissions | ||
|---|---|---|---|---|---|
| Rank | Rate* | Number | |||
| Medicare | 13,533,200 | - | 16.9 | 2,290,100 | 100.0 |
| Sickle cell trait/anemia | 25,400 | 1 | 37.2 | 9,400 | 0.4 |
| Hepatic failure | 39,700 | 2 | 34.9 | 13,900 | 0.6 |
| Cirrhosis of the liver and other select liver diseases† | 41,300 | 3 | 31.0 | 12,800 | 0.6 |
| Chronic kidney disease | 121,300 | 4 | 28.6 | 34,700 | 1.5 |
| Diseases of white blood cells | 13,100 | 5 | 27.6 | 3,600 | 0.2 |
| Medicaid | 5,144,200 | - | 14.0 | 721,300 | 100.0 |
| Sickle cell trait/anemia | 32,100 | 1 | 39.4 | 12,600 | 1.7 |
| Hepatic failure | 17,700 | 2 | 38.6 | 6,900 | 1.0 |
| Cirrhosis of the liver and other select liver diseases† | 29,900 | 3 | 35.1 | 10,500 | 1.5 |
| Chronic kidney disease | 22,200 | 4 | 32.5 | 7,200 | 1.0 |
| Heart failure | 110,000 | 5 | 28.0 | 30,800 | 4.3 |
| Private insurance | 6,532,900 | - | 8.7 | 569,800 | 100.0 |
| Hepatic failure | 12,100 | 1 | 31.9 | 3,800 | 0.7 |
| Cirrhosis of the liver and other select liver diseases† | 22,200 | 2 | 26.6 | 5,900 | 1.0 |
| Complication of transplanted organs or tissue, initial encounter | 10,300 | 3 | 26.0 | 2,700 | 0.5 |
| Chronic kidney disease | 16,500 | 4 | 19.7 | 3,200 | 0.6 |
| Pleurisy, pleural effusion and pulmonary collapse | 11,500 | 5 | 18.6 | 2,100 | 0.4 |
| Self-pay/No charge‡ | 1,123,700 | - | 12.1 | 136,500 | 100.0 |
| Cirrhosis of the liver and other select liver diseases† | 8,100 | 1 | 26.7 | 2,200 | 1.6 |
| Alcohol-related disorders | 43,200 | 2 | 19.1 | 8,300 | 6.1 |
| Schizophrenia spectrum and other psychotic disorders | 26,400 | 3 | 18.4 | 4,800 | 3.5 |
| Regional enteritis and ulcerative colitis | 5,400 | 4 | 18.3 | 1,000 | 0.7 |
| Heart failure | 27,900 | 5 | 18.2 | 5,100 | 3.7 |
| Abbreviation: ICD-10-CM, International Classification of Diseases, Tenth Revision, Clinical Modification Notes: Diagnoses are grouped using the Clinical Classifications Software Refined (CCSR) for ICD-10-CM Diagnoses. Principal diagnosis is assigned to a single default CCSR category. CCSR categories classified as "neoplasms" (cancer) or "factors influencing health status and contact with health services" (e.g., encounter for antineoplastic therapies) are excluded from reporting. A minimum volume threshold for index admissions was required for a CCSR category to be reported: 10,000 for Medicare, Medicaid, and private insurance and 5,000 for self-pay/no charge. Number of index admissions and readmissions are rounded to the nearest hundred. * Readmission rate is per 100 index admissions. † This primarily includes cirrhosis of the liver as well as other liver diseases, excluding hepatic failure. ‡ Self-pay/No charge: includes self-pay, no charge, charity, and no expected payment. Source: Agency for Healthcare Research and Quality (AHRQ), Healthcare Cost and Utilization Project (HCUP), Nationwide Readmissions Database (NRD), 2018 | |||||
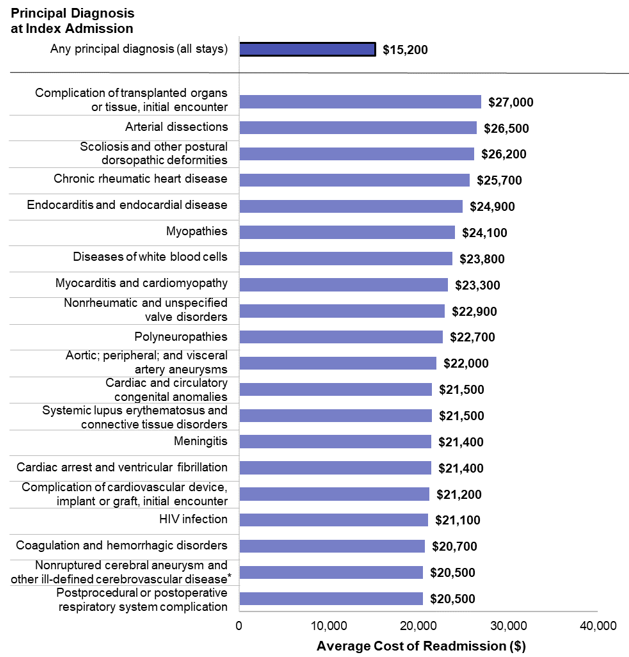
Figure 4 presents the 20 principal diagnoses (conditions) at index admission with the highest average cost of 30-day all-cause hospital readmissions among adults in 2018. |
|
Figure 4. Top 20 principal diagnoses with the highest average cost of 30-day all-cause adult hospital readmissions, 2018
Abbreviation: ICD-10-CM, International Classification of Diseases, Tenth Revision, Clinical Modification Bar chart that shows the 20 principal diagnoses at index admission with the highest average cost of 30-day all-cause hospital readmissions among adults in 2018. Any principal diagnosis (all stays): $15,200. Complication of transplanted organs or tissue, initial encounter: $27,000. Arterial dissections: $26,500. Scoliosis and other postural dorsopathic deformities: $26,200. Chronic rheumatic heart disease: $25,700. Endocarditis and endocardial disease: $24,900. Myopathies: $24,100. Diseases of white blood cells: $23,800. Myocarditis and cardiomyopathy: $23,300. Nonrheumatic and unspecified valve disorders: $22,900. Polyneuropathies: $22,700. Aortic; peripheral; and visceral artery aneurysms: $22,000. Cardiac and circulatory congenital anomalies: $21,500. Systemic lupus erythematosus and connective tissue disorders: $21,500. Meningitis: $21,400. Cardiac arrest and ventricular fibrillation: $21,400. Complication of cardiovascular device, implant or graft, initial encounter: $21,200. HIV infection: $21,100. Coagulation and hemorrhagic disorders: $20,700. Nonruptured cerebral aneurysm and other ill-defined cerebrovascular disease (primarily includes nonruptured cerebral aneurysm and posterior reversible encephalopathy as well as other select and ill-defined cerebrovascular disease): $20,500. Postprocedural or postoperative respiratory system complication: $20,500. |
|
| Table 3. Top five principal diagnoses with the highest average cost of 30-day all-cause adult hospital readmissions, by expected payer, 2018 | |||||
| Principal diagnosis at index admission | Number of index admissions | 30-day readmissions | Percent of total payer-specific readmission costs | ||
|---|---|---|---|---|---|
| Rank | Average cost, $ | Aggregate cost, $ millions | |||
| Medicare | 13,533,200 | - | 15,500 | 35,500 | 100.0 |
| Chronic rheumatic heart disease | 16,100 | 1 | 25,800 | 87 | 0.2 |
| Complication of transplanted organs or tissue, initial encounter | 27,100 | 2 | 24,200 | 180 | 0.5 |
| Nonrheumatic and unspecified valve disorders | 96,000 | 3 | 22,500 | 359 | 1.0 |
| Diseases of white blood cells | 13,100 | 4 | 21,800 | 79 | 0.2 |
| Aortic; peripheral; and visceral artery aneurysms | 45,000 | 5 | 21,300 | 121 | 0.3 |
| Medicaid | 5,144,200 | - | 14,100 | 10,200 | 100.0 |
| Acute hemorrhagic cerebrovascular disease | 11,0000 | 1 | 23,500 | 34 | 0.3 |
| Complication of cardiovascular device, implant or graft, initial encounter | 19,000 | 2 | 22,000 | 108 | 1.1 |
| Septicemia | 259,900 | 3 | 19,800 | 976 | 9.6 |
| Complication of internal orthopedic device or implant, initial encounter | 14,500 | 4 | 19,700 | 42 | 0.4 |
| Complication of select surgical or medical care, injury, initial encounter* | 47,000 | 5 | 19,600 | 193 | 1.9 |
| Private insurance | 6,532,900 | - | 16,400 | 9,400 | 100.0 |
| Complication of transplanted organs or tissue, initial encounter | 10,300 | 1 | 31,200 | 84 | 0.9 |
| Complication of cardiovascular device, implant or graft, initial encounter | 21,000 | 2 | 26,000 | 90 | 1.0 |
| Acute hemorrhagic cerebrovascular disease | 19,000 | 3 | 24,800 | 53 | 0.6 |
| Aortic; peripheral; and visceral artery aneurysms | 10,200 | 4 | 24,000 | 25 | 0.3 |
| Heart failure | 89,400 | 5 | 23,500 | 370 | 3.9 |
| Self-pay/No charge† | 1,123,700 | - | 10,900 | 1,500 | 100.0 |
| Traumatic brain injury (TBI); concussion, initial encounter | 7,700 | 1 | 18,200 | 10 | 0.7 |
| Complication of select surgical or medical care, injury, initial encounter* | 7,500 | 2 | 16,100 | 21 | 1.4 |
| Fracture of the lower limb (except hip), initial encounter | 12,500 | 3 | 15,800 | 16 | 1.1 |
| Septicemia | 71,000 | 4 | 15,000 | 129 | 8.6 |
| Acute myocardial infarction | 26,500 | 5 | 15,000 | 33 | 2.2 |
| Abbreviation: ICM-10-CM, International Classification of Diseases, Tenth Revision, Clinical Modification Notes: Diagnoses are grouped using the Clinical Classifications Software Refined (CCSR) for ICD-10-CM Diagnoses. Principal diagnosis is assigned to a single default CCSR category. CCSR categories classified as "neoplasms" (cancer) or "factors influencing health status and contact with health services" (e.g., encounter for antineoplastic therapies) are excluded from reporting. A minimum volume threshold for index admissions was required for a CCSR category to be reported: 10,000 for Medicare, Medicaid, and private insurance and 5,000 for self-pay/no charge. Number of index admissions is rounded to the nearest hundred. Average cost of readmission is rounded to the nearest $100. * This includes complications, such as infection, for surgical or medical care other than those from cardiovascular, genitourinary, or internal orthopedic devices or from organ/tissue transplants. † Self-pay/No charge: includes self-pay, no charge, charity, and no expected payment. Source: Agency for Healthcare Research and Quality (AHRQ), Healthcare Cost and Utilization Project (HCUP), Nationwide Readmissions Database (NRD), 2018 | |||||
Healthcare Cost and Utilization Project (HCUP) Statistical Briefs provide basic descriptive statistics on a variety of topics using HCUP administrative healthcare data. Topics include hospital inpatient, ambulatory surgery, and emergency department use and costs, quality of care, access to care, medical conditions, procedures, and patient populations, among other topics. The reports are intended to generate hypotheses that can be further explored in other research; the reports are not designed to answer in-depth research questions using multivariate methods. Data Source The estimates in this Statistical Brief are based upon data from the HCUP 2018 Nationwide Readmissions Database (NRD). Definitions Diagnoses, ICD-10-CM, Clinical Classifications Software Refined (CCSR) for ICD-10-CM Diagnoses, and diagnosis-related groups (DRGs) The principal diagnosis is that condition established after study to be chiefly responsible for the patient's admission to the hospital. Secondary diagnoses are conditions that coexist at the time of admission that require or affect patient care treatment received or management, or that develop during the inpatient stay. All-listed diagnoses include the principal diagnosis plus the secondary conditions. ICD-10-CM is the International Classification of Diseases, Tenth Revision, Clinical Modification. There are over 70,000 ICD-10-CM diagnosis codes. The CCSR aggregates ICD-10-CM diagnosis codes into a manageable number of clinically meaningful categories.a The CCSR is intended to be used analytically to examine patterns of healthcare in terms of cost, utilization, and outcomes; rank utilization by diagnoses; and risk-adjust by clinical condition. The CCSR capitalizes on the specificity of the ICD-10-CM coding scheme and allows ICD-10-CM codes to be classified in more than one category. Approximately 10 percent of diagnosis codes are associated with more than one CCSR category because the diagnosis code documents either multiple conditions or a condition along with a common symptom or manifestation. For this Statistical Brief, the principal diagnosis code is assigned to a single default CCSR based on clinical coding guidelines, etiology and pathology of diseases, and standards set by other Federal agencies. The assignment of the default CCSR for the principal diagnosis is available starting with version v2020.2 of the software tool. ICD-10-CM coding definitions for each CCSR category presented in this Statistical Brief can be found in the CCSR reference file, available at www.hcup-us.ahrq.gov/toolssoftware/ccsr/ccs_refined.jsp#download. For this Statistical Brief, v2021.1 of the CCSR was used. DRGs comprise a patient classification system that categorizes patients into groups that are clinically coherent and homogeneous with respect to resource use. DRGs group patients according to diagnosis, type of treatment (procedure), age, and other relevant criteria. Each hospital stay has one assigned DRG. Readmissions The 30-day readmission rate is defined as the number of admissions for each condition for which there was at least one subsequent hospital admission within 30 days, divided by the total number of admissions from January through November of the same year. That is, when patients are discharged from the hospital, they are followed for 30 days in the data. If any readmission to the same or different hospital occurs during this time period, the admission is counted as having a readmission. No more than one readmission is counted within the 30-day period, because the outcome measure assessed is "percentage of admissions that are readmitted." If a patient was transferred to a different hospital on the same day or was transferred within the same hospital, the two events were combined as a single stay and the second event was not counted as a readmission; that is, transfers were not considered a readmission. In the case of admissions for which there was more than one readmission in the 30-day period, the data presented in this Statistical Brief reflect the characteristics and costs of the first readmission. Every qualifying hospital stay is counted as a separate initial (starting point) admission. Thus, a single patient can be counted multiple times during the course of the January through November observation period. In addition, initial admissions do not require a prior "clean period" with no hospitalizations; that is, a hospital stay may be a readmission for a prior stay and the initial admission for a subsequent readmission. Admissions were disqualified from the analysis as initial admissions if they could not be followed for 30 days for one of the following reasons: (1) the patient died in the hospital, (2) information on length of stay was missing, or (3) the patient was discharged in December. Types of hospitals included in the HCUP Nationwide Readmissions Database The Nationwide Readmissions Database (NRD) is based on data from community hospitals, which are defined as short-term, non-Federal, general, and other hospitals, excluding hospital units of other institutions (e.g., prisons). The NRD includes obstetrics and gynecology, otolaryngology, orthopedic, cancer, pediatric, public, and academic medical center hospitals. Excluded are long-term care facilities such as rehabilitation, long-term acute care, psychiatric, and alcoholism and chemical dependency hospitals. However, if a patient received long-term care, rehabilitation, or treatment for a psychiatric or chemical dependency condition in a community hospital, the discharge record for that stay will be included in the NRD. Unit of analysis The unit of analysis is the hospital discharge (i.e., the hospital stay), not a person or patient. This means that a person who is admitted to the hospital multiple times in 1 year will be counted each time as a separate discharge from the hospital. Costs and charges Total hospital charges were converted to costs using HCUP Cost-to-Charge Ratios based on hospital accounting reports from the Centers for Medicare & Medicaid Services (CMS).b Costs reflect the actual expenses incurred in the production of hospital services, such as wages, supplies, and utility costs; charges represent the amount a hospital billed for the case. For each hospital, a hospital-wide cost-to-charge ratio is used. Hospital charges reflect the amount the hospital billed for the entire hospital stay and do not include professional (physician) fees. For the purposes of this Statistical Brief, missing charges were imputed using the mean charge for the DRG before converting charges to costs. Costs are reported to the nearest hundred. How HCUP estimates of costs differ from National Health Expenditure Accounts There are a number of differences between the costs cited in this Statistical Brief and spending as measured in the National Health Expenditure Accounts (NHEA), which are produced annually by CMS.c The largest source of difference comes from the HCUP coverage of inpatient treatment only in contrast to the NHEA inclusion of outpatient costs associated with emergency departments and other hospital-based outpatient clinics and departments as well. The outpatient portion of hospitals' activities has been growing steadily and may exceed half of all hospital revenue in recent years. On the basis of the American Hospital Association Annual Survey, 2018 outpatient gross revenues (or charges) were about 49 percent of total hospital gross revenues.d Smaller sources of differences come from the inclusion in the NHEA of hospitals that are excluded from HCUP. These include Federal hospitals (Department of Defense, Veterans Administration, Indian Health Services, and Department of Justice [prison] hospitals) as well as psychiatric, substance abuse, and long-term care hospitals. A third source of difference lies in the HCUP reliance on billed charges from hospitals to payers, adjusted to provide estimates of costs using hospital-wide cost-to-charge ratios, in contrast to the NHEA measurement of spending or revenue. HCUP costs estimate the amount of money required to produce hospital services, including expenses for wages, salaries, and benefits paid to staff as well as utilities, maintenance, and other similar expenses required to run a hospital. NHEA spending or revenue measures the amount of income received by the hospital for treatment and other services provided, including payments by insurers, patients, or government programs. The difference between revenues and costs includes profit for for-profit hospitals or surpluses for nonprofit hospitals. Expected payer To make coding uniform across all HCUP data sources, the expected payer for the hospital stay combines detailed categories into general groups:
For this Statistical Brief, a hierarchy was used to assign the payer category based on the primary and secondary expected payer to give precedence to public payers (Medicare and then Medicaid) over commercial insurance. In addition, an indication of any insurance was checked before assigning the payer category to self-pay/no charge:e
About HCUP The Healthcare Cost and Utilization Project (HCUP, pronounced "H-Cup") is a family of healthcare databases and related software tools and products developed through a Federal-State-Industry partnership and sponsored by the Agency for Healthcare Research and Quality (AHRQ). HCUP databases bring together the data collection efforts of State data organizations, hospital associations, and private data organizations (HCUP Partners) and the Federal government to create a national information resource of encounter-level healthcare data. HCUP includes the largest collection of longitudinal hospital care data in the United States, with all-payer, encounter-level information beginning in 1988. These databases enable research on a broad range of health policy issues, including cost and quality of health services, medical practice patterns, access to healthcare programs, and outcomes of treatments at the national, State, and local market levels. HCUP would not be possible without the contributions of the following data collection Partners from across the United States: |
|
Alaska Department of Health and Social Services
Alaska State Hospital and Nursing Home Association Arizona Department of Health Services Arkansas Department of Health California Office of Statewide Health Planning and Development Colorado Hospital Association Connecticut Hospital Association Delaware Division of Public Health District of Columbia Hospital Association Florida Agency for Health Care Administration Georgia Hospital Association Hawaii Laulima Data Alliance Hawaii University of Hawai'i at Hilo Illinois Department of Public Health Indiana Hospital Association Iowa Hospital Association Kansas Hospital Association Kentucky Cabinet for Health and Family Services Louisiana Department of Health Maine Health Data Organization Maryland Health Services Cost Review Commission Massachusetts Center for Health Information and Analysis Michigan Health & Hospital Association Minnesota Hospital Association Mississippi State Department of Health Missouri Hospital Industry Data Institute |
Montana Hospital Association Nebraska Hospital Association Nevada Department of Health and Human Services New Hampshire Department of Health & Human Services New Jersey Department of Health New Mexico Department of Health New York State Department of Health North Carolina Department of Health and Human Services North Dakota (data provided by the Minnesota Hospital Association) Ohio Hospital Association Oklahoma State Department of Health Oregon Association of Hospitals and Health Systems Oregon Office of Health Analytics Pennsylvania Health Care Cost Containment Council Rhode Island Department of Health South Carolina Revenue and Fiscal Affairs Office South Dakota Association of Healthcare Organizations Tennessee Hospital Association Texas Department of State Health Services Utah Department of Health Vermont Association of Hospitals and Health Systems Virginia Health Information Washington State Department of Health West Virginia Department of Health and Human Resources, West Virginia Health Care Authority Wisconsin Department of Health Services Wyoming Hospital Association |
|
About the NRD
The HCUP Nationwide Readmissions Database (NRD) is a calendar-year, discharge-level database constructed from the HCUP State Inpatient Databases (SID) with verified patient linkage numbers that can be used to track a person across hospitals within a State. The 2018 NRD is available for purchase through the HCUP Central Distributor. The NRD is designed to support various types of analyses of national readmission rates. The database includes discharges for patients with and without repeat hospital visits in a year and those who have died in the hospital. Repeat stays may or may not be related. The criteria to determine the relationship between hospital admissions are left to the analyst using the NRD. The NRD was constructed as a sample of convenience consisting of 100 percent of the eligible discharges. Discharge weights for national estimates are developed using the target universe of community hospitals (excluding rehabilitation and long-term acute care hospitals) in the United States. Over time, the sampling frame for the NRD will change; thus, the number of States contributing to the NRD will vary from year to year. The NRD is intended for national estimates only; no regional, State-, or hospital-specific estimates can be produced. The unweighted sample size for the 2018 NRD is 17,686,511 (weighted, this represents 35,460,557 inpatient stays). For More Information For other information on readmissions and revisits, refer to the HCUP Statistical Briefs located at www.hcup-us.ahrq.gov/reports/statbriefs/sb_readmission.jsp. For additional HCUP statistics, visit:
For a detailed description of HCUP and more information on the design of the Nationwide Readmissions Database (NRD), please refer to the following database documentation: Agency for Healthcare Research and Quality. Overview of the Nationwide Readmissions Database (NRD). Healthcare Cost and Utilization Project (HCUP). Rockville, MD: Agency for Healthcare Research and Quality. Updated December 2020. www.hcup-us.ahrq.gov/nrdoverview.jsp. Accessed January 22, 2021. Suggested Citation Weiss AJ (IBM Watson Health), Jiang HJ (AHRQ). Overview of Clinical Conditions With Frequent and Costly Hospital Readmissions by Payer, 2018. HCUP Statistical Brief #278. July 2021. Agency for Healthcare Research and Quality, Rockville, MD www.hcup-us.ahrq.gov/reports/statbriefs/sb278-Conditions-Frequent-Readmissions-By-Payer-2018.pdf. Acknowledgments The authors would like to acknowledge the contributions of Molly Hensche and Minya Sheng of IBM Watson Health and Marguerite Barrett of M.L. Barrett, Inc. *** AHRQ welcomes questions and comments from readers of this publication who are interested in obtaining more information about access, cost, use, financing, and quality of healthcare in the United States. We also invite you to tell us how you are using this Statistical Brief and other HCUP data and tools, and to share suggestions on how HCUP products might be enhanced to further meet your needs. Please email us at hcup@ahrq.gov or send a letter to the address below:Joel W. Cohen, Ph.D., Director Center for Financing, Access and Cost Trends Agency for Healthcare Research and Quality 5600 Fishers Lane Rockville, MD 20857 This Statistical Brief was posted online on July 20, 2021. a Agency for Healthcare Research and Quality. HCUP Clinical Classifications Software Refined (CCSR) for ICD-10-CM Diagnoses. Healthcare Cost and Utilization Project (HCUP). Agency for Healthcare Research and Quality. Updated November 2020. www.hcup-us.ahrq.gov/toolssoftware/ccsr/ccs_refined.jsp. Accessed January 22, 2021. b Agency for Healthcare Research and Quality. HCUP Cost-to-Charge Ratio (CCR) Files. Healthcare Cost and Utilization Project (HCUP). 2001-2017. Agency for Healthcare Research and Quality. Updated September 2020. www.hcup-us.ahrq.gov/db/state/costtocharge.jsp. Accessed January 22, 2021. c For additional information about the NHEA, see Centers for Medicare & Medicaid Services (CMS). National Health Expenditure Data. CMS website. Updated December 17, 2019. www.cms.gov/Research-Statistics-Data-and-Systems/Statistics-Trends-and-Reports/NationalHealthExpendData/index.html?redirect=/NationalHealthExpendData/. Accessed January 22, 2021. d American Hospital Association. TrendWatch Chartbook, 2020. Table 4.2. Distribution of Inpatient vs. Outpatient Revenues, 1995-2018. www.aha.org/system/files/media/file/2020/10/TrendwatchChartbook-2020-Appendix.pdf. e The NRD available for purchase through the HCUP Central Distributor includes the data element for the primary expected payer but not the data element for the secondary expected payer. |
| Supplemental Table 1. Number, rate, and average cost of 30-day all-cause adult hospital readmissions, by expected payer, 2018, for data presented in Figure 1 | |||
| Expected payer | Number of readmissions | Readmission rate per 100 index admissions | Average cost of readmissions, $ |
|---|---|---|---|
| All payers* | 3,795,700 | 14.0 | 15,200 |
| Medicare | 2,290,100 | 16.9 | 15,500 |
| Medicaid | 721,300 | 14.0 | 14,100 |
| Private | 569,800 | 8.7 | 16,400 |
| Self-pay/No Charge† | 136,500 | 12.1 | 10,900 |
| * Statistics for "all payers" include 77,900 readmissions with an expected payer of "other" or missing/invalid expected payer information. † Self-pay/No charge: includes self-pay, no charge, charity, and no expected payment. |
|||