|
STATISTICAL BRIEF #277
July 2021
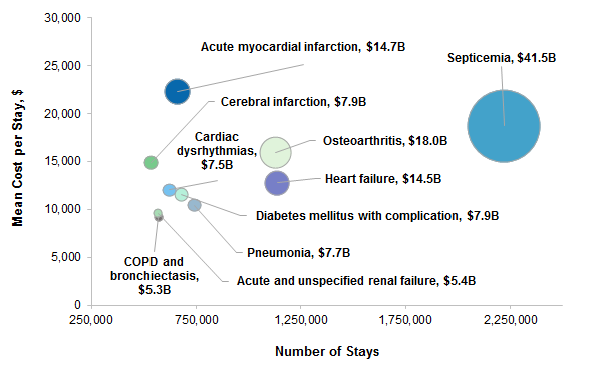
Kimberly W. McDermott, Ph.D., and Marc Roemer, M.S. Introduction Identifying the most frequent primary conditions for which patients are admitted to the hospital is important to the implementation and improvement of healthcare delivery, quality initiatives, and health policy. For example, this information can help establish national health priorities, initiatives, and action plans. Additionally, alternative payment models, such as hospital value-based purchasing programs, often focus on condition-specific metrics.1 At the hospital level, administrators can use diagnosis-related information to inform planning and resource allocation, such as optimizing subspecialty services or units for the care of high-priority conditions. This Healthcare Cost and Utilization Project (HCUP) Statistical Brief presents statistics on the most frequent principal diagnoses among nonmaternal, nonneonatal inpatient stays using the 2018 National Inpatient Sample (NIS). First, the number of stays, mean cost per stay, and aggregate costs are presented for the most frequent principal diagnoses. Second, the distribution of stays for the most common diagnoses by select patient and hospital characteristics is shown. Finally, the top principal diagnoses by sex-age group are identified. Because of the large sample size of the NIS data, small differences can be statistically significant. Thus, only differences greater than or equal to 10 percent are discussed in the text. Findings Most frequent principal diagnoses among nonmaternal, nonneonatal inpatient stays, 2018 Figure 1 displays the aggregate cost of nonmaternal, nonneonatal inpatient stays for the 10 most frequent principal diagnoses in 2018, as indicated by the size of each circle. The mean cost per stay and total number of stays are shown on the y-axis and x-axis, respectively. Estimates of costs and number of stays are also reported in Table 1. |
|
Figure 1. Aggregate cost of nonmaternal, nonneonatal hospital inpatient stays, by mean cost and number of stays, 10 most frequent principal diagnoses, 2018
Abbreviation: B, billion; COPD, chronic obstructive pulmonary disease; ICD-10-CM, International Classification of Diseases, Tenth Revision, Clinical Modification Bubble chart that shows the aggregate cost of nonmaternal, nonneonatal inpatient stays for the 10 most frequent principal diagnoses in 2018, by mean cost and number of stays. Septicemia: no. of stays = 2,218,800; mean cost per stay = $18,700; aggregate costs =$41.5 billion. Heart failure: no. of stays = 1,135,900; mean cost per stay = $12,800; aggregate costs = $14.5 billion. Osteoarthritis: no. of stays = 1,128,100; mean cost per stay = $16,000; aggregate costs = $18.0 billion. Pneumonia: no. of stays = 740,700; mean cost per stay = $10,500; aggregate costs = $7.7 billion. Diabetes mellitus with complication: no. of stays = 678,600; mean cost per stay = $11,600; aggregate costs = $7.9 billion. Acute myocardial infarction: no. of stays = 658,600; mean cost per stay = $22,300; aggregate costs = $14.7 billion. Cardiac dysrhythmias: no. of stays = 620,000; mean cost per stay = $12,100; aggregate costs = $7.5 billion. COPD and bronchiectasis: no. of stays = 569,600; mean cost per stay = $9,200; aggregate costs = $5.3 billion. Acute and unspecified renal failure: no. of stays = 565,800; mean cost per stay = $9,600; aggregate costs = $5.4 billion. Cerebral infarction: no. of stays = 533,400; mean cost per stay = $14,900; aggregate costs = $7.9 billion. |
|
| Table 1. Top 20 principal diagnoses among nonmaternal, nonneonatal inpatient stays, 2018 | ||||||
| Rank | Principal diagnosis | Number of stays | Percent of stays | Aggregate cost, $ billions | Percent of aggregate cost | Mean cost per stay, $ |
|---|---|---|---|---|---|---|
| All nonmaternal/nonneonatal stays | 27,833,500 | 100.0 | 403.6 | 100.0 | 14,500 | |
| Top 20 diagnoses | 13,236,300 | 47.6 | 188.3 | 46.7 | 14,200 | |
| 1 | Septicemia | 2,218,800 | 8.0 | 41.5 | 10.3 | 18,700 |
| 2 | Heart failure | 1,135,900 | 4.1 | 14.5 | 3.6 | 12,800 |
| 3 | Osteoarthritis | 1,128,100 | 4.1 | 18.0 | 4.5 | 16,000 |
| 4 | Pneumonia (except that caused by tuberculosis) | 740,700 | 2.7 | 7.7 | 1.9 | 10,500 |
| 5 | Diabetes mellitus with complication | 678,600 | 2.4 | 7.9 | 1.9 | 11,600 |
| 6 | Acute myocardial infarction | 658,600 | 2.4 | 14.7 | 3.6 | 22,300 |
| 7 | Cardiac dysrhythmias | 620,000 | 2.2 | 7.5 | 1.9 | 12,100 |
| 8 | COPD and bronchiectasis | 569,600 | 2.0 | 5.3 | 1.3 | 9,200 |
| 9 | Acute and unspecified renal failure | 565,800 | 2.0 | 5.4 | 1.3 | 9,600 |
| 10 | Cerebral infarction | 533,400 | 1.9 | 7.9 | 2.0 | 14,900 |
| 11 | Skin and subcutaneous tissue infections | 529,600 | 1.9 | 4.0 | 1.0 | 7,600 |
| 12 | Depressive disorders | 525,000 | 1.9 | 2.8 | 0.7 | 5,400 |
| 13 | Spondylopathies/Spondyloarthropathy | 519,600 | 1.9 | 12.5 | 3.1 | 24,000 |
| 14 | Urinary tract infections | 508,700 | 1.8 | 3.8 | 0.9 | 7,500 |
| 15 | Respiratory failure; insufficiency; arrest | 506,800 | 1.8 | 9.1 | 2.2 | 17,900 |
| 16 | Schizophrenia spectrum and other psychotic disorders | 399,900 | 1.4 | 3.7 | 0.9 | 9,300 |
| 17 | Coronary atherosclerosis and other heart disease | 358,900 | 1.3 | 8.7 | 2.2 | 24,400 |
| 18 | Biliary tract disease | 349,900 | 1.3 | 4.5 | 1.1 | 13,000 |
| 19 | Fluid and electrolyte disorders | 349,800 | 1.3 | 2.7 | 0.7 | 7,600 |
| 20 | Complication of select surgical or medical care, injury, initial encounter* | 338,800 | 1.2 | 6.0 | 1.5 | 17,700 |
| Abbreviations: COPD, chronic obstructive pulmonary disease; ICD-10-CM, International Classification of Diseases, Tenth Revision, Clinical Modification Notes: Diagnoses were identified using the Clinical Classifications Software Refined (CCSR) for ICD-10-CM Diagnoses. Number of stays is rounded to the nearest hundred. Mean cost per stay is rounded to the nearest $100. * This includes complications, such as infection, for surgical or medical care other than those from cardiovascular, genitourinary, or internal orthopedic devices or from organ/tissue transplants. Source: Agency for Healthcare Research and Quality (AHRQ), Healthcare Cost and Utilization Project (HCUP), National Inpatient Sample (NIS), 2018 | ||||||
|
|
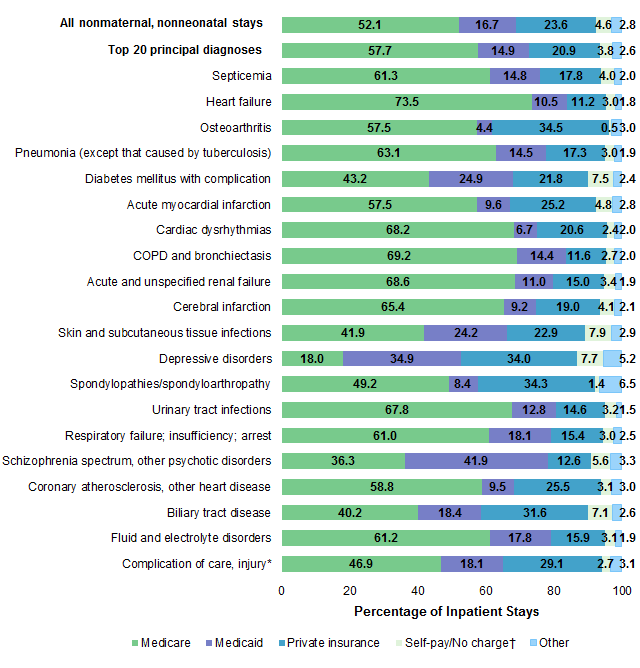
Figure 2. Top 20 principal diagnoses among nonmaternal, nonneonatal inpatient stays, by primary expected payer, 2018
Abbreviations: COPD, chronic obstructive pulmonary disease; ICD-10-CM, International Classification of Diseases, Tenth Revision, Clinical Modification Bar chart that shows the distribution of nonmaternal, nonneonatal inpatient stays for the 20 most common principal diagnoses in 2018 by primary expected payer, as well as the distribution of all nonmaternal, nonneonatal stays. Data are provided in Supplemental Table 1. |
Table 2 presents statistics focusing on the five most frequent principal diagnoses among nonmaternal, nonneonatal stays in the United States by patient location (urbanicity) in 2018. Specifically, the rank of each principal diagnosis within each of the four patient locations is provided, along with the number of stays, rate per 100,000 population, mean length of stay, and mean cost per stay. |
| Table 2. Frequency and outcomes for the five most common principal diagnoses among nonmaternal, nonneonatal inpatient stays, by patient location, 2018 | ||||||
| Rank within United States | Principal diagnosis, patient location | Rank within location category | Number of stays | Rate per 100,000 population | Mean length of stay, days | Mean cost per stay, $ |
|---|---|---|---|---|---|---|
| 1 | Septicemia | |||||
| Large central metropolitan | 1 | 661,000 | 653.4 | 7.5 | 21,500 | |
| Large fringe metropolitan (suburbs) | 1 | 502,300 | 618.3 | 7.1 | 18,500 | |
| Medium and small metropolitan | 1 | 687,700 | 701.5 | 7.0 | 17,100 | |
| Micropolitan and noncore (rural) | 1 | 354,300 | 768.4 | 6.6 | 16,600 | |
| 2 | Heart failure | |||||
| Large central metropolitan | 2 | 326,000 | 322.3 | 5.6 | 14,400 | |
| Large fringe metropolitan (suburbs) | 3 | 267,500 | 329.3 | 5.5 | 13,100 | |
| Medium and small metropolitan | 3 | 341,500 | 348.3 | 5.3 | 11,800 | |
| Micropolitan and noncore (rural) | 3 | 195,000 | 422.9 | 4.9 | 11,300 | |
| 3 | Osteoarthritis | |||||
| Large central metropolitan | 3 | 262,200 | 259.2 | 2.1 | 16,300 | |
| Large fringe metropolitan (suburbs) | 2 | 292,100 | 359.6 | 2.0 | 15,400 | |
| Medium and small metropolitan | 2 | 363,900 | 371.2 | 2.0 | 15,300 | |
| Micropolitan and noncore (rural) | 2 | 208,900 | 453.0 | 2.1 | 17,500 | |
| 4 | Pneumonia (except that caused by tuberculosis) | |||||
| Large central metropolitan | 5 | 178,100 | 176.1 | 4.9 | 11,600 | |
| Large fringe metropolitan (suburbs) | 4 | 168,400 | 207.3 | 4.8 | 10,600 | |
| Medium and small metropolitan | 4 | 225,300 | 229.8 | 4.8 | 9,800 | |
| Micropolitan and noncore (rural) | 4 | 166,600 | 361.2 | 4.4 | 9,900 | |
| 5 | Diabetes mellitus with complication | |||||
| Large central metropolitan | 4 | 212,100 | 209.7 | 5.0 | 12,800 | |
| Large fringe metropolitan (suburbs) | 7 | 148,500 | 182.9 | 4.8 | 11,700 | |
| Medium and small metropolitan | 5 | 205,400 | 209.5 | 4.8 | 10,700 | |
| Micropolitan and noncore (rural) | 8 | 107,600 | 233.4 | 4.6 | 10,600 | |
| Abbreviations: ICD-10-CM, International Classification of Diseases, Tenth Revision, Clinical Modification Notes: Diagnoses were identified using the Clinical Classifications Software Refined (CCSR) for ICD-10-CM Diagnoses. Number of stays is rounded to the nearest hundred. Mean cost per stay is rounded to the nearest $100. Source: Agency for Healthcare Research and Quality (AHRQ), Healthcare Cost and Utilization Project (HCUP), National Inpatient Sample (NIS), 2018 | ||||||
|
| Table 3. Regional variation in frequency and outcomes for the five most common principal diagnoses among nonmaternal, nonneonatal inpatient stays, 2018 | ||||||
| Rank within United States | Principal diagnosis, hospital region | Rank within regioin | Number of stays | Rate per 100,000 population | Mean length of stay, days | Mean cost per stay, $ |
|---|---|---|---|---|---|---|
| 1 | Septicemia | |||||
| Northeast | 1 | 364,200 | 646.5 | 7.7 | 20,000 | |
| Midwest | 1 | 457,8000 | 671.9 | 6.6 | 17,000 | |
| South | 1 | 867,200 | 698.1 | 7.3 | 16,200 | |
| West | 3 | 529,500 | 680.3 | 6.8 | 23,400 | |
| 2 | Heart failure | |||||
| Northeast | 3 | 211,100 | 374.8 | 5.9 | 14,100 | |
| Midwest | 3 | 265,700 | 389.9 | 5.3 | 12,300 | |
| South | 2 | 465,100 | 374.4 | 5.4 | 11,100 | |
| West | 2 | 194,000 | 249.3 | 5.0 | 16,000 | |
| 3 | Osteoarthritis | |||||
| Northeast | 2 | 218,000 | 387.0 | 2.1 | 15,500 | |
| Midwest | 2 | 292,600 | 429.4 | 2.0 | 15,700 | |
| South | 3 | 391,600 | 315.2 | 2.2 | 14,900 | |
| West | 2 | 225,900 | 290.2 | 1.9 | 18,600 | |
| 4 | Pneumonia (except that caused by tuberculosis) | |||||
| Northeast | 4 | 130,000 | 230.8 | 4.9 | 11,100 | |
| Midwest | 4 | 180,900 | 265.5 | 4.5 | 10,100 | |
| South | 4 | 310,800 | 250.2 | 4.8 | 9,400 | |
| West | 6 | 119,100 | 153.0 | 4.5 | 13,200 | |
| 5 | Diabetes mellitus with complication | |||||
| Northeast | 6 | 117,600 | 208.7 | 5.4 | 13,000 | |
| Midwest | 8 | 141,700 | 208.0 | 4.5 | 10,900 | |
| South | 5 | 294,300 | 236.9 | 4.9 | 10,200 | |
| West | 5 | 125,000 | 160.6 | 4.5 | 14,100 | |
| Abbreviations: ICD-10-CM, International Classification of Diseases, Tenth Revision, Clinical Modification Notes: Diagnoses were identified using the Clinical Classifications Software Refined (CCSR) for ICD-10-CM Diagnoses. Number of stays is rounded to the nearest hundred. Mean cost per stay is rounded to the nearest $100. Source: Agency for Healthcare Research and Quality (AHRQ), Healthcare Cost and Utilization Project (HCUP), National Inpatient Sample (NIS), 2018 | ||||||
Table 4 presents, for each sex-age group, the five most frequent principal diagnoses among nonmaternal, nonneonatal inpatient stays in 2018. The number of stays and the rate per 100,000 population are presented. |
| Table 4. Top five principal diagnoses among nonmaternal, nonneonatal inpatient stays by sex-age group, 2018 | |||||||
| Rank | Males | Rank | Females | ||||
|---|---|---|---|---|---|---|---|
| Principal Diagnosis | Number of stays | Rate per 100,000 population | Principal Diagnosis | Number of stays | Rate per 100,000 population | ||
| Ages 0-17 years | 772,200 | 2,050.5 | Ages 0-17 years | 693,600 | 1,922.1 | ||
| 1 | Acute bronchitis | 58,300 | 154.7 | 1 | Depressive disorders | 63,800 | 176.7 |
| 2 | Asthma | 45,200 | 120.0 | 2 | Acute bronchitis | 40,800 | 113.1 |
| 3 | Pneumonia | 35,200 | 93.6 | 3 | Pneumonia | 30,600 | 84.8 |
| 4 | Epilepsy; convulsions | 34,000 | 90.2 | 4 | Asthma | 29,100 | 80.6 |
| 5 | Depressive disorders | 27,800 | 74.0 | 5 | Epilepsy; convulsions | 28,800 | 79.8 |
| Ages 18-44 years | 2,285,300 | 3,870.8 | Ages 18-44 years | 2,268,400 | 3,931.5 | ||
| 1 | Schizophrenia spectrum, other psychotic disorders | 148,300 | 251.2 | 1 | Septicemia | 161,100 | 279.3 |
| 2 | Septicemia | 142,500 | 241.3 | 2 | Depressive disorders | 128,400 | 222.5 |
| 3 | Depressive disorders | 115,200 | 195.0 | 3 | Diabetes mellitus with complication | 87,300 | 151.3 |
| 4 | Diabetes mellitus with complication | 98,300 | 166.4 | 4 | Bipolar and related disorders | 81,900 | 142.0 |
| 5 | Alcohol-related disorders | 90,500 | 153.2 | 5 | Obesity | 81,300 | 140.9 |
| Ages 45-64 years | 4.508,200 | 10,967.1 | Ages 45-64 years | 4,064,100 | 9,415.7 | ||
| 1 | Septicemia | 342,400 | 832.9 | 1 | Septicemia | 310,400 | 719.0 |
| 2 | Osteoarthritis | 189,100 | 460.1 | 2 | Osteoarthritis | 233,900 | 542.0 |
| 3 | Heart failure | 172,900 | 420.6 | 3 | COPD and bronchiectasis | 122,000 | 282.7 |
| 4 | Acute myocardial infarction | 172,700 | 420.2 | 4 | Spondylopathies / spondyloarthropathy | 112,200 | 259.9 |
| 5 | Diabetes mellitus with complication | 158,400 | 385.4 | 5 | Heart failure | 103,500 | 239.7 |
| Ages 65-74 years | 2,873,400 | 20,074.1 | Ages 65-74 years | 2,857,100 | 17,546.0 | ||
| 1 | Septicemia | 258,100 | 1,803.1 | 1 | Osteoarthritis | 259,800 | 1,595.3 |
| 2 | Osteoarthritis | 172,500 | 1,205.0 | 2 | Septicemia | 234,000 | 1,436.8 |
| 3 | Heart failure | 140,400 | 980.9 | 3 | Heart failure | 113,600 | 697.7 |
| 4 | Acute myocardial infarction | 111,000 | 775.6 | 4 | COPD and bronchiectasis | 94,300 | 579.1 |
| 5 | Cardiac dysrhythmias | 94,300 | 659.1 | 5 | Cardiac dysrhythmias | 76,900 | 472.3 |
| Age 75+ years | 3,233,700 | 37,421.6 | Age 75+ years | 4,273,700 | 34,090.0 | ||
| 1 | Septicemia | 348,500 | 4,033.3 | 1 | Septicemia | 397,500 | 3,171.1 |
| 2 | Heart failure | 248,700 | 2,877.7 | 2 | Heart failure | 307,000 | 2,448.5 |
| 3 | Pneumonia | 128,000 | 1,481.7 | 3 | Urinary tract infections | 173,000 | 1,379.8 |
| 4 | Acute and unspecified renal failure | 106,000 | 1,226.7 | 4 | Osteoarthritis | 159,200 | 1,270.0 |
| 5 | Cardiac dysrhythmias | 104,600 | 1,210.5 | 5 | Pneumonia | 159,000 | 1,268.3 |
| Abbreviations: COPD, chronic obstructive pulmonary disease; ICD-10-CM, International Classification of Diseases, Tenth Revision, Clinical Modification Notes: Diagnoses were identified using the Clinical Classifications Software Refined (CCSR) for ICD-10-CM Diagnoses. The pneumonia diagnosis group excludes pneumonia caused by tuberculosis. Number of stays is rounded to the nearest hundred. Source: Agency for Healthcare Research and Quality (AHRQ), Healthcare Cost and Utilization Project (HCUP), National Inpatient Sample (NIS), 2018 | |||||||
1 Centers for Medicare & Medicare Services. The Hospital Value-Based Purchasing (VBP) Program. Updated February 18, 2021. www.cms.gov/Medicare/Quality-Initiatives-Patient-Assessment-Instruments/Value-Based-Programs/HVBP/Hospital-Value-Based-Purchasing. Accessed March 5, 2021. About Statistical Briefs Healthcare Cost and Utilization Project (HCUP) Statistical Briefs provide basic descriptive statistics on a variety of topics using HCUP administrative healthcare data. Topics include hospital inpatient, ambulatory surgery, and emergency department use and costs, quality of care, access to care, medical conditions, procedures, and patient populations, among other topics. The reports are intended to generate hypotheses that can be further explored in other research; the reports are not designed to answer in-depth research questions using multivariate methods. Data Source The estimates in this Statistical Brief are based upon data from the HCUP 2018 National Inpatient Sample (NIS). Supplemental sources included population denominator data for use with HCUP databases, derived from information available from Claritas, a vendor that produces population estimates and projections based on data from the U.S. Census Bureau.a Definitions Diagnoses, ICD-10-CM, Clinical Classifications Software Refined (CCSR) for ICD-10-CM Diagnoses, diagnosis-related groups (DRGs), and major diagnostic categories (MDCs) The principal diagnosis is that condition established after study to be chiefly responsible for the patient's admission to the hospital. Secondary diagnoses are conditions that coexist at the time of admission that require or affect patient care treatment received or management, or that develop during the inpatient stay. All-listed diagnoses include the principal diagnosis plus the secondary conditions. ICD-10-CM is the International Classification of Diseases, Tenth Revision, Clinical Modification. There are over 70,000 ICD-10-CM diagnosis codes. The CCSR aggregates ICD-10-CM diagnosis codes into a manageable number of clinically meaningful categories.b The CCSR is intended to be used analytically to examine patterns of healthcare in terms of cost, utilization, and outcomes; rank utilization by diagnoses; and risk-adjust by clinical condition. The CCSR capitalizes on the specificity of the ICD-10-CM coding scheme and allows ICD-10-CM codes to be classified in more than one category. Approximately 10 percent of diagnosis codes are associated with more than one CCSR category because the diagnosis code documents either multiple conditions or a condition along with a common symptom or manifestation. For this Statistical Brief, the principal diagnosis code is assigned to a single default CCSR based on clinical coding guidelines, etiology and pathology of diseases, and standards set by other Federal agencies. The assignment of the default CCSR for the principal diagnosis is available starting with version v2020.2 of the software tool. ICD-10-CM coding definitions for each CCSR category presented in this Statistical Brief can be found in the CCSR reference file, available at www.hcup-us.ahrq.gov/toolssoftware/ccsr/ccs_refined.jsp#download. For this Statistical Brief, v2021.2 of the CCSR was used. DRGs comprise a patient classification system that categorizes patients into groups that are clinically coherent and homogeneous with respect to resource use. DRGs group patients according to diagnosis, type of treatment (procedure), age, and other relevant criteria. Each hospital stay has one assigned DRG. MDCs assign ICD-10-CM principal diagnosis codes to 1 of 25 general diagnosis categories. In this Statistical Brief, nonneonatal and nonmaternal hospitalizations are identified using the MDCs that are not equal to 14 (Pregnancy, Childbirth and the Puerperium) or 15 (Newborns and Other Neonates with Conditions Originating in the Perinatal Period). Unit of analysis The unit of analysis is the hospital discharge (i.e., the hospital stay), not a person or patient. This means that a person who is admitted to the hospital multiple times in 1 year will be counted each time as a separate discharge from the hospital. Population rates Rates of stays per 100,000 population were calculated using 2018 hospital discharge totals in the numerator and Claritasc estimates of the corresponding 2018 U.S. population (e.g., the population for a specific sex-age group) in the denominator. Individuals hospitalized multiple times are counted more than once in the numerator. Population rate of stays = number of stays among individuals in group divided by number of residents in group times 100,000. Costs and charges Total hospital charges were converted to costs using HCUP Cost-to-Charge Ratios based on hospital accounting reports from the Centers for Medicare & Medicaid Services (CMS).d Costs reflect the actual expenses incurred in the production of hospital services, such as wages, supplies, and utility costs; charges represent the amount a hospital billed for the case. For each hospital, a hospital-wide cost-to-charge ratio is used. Hospital charges reflect the amount the hospital billed for the entire hospital stay and do not include professional (physician) fees. For the purposes of this Statistical Brief, missing charges were imputed as the mean charge for the DRG before converting charges to costs. Costs are reported to the nearest hundred. How HCUP estimates of costs differ from National Health Expenditure Accounts There are a number of differences between the costs cited in this Statistical Brief and spending as measured in the National Health Expenditure Accounts (NHEA), which are produced annually by CMS.e The largest source of difference comes from the HCUP coverage of inpatient treatment only in contrast to the NHEA inclusion of outpatient costs associated with emergency departments and other hospital-based outpatient clinics and departments as well. The outpatient portion of hospitals' activities has been growing steadily and may exceed half of all hospital revenue in recent years. On the basis of the American Hospital Association Annual Survey, 2018 outpatient gross revenues (or charges) were about 49 percent of total hospital gross revenues.f Smaller sources of differences come from the inclusion in the NHEA of hospitals that are excluded from HCUP. These include Federal hospitals (Department of Defense, Veterans Administration, Indian Health Services, and Department of Justice [prison] hospitals) as well as psychiatric, substance abuse, and long-term care hospitals. A third source of difference lies in the HCUP reliance on billed charges from hospitals to payers, adjusted to provide estimates of costs using hospital-wide cost-to-charge ratios, in contrast to the NHEA measurement of spending or revenue. HCUP costs estimate the amount of money required to produce hospital services, including expenses for wages, salaries, and benefits paid to staff as well as utilities, maintenance, and other similar expenses required to run a hospital. NHEA spending or revenue measures the amount of income received by the hospital for treatment and other services provided, including payments by insurers, patients, or government programs. The difference between revenues and costs includes profit for for-profit hospitals or surpluses for nonprofit hospitals. Location of patients' residence Place of residence is based on the urban-rural classification scheme for U.S. counties developed by the National Center for Health Statistics (NCHS) and based on the Office of Management and Budget (OMB) definition of a metropolitan service area as including a city and a population of at least 50,000 residents:
To make coding uniform across all HCUP data sources, the primary expected payer for the hospital stay combines detailed categories into general groups:
For this Statistical Brief, when more than one payer is listed for a hospital discharge, the first-listed payer is used. Region Region is one of the four regions defined by the U.S. Census Bureau:
The Healthcare Cost and Utilization Project (HCUP, pronounced "H-Cup") is a family of healthcare databases and related software tools and products developed through a Federal-State-Industry partnership and sponsored by the Agency for Healthcare Research and Quality (AHRQ). HCUP databases bring together the data collection efforts of State data organizations, hospital associations, and private data organizations (HCUP Partners) and the Federal government to create a national information resource of encounter-level healthcare data. HCUP includes the largest collection of longitudinal hospital care data in the United States, with all-payer, encounter-level information beginning in 1988. These databases enable research on a broad range of health policy issues, including cost and quality of health services, medical practice patterns, access to healthcare programs, and outcomes of treatments at the national, State, and local market levels. HCUP would not be possible without the contributions of the following data collection Partners from across the United States: |
|
Alaska Department of Health and Social Services
Alaska State Hospital and Nursing Home Association Arizona Department of Health Services Arkansas Department of Health California Office of Statewide Health Planning and Development Colorado Hospital Association Connecticut Hospital Association Delaware Division of Public Health District of Columbia Hospital Association Florida Agency for Health Care Administration Georgia Hospital Association Hawaii Laulima Data Alliance Hawaii University of Hawai'i at Hilo Illinois Department of Public Health Indiana Hospital Association Iowa Hospital Association Kansas Hospital Association Kentucky Cabinet for Health and Family Services Louisiana Department of Health Maine Health Data Organization Maryland Health Services Cost Review Commission Massachusetts Center for Health Information and Analysis Michigan Health & Hospital Association Minnesota Hospital Association Mississippi State Department of Health Missouri Hospital Industry Data Institute |
Montana Hospital Association Nebraska Hospital Association Nevada Department of Health and Human Services New Hampshire Department of Health & Human Services New Jersey Department of Health New Mexico Department of Health New York State Department of Health North Carolina Department of Health and Human Services North Dakota (data provided by the Minnesota Hospital Association) Ohio Hospital Association Oklahoma State Department of Health Oregon Association of Hospitals and Health Systems Oregon Office of Health Analytics Pennsylvania Health Care Cost Containment Council Rhode Island Department of Health South Carolina Revenue and Fiscal Affairs Office South Dakota Association of Healthcare Organizations Tennessee Hospital Association Texas Department of State Health Services Utah Department of Health Vermont Association of Hospitals and Health Systems Virginia Health Information Washington State Department of Health West Virginia Department of Health and Human Resources, West Virginia Health Care Authority Wisconsin Department of Health Services Wyoming Hospital Association |
|
About the NIS
The HCUP National (Nationwide) Inpatient Sample (NIS) is a nationwide database of hospital inpatient stays. The NIS is nationally representative of all community hospitals (i.e., short-term, non-Federal, nonrehabilitation hospitals). The NIS includes all payers. It is drawn from a sampling frame that contains hospitals comprising more than 95 percent of all discharges in the United States. The vast size of the NIS allows the study of topics at the national and regional levels for specific subgroups of patients. In addition, NIS data are standardized across years to facilitate ease of use. Over time, the sampling frame for the NIS has changed; thus, the number of States contributing to the NIS varies from year to year. The NIS is intended for national estimates only; no State-level estimates can be produced. The unweighted sample size for the 2018 NIS is 7,105,498 (weighted, this represents 35,527,481 inpatient stays). For More Information For other information on hospital inpatient stays, refer to the HCUP Statistical Briefs located a www.hcup-us.ahrq.gov/reports/statbriefs/sb_hospoverview.jsp. For additional HCUP statistics, visit:
For a detailed description of HCUP and more information on the design of the National Inpatient Sample (NIS), please refer to the following database documentation: Agency for Healthcare Research and Quality. Overview of the National (Nationwide) Inpatient Sample (NIS). Healthcare Cost and Utilization Project (HCUP). Rockville, MD: Agency for Healthcare Research and Quality. Updated December 2020 www.hcup-us.ahrq.gov/nisoverview.jsp. Accessed January 22, 2021. Suggested Citation McDermott KW (IBM Watson Health), Roemer M (AHRQ). Most Frequent Principal Diagnoses for Inpatient Stays in U.S. Hospitals, 2018. HCUP Statistical Brief #277. July, 2021. Agency for Healthcare Research and Quality, Rockville, MD. www.hcup-us.ahrq.gov/reports/statbriefs/sb277-Top-Reasons-Hospital-Stays-2018.pdf. Acknowledgments The authors would like to acknowledge the contributions of Nils Nordstrand of IBM Watson Health. *** AHRQ welcomes questions and comments from readers of this publication who are interested in obtaining more information about access, cost, use, financing, and quality of healthcare in the United States. We also invite you to tell us how you are using this Statistical Brief and other HCUP data and tools, and to share suggestions on how HCUP products might be enhanced to further meet your needs. Please email us at hcup@ahrq.gov or send a letter to the address below:Joel W. Cohen, Ph.D., Director Center for Financing, Access and Cost Trends Agency for Healthcare Research and Quality 5600 Fishers Lane Rockville, MD 20857 This Statistical Brief was posted online on July 13, 2021. a Claritas. Claritas Demographic Profile by ZIP Code. https://claritas360.claritas.com/mybestsegments/. b Agency for Healthcare Research and Quality. HCUP Clinical Classifications Software Refined (CCSR) for ICD-10-CM Diagnoses. Healthcare Cost and Utilization Project (HCUP). Agency for Healthcare Research and Quality. Updated November 2020. https://hcup-us.ahrq.gov/toolssoftware/ccsr/dxccsr.jsp. Accessed June 22, 2021. c Claritas. Claritas Demographic Profile by ZIP Code. https://claritas360.claritas.com/mybestsegments/. d Agency for Healthcare Research and Quality. HCUP Cost-to-Charge Ratio (CCR) Files. Healthcare Cost and Utilization Project (HCUP). 2001-2017. Agency for Healthcare Research and Quality. Updated September 2020. www.hcup-us.ahrq.gov/db/state/costtocharge.jsp. Accessed January 22, 2021. e For additional information about the NHEA, see Centers for Medicare & Medicaid Services (CMS). National Health Expenditure Data. CMS website. Updated December 17, 2019. www.cms.gov/Research-Statistics-Data-and-Systems/Statistics-Trends-and-Reports/NationalHealthExpendData/index.html?redirect=/NationalHealthExpendData/. Accessed January 22, 2021. f American Hospital Association. TrendWatch Chartbook, 2020. Table 4.2. Distribution of Inpatient vs. Outpatient Revenues, 1995-2018. www.aha.org/system/files/media/file/2020/10/TrendwatchChartbook-2020-Appendix.pdf. |
| Supplemental Table 1. Top 20 principal diagnoses among nonmaternal, nonneonatal inpatient stays, by primary expected payer, 2018, for data presented in Figure 2 | |||||
| Principal diagnosis | % of all stays | ||||
|---|---|---|---|---|---|
| Medicare | Medicaid | Private insurance | Self-pay/No charge† | Other | |
| All nonmaternal, nonneonatal stays | 52.1 | 16.7 | 23.6 | 4.6 | 2.8 |
| Top 20 principal diagnoses | 57.7 | 14.9 | 20.9 | 3.8 | 2.6 |
| Septicemia | 61.3 | 14.8 | 17.8 | 4.0 | 2.0 |
| Heart failure | 73.5 | 10.5 | 11.2 | 3.0 | 1.8 |
| Osteoarthritis | 57.5 | 4.4 | 34.5 | 0.5 | 3.0 |
| Pneumonia (except that caused by tuberculosis) | 63.1 | 14.5 | 17.3 | 3.0 | 1.9 |
| Diabetes mellitus with complication | 43.2 | 24.9 | 21.8 | 7.5 | 2.4 |
| Acute myocardial infarction | 57.5 | 9.6 | 25.2 | 4.8 | 2.8 |
| Cardiac dysrhythmias | 68.2 | 6.7 | 20.6 | 2.4 | 2.0 |
| COPD and bronchiectasis | 69.2 | 14.4 | 11.6 | 2.7 | 2.0 |
| Acute and unspecified renal failure | 68.6 | 11.0 | 15.0 | 3.4 | 1.9 |
| Cerebral infarction | 65.4 | 9.2 | 19.0 | 4.1 | 2.1 |
| Skin and subcutaneous tissue infections | 41.9 | 24.2 | 22.9 | 7.9 | 2.9 |
| Depressive disorders | 18.0 | 34.9 | 34.0 | 7.7 | 5.2 |
| Spondylopathies/spondyloarthropathy | 49.2 | 8.4 | 34.3 | 1.4 | 6.5 |
| Urinary tract infections | 67.8 | 12.8 | 14.6 | 3.2 | 1.5 |
| Respiratory failure; insufficiency; arrest | 61.0 | 18.1 | 15.4 | 3.0 | 2.5 |
| Schizophrenia spectrum, other psychotic disorders | 36.3 | 41.9 | 12.6 | 5.6 | 3.3 |
| Coronary atherosclerosis, other heart disease | 58.8 | 9.5 | 25.5 | 3.1 | 3.0 |
| Biliary tract disease | 40.2 | 18.4 | 31.6 | 7.1 | 2.6 |
| Fluid and electrolyte disorders | 61.2 | 17.8 | 15.9 | 3.1 | 1.9 |
| Complication of care, injury* | 46.9 | 18.1 | 29.1 | 2.7 | 3.1 |
| * Complication of select surgical or medical care, injury, initial encounter. This includes complications, such as infection, for surgical or medical care other than those from cardiovascular, genitourinary, or internal orthopedic devices or from organ/tissue transplants. † Self-pay/No charge: includes self-pay, no charge, charity, and no expected payment. |
|||||